Mishkin • Instructor’s Manual for The Economics of Money, Banking, and Financial Markets, Twelfth Edition 219
Chapter 20
ANSWERS TO QUESTIONS
1. “When the stock market rises, investment spending is increasing.” Is this statement true, false,
or uncertain? Explain your answer.
2. Why is inventory investment counted as part of aggregate spending if it isn’t actually sold to
the final end user?
3. “Since inventories can be costly to hold, firms’ planned inventory investment should be zero,
and firms should acquire inventory only through unplanned inventory accumulation.” Is this
statement true, false, or uncertain? Explain your answer.
4. During and in the aftermath of the financial crisis of 2007–2009, planned investment fell
substantially despite significant decreases in the real interest rate. What factors related to
the planned investment function could explain this?
5. If households and firms believe the economy will be in a recession in the future, will this
necessarily cause a recession, or have any impact on output at all?

Mishkin • Instructor’s Manual for The Economics of Money, Banking, and Financial Markets, Twelfth Edition 220
Copyright © 2019 by Pearson Education, Inc. All rights reserved.
substantially, leading to a recession.
6. Why do increases in the real interest rate lead to decreases in net exports, and vice versa?
7. How would a decline in house prices, or decrease in stock market prices affect the IS curve?
8. If firms suddenly become more optimistic about the profitability of investment and planned
investment spending rises by $100 billion, while consumers become more pessimistic and
autonomous consumer spending falls by $100 billion, what happens to aggregate output?
9. If an increase in autonomous consumer expenditure is matched by an equal increase in taxes,
will aggregate output rise or fall?
10. If a change in the interest rate has no effect on planned investment spending or net exports,
what does this imply about the slope of the IS curve?
11. Inventories typically increase starting at the beginning of recessions, and begin to decline
near the end of recessions. What does this say about the relationship between planned
spending and aggregate output over the business cycle?

Mishkin • Instructor’s Manual for The Economics of Money, Banking, and Financial Markets, Twelfth Edition 221
Copyright © 2019 by Pearson Education, Inc. All rights reserved.
firms are slow to increase production, while planned spending typically increases; this leads
to reductions in inventories due to the excess demand for goods.
12. Why do companies cut production when they find that their unplanned inventory investment
is greater than zero? If they didn’t cut production, what effect would this have on their
profits? Why?
13. “Firms will increase production when planned investment is less than (actual) total
investment.” Is this statement true, false, or uncertain? Explain your answer.
14. In each of the cases below, determine whether the IS curve shifts to the right or left, does not
shift, or is indeterminate in the direction of shift.
a. The real interest rate rises.
b. The marginal propensity to consume declines.
c. Financial frictions increase.
d. Autonomous consumption decreases.
e. Both taxes and government spending decrease by the same amount.
f. The sensitivity of net exports to changes in the real interest rate decreases.
g. The government provides tax incentives for research and development programs for
firms.
Mishkin • Instructor’s Manual for The Economics of Money, Banking, and Financial Markets, Twelfth Edition 222
Copyright © 2019 by Pearson Education, Inc. All rights reserved.
Equilibrium output increases at any given interest rate, which shifts the IS curve to the
right.
15. Financial frictions are not a problem for the economy, since they do not affect the safe policy
rate which is controlled by the central bank.” Is this statement true, false, or uncertain?
Explain your answer
16. When the Federal Reserve reduces its policy interest rate, how, if at all, is the IS curve
affected? Briefly explain.
17. Suppose you read that prospects for stronger future economic growth have led the dollar to
strengthen and stock prices to increase.
a. What effect does the strengthened dollar have on the IS curve?
b. What effect does the increase in stock prices have on the IS curve?
c. What is the combined effect of these two events on the IS curve?
Mishkin • Instructor’s Manual for The Economics of Money, Banking, and Financial Markets, Twelfth Edition 223
ANSWERS TO APPLIED PROBLEMS
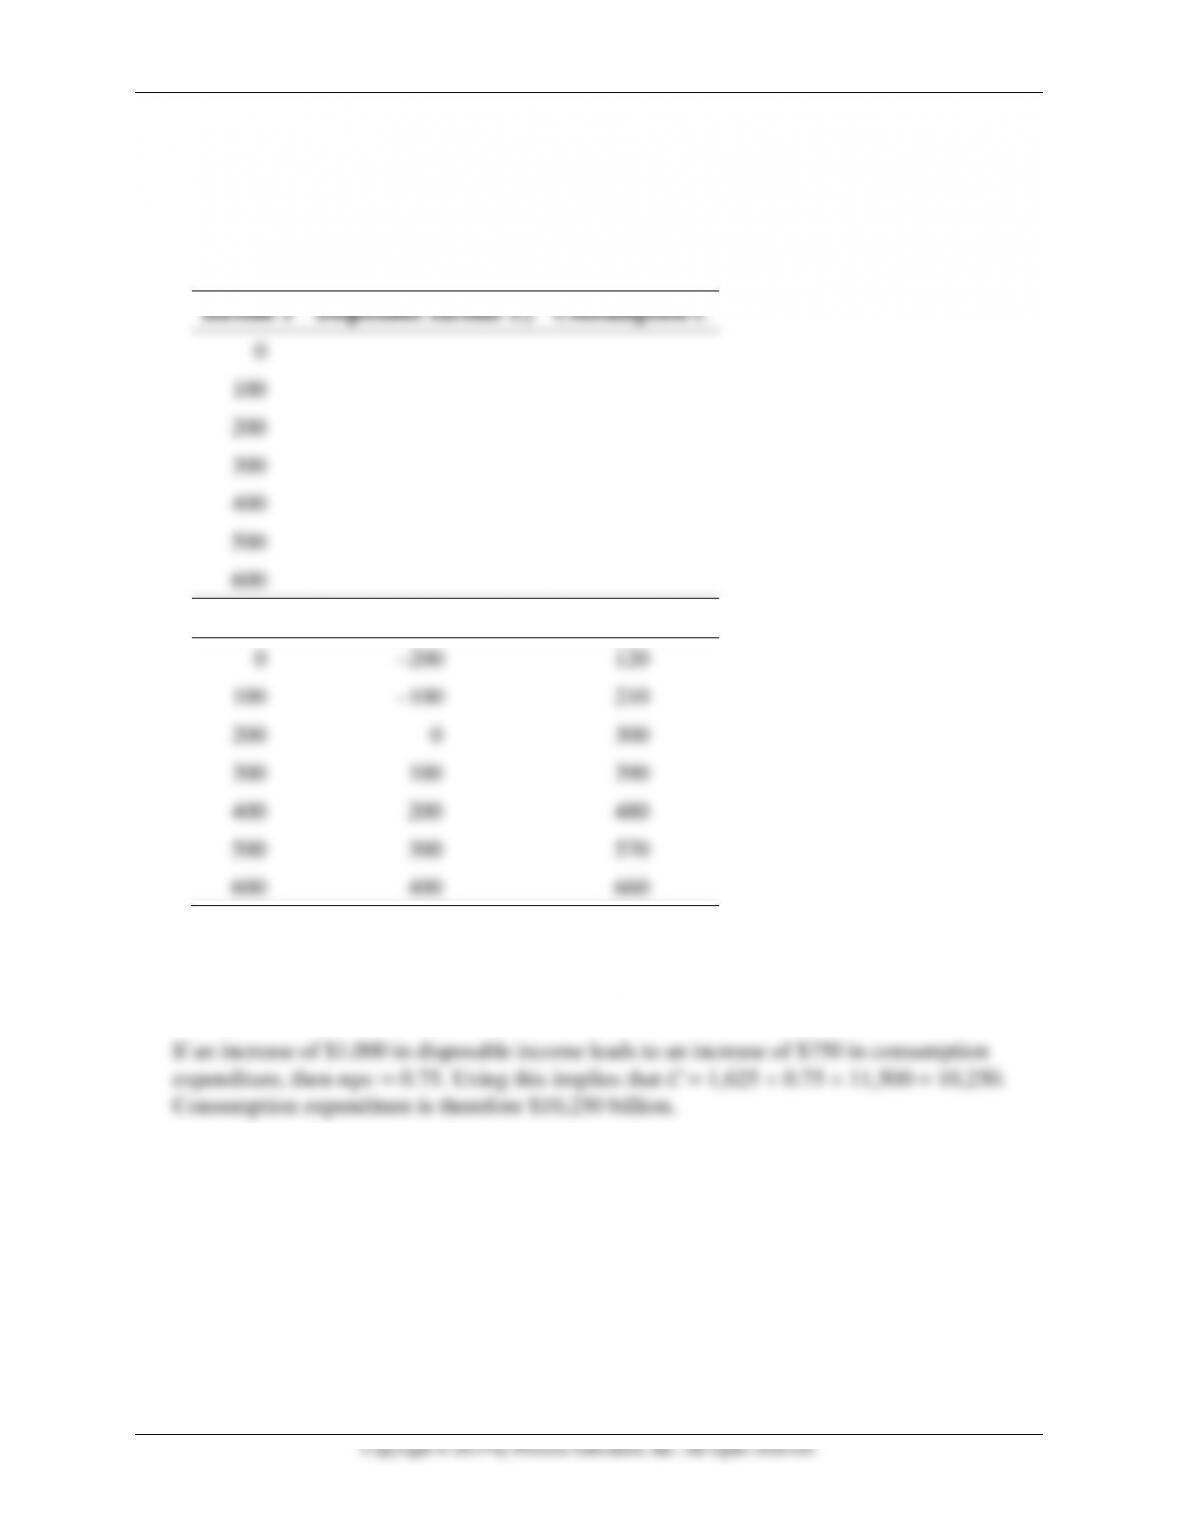
18. Calculate the value of the consumption function at each level of income in the table below if
autonomous consumption = 300, taxes = 200, and mpc = 0.9.
Income Y
Disposable Income YD
Consumption C
0
100
200
300
400
500
600
Income Y
Disposable Income YD
Consumption C
0
–200
120
100
–100
210
200
0
300
300
100
390
400
200
480
500
300
570
600
400
660
19. Assume that autonomous consumption is $1,625 billion and disposable income is $11,500
billion. Calculate consumption expenditure if an increase of $1,000 in disposable income leads
to an increase of $750 in consumption expenditure.


Mishkin • Instructor’s Manual for The Economics of Money, Banking, and Financial Markets, Twelfth Edition 226
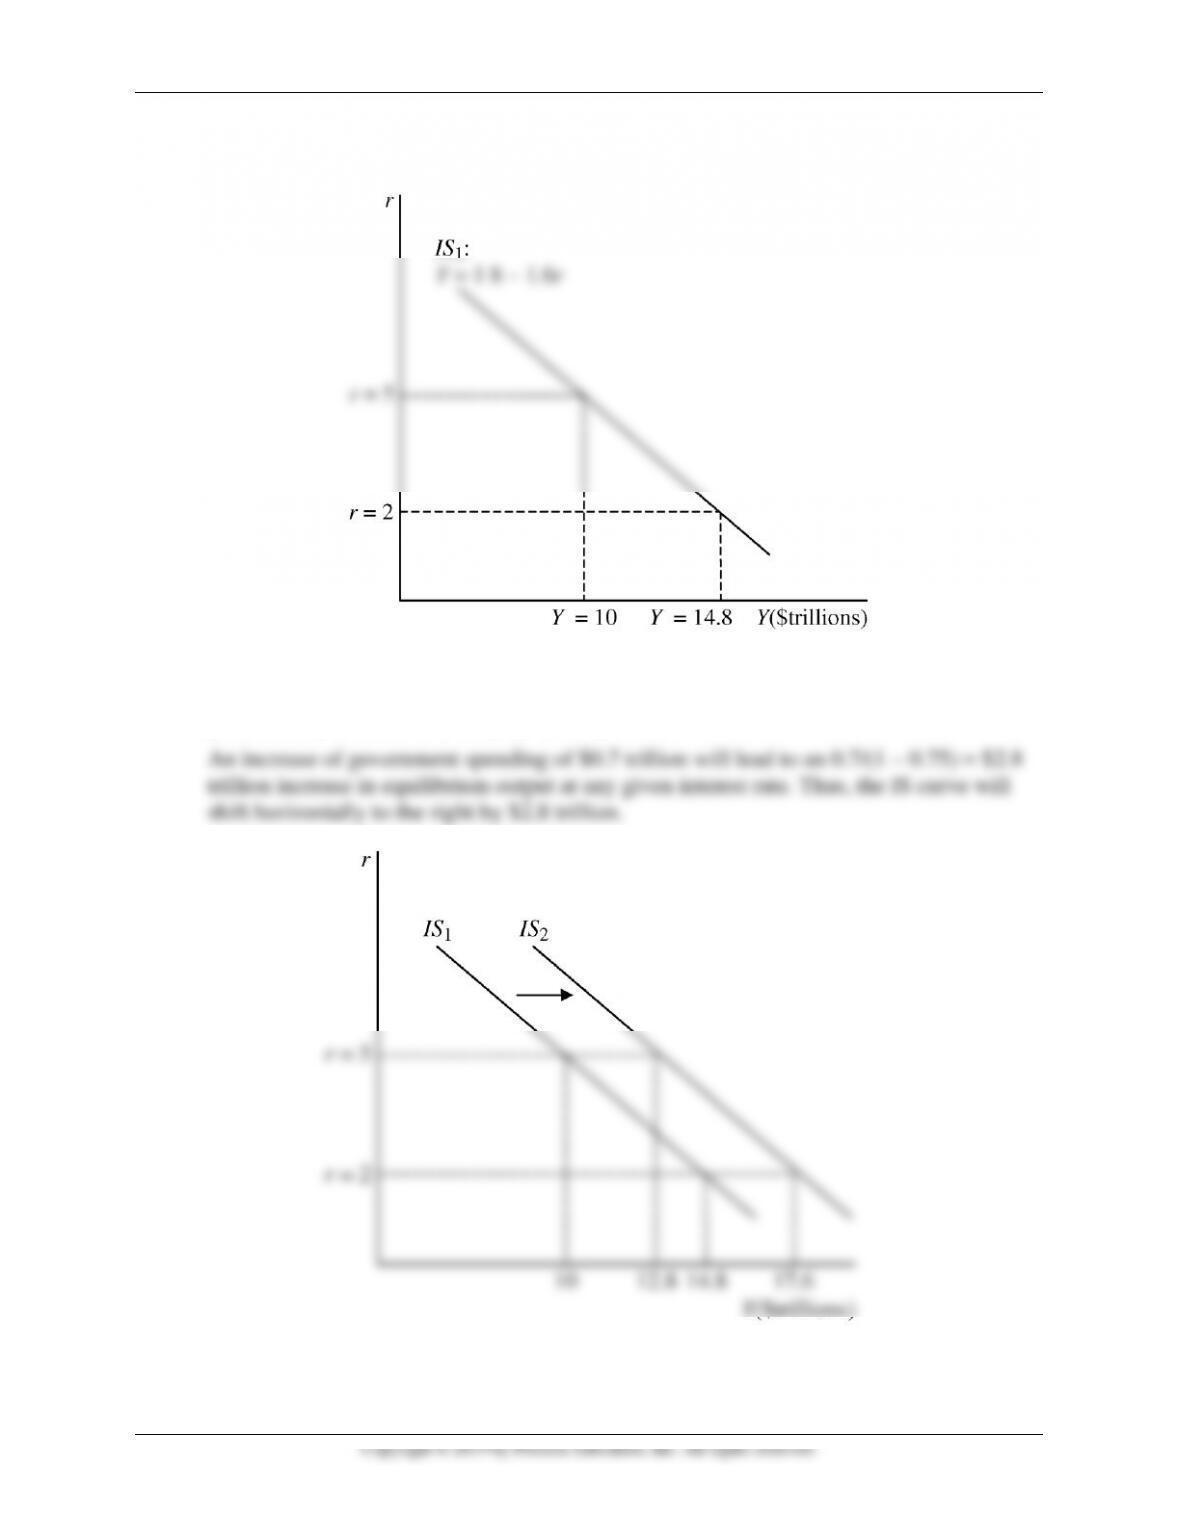
d. Draw a graph of the IS curve showing the answers from part (c) above.
e. If government purchases increase to $4.2 trillion, what will happen to equilibrium output at
r = 2? What will happen to equilibrium output at r = 5? Show the effect of the increase in
government purchases in your graph from part (d).

Mishkin • Instructor’s Manual for The Economics of Money, Banking, and Financial Markets, Twelfth Edition 228
ANSWERS TO DATA ANALYSIS PROBLEMS
1. Go to the St. Louis Federal Reserve FRED database and find data on Personal Consumption
Expenditures (PCEC), Personal Consumption Expenditures: Durable Goods (PCDG),
Personal Consumption Expenditures: Nondurable Goods (PCND), and Personal
Consumption Expenditures: Services (PCESV).
a. Using the most recent data: What percentage of total household expenditures is devoted
to the consumption of goods (both durable and nondurable goods)?
b. Given these data, which specific component of household expenditures would be most
impacted by a reduction in overall household spending? Explain.
Since services are a much larger fraction of consumption than either nondurables or
2. Go to the St. Louis Federal Reserve FRED database and find data on Real Private Domestic
Investment (GPDIC1), a measure of the real interest rate; the 10-year Treasury Inflation-
Indexed Security, TIIS (FII10); and the spread between Baa corporate bonds and the 10-year
U.S. treasury (BAA10YM), a measure of financial frictions. For (FII10) and (BAA10YM),
convert the frequency setting to “quarterly,” and download the data into a spreadsheet. For
each quarter, add the (FII10) and (BAA10YM)series to create ri, the real interest rate for
investments for that quarter. Then calculate the change in both investment and ri as the
change in each variable from the previous quarter.
a. For the eight most recent quarters of data available, calculate the change in investment
from the previous quarter, and then calculate the average change over the eight most
recent quarters.
b. Assume there is a one-quarter lag between movements in ri and changes in investment; in
other words, if ri changes in the current quarter, it will affect investment in the next
quarter. For the eight most recent lagged quarters of data available, calculate the one-
quarter-lagged average change in ri.
Mishkin • Instructor’s Manual for The Economics of Money, Banking, and Financial Markets, Twelfth Edition 229
c. Take the ratio of your answer from part (a) divided by your answer from part (b). What
does this value represent? Briefly explain.
d. Repeat parts (a) through (c) for the period 2008:Q3 to 2009:Q2. How do financial
frictions help explain the behavior of investment during the financial crisis? How do the
coefficients on investment compare between the current period and the financial crisis
period? Briefly explain.