Mishkin • Instructor’s Manual for The Economics of Money, Banking, and Financial Markets, Twelfth Edition 210
Chapter 19
ANSWERS TO QUESTIONS
1. How would you expect velocity to typically behave over the course of the business cycle?
2. If velocity and aggregate output are reasonably constant (as the classical economists
believed), what will happen to the price level when the money supply increases from $1
trillion to $4 trillion?
3. If credit cards were made illegal by congressional legislation, what would happen to
velocity? Explain your answer.
4. “If nominal GDP rises, velocity must rise.” Is this statement true, false, or uncertain?
Explain your answer.
5. Why would a central bank be concerned about persistent, long-term budget deficits?
Persistent long-term budget deficits can lead to the perception or worry that policymakers
6. “Persistent budget deficits always lead to higher inflation.” Is this statement true, false, or
uncertain? Explain your answer.
Mishkin • Instructor’s Manual for The Economics of Money, Banking, and Financial Markets, Twelfth Edition 211
Copyright © 2019 by Pearson Education, Inc. All rights reserved.
However, once bond holders believe that budget deficits have reached unsustainable levels,
they may decide not to hold bonds anymore, and this could force the government to monetize
the debt in order to meet financial obligations. In this case, higher inflation may result.
7. Why might a central bank choose to monetize the debt, knowing that it could lead to higher
inflation?
If the government is running large deficits, this could lead to higher interest rates, which
could be contractionary to the economy or be misaligned from the central bank’s optimal
8. Consider two central banks: one with a history of maintaining price stability and low
inflation, and the other with a history of high inflation and poor inflation management. All
else equal, if the same level of government budget deficit is monetized in both countries, how
is inflation likely to behave in each country?
9. Some payment technologies require infrastructure (e.g., merchants need to have access to
credit card swiping machines). In most developing countries historically this infrastructure
has either been nonexistent or very costly however recent mobile payment systems have
expanded rapidly in developing countries as they have become cheaper. Everything else
being equal, would you expect the transaction component of the demand for money to be
increasing or decreasing in a developing country relative to a rich country?
10. What three motives for holding money did Keynes consider in his liquidity preference theory
of the demand for real money balances? On the basis of these motives, what variables did he
think determined the demand for money?
Mishkin • Instructor’s Manual for The Economics of Money, Banking, and Financial Markets, Twelfth Edition 216
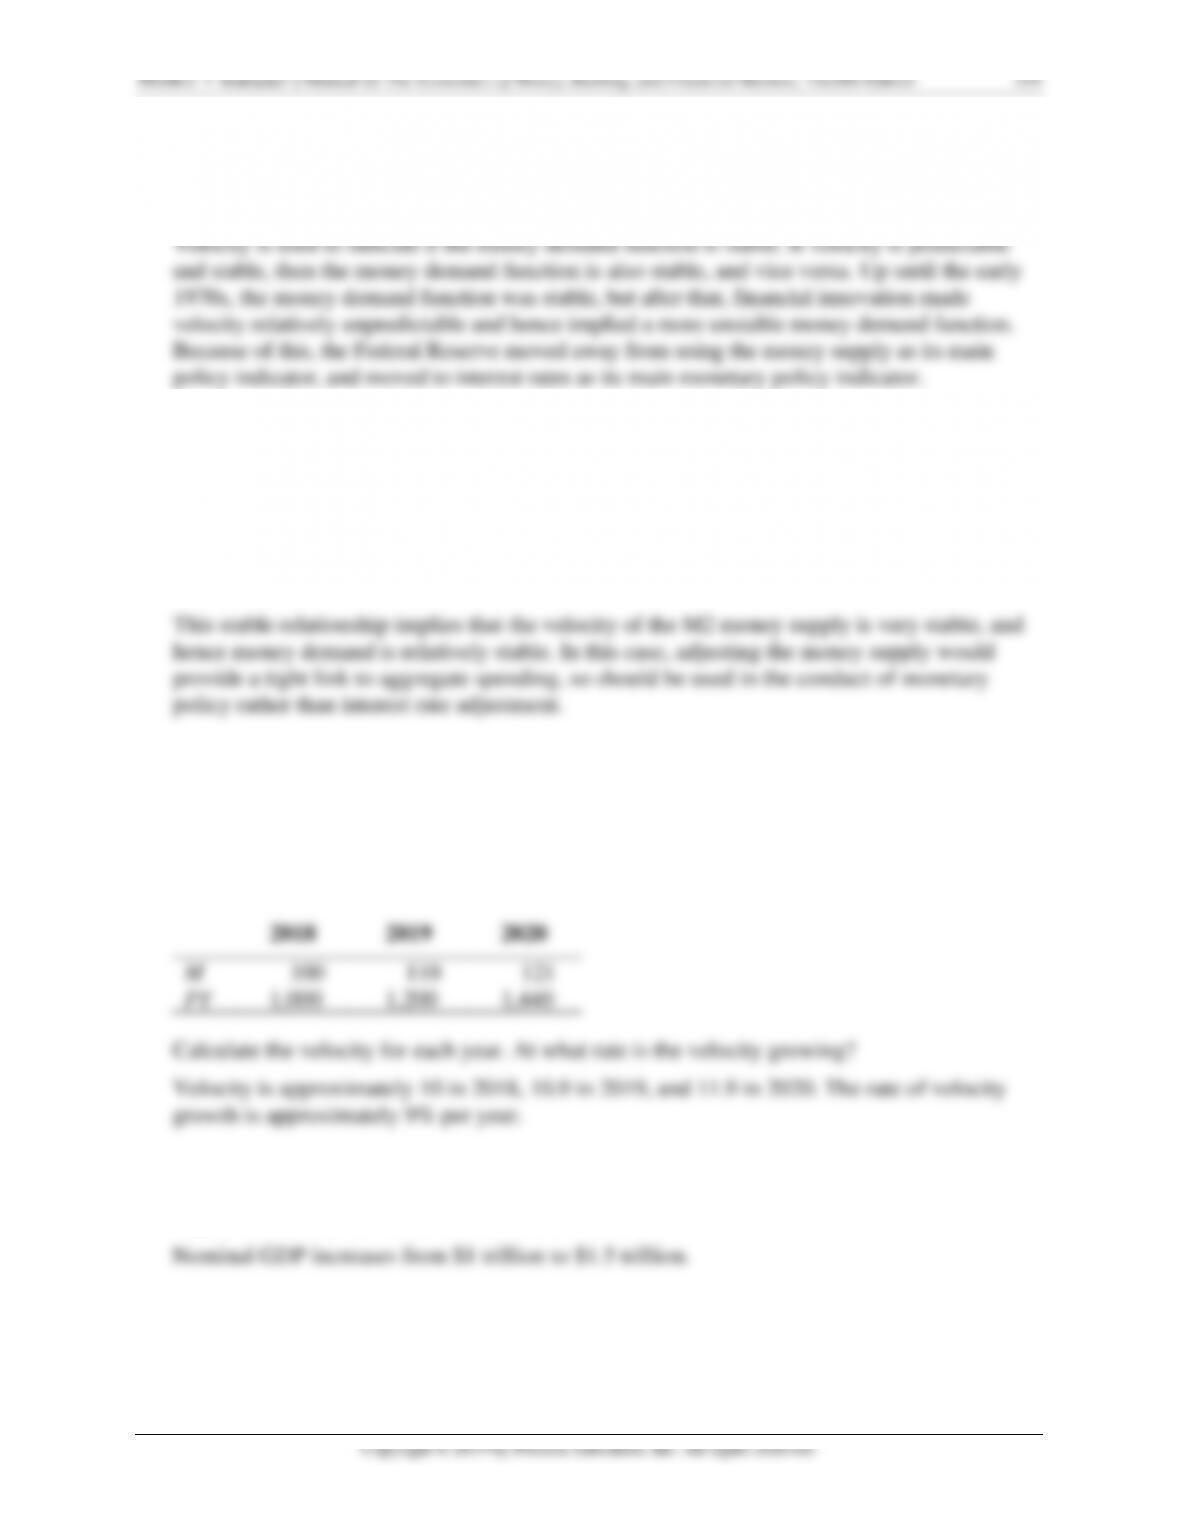
b. Based on your answer to part (a), calculate the average inflation rate since 2000 as
predicted by the quantity theory of money.
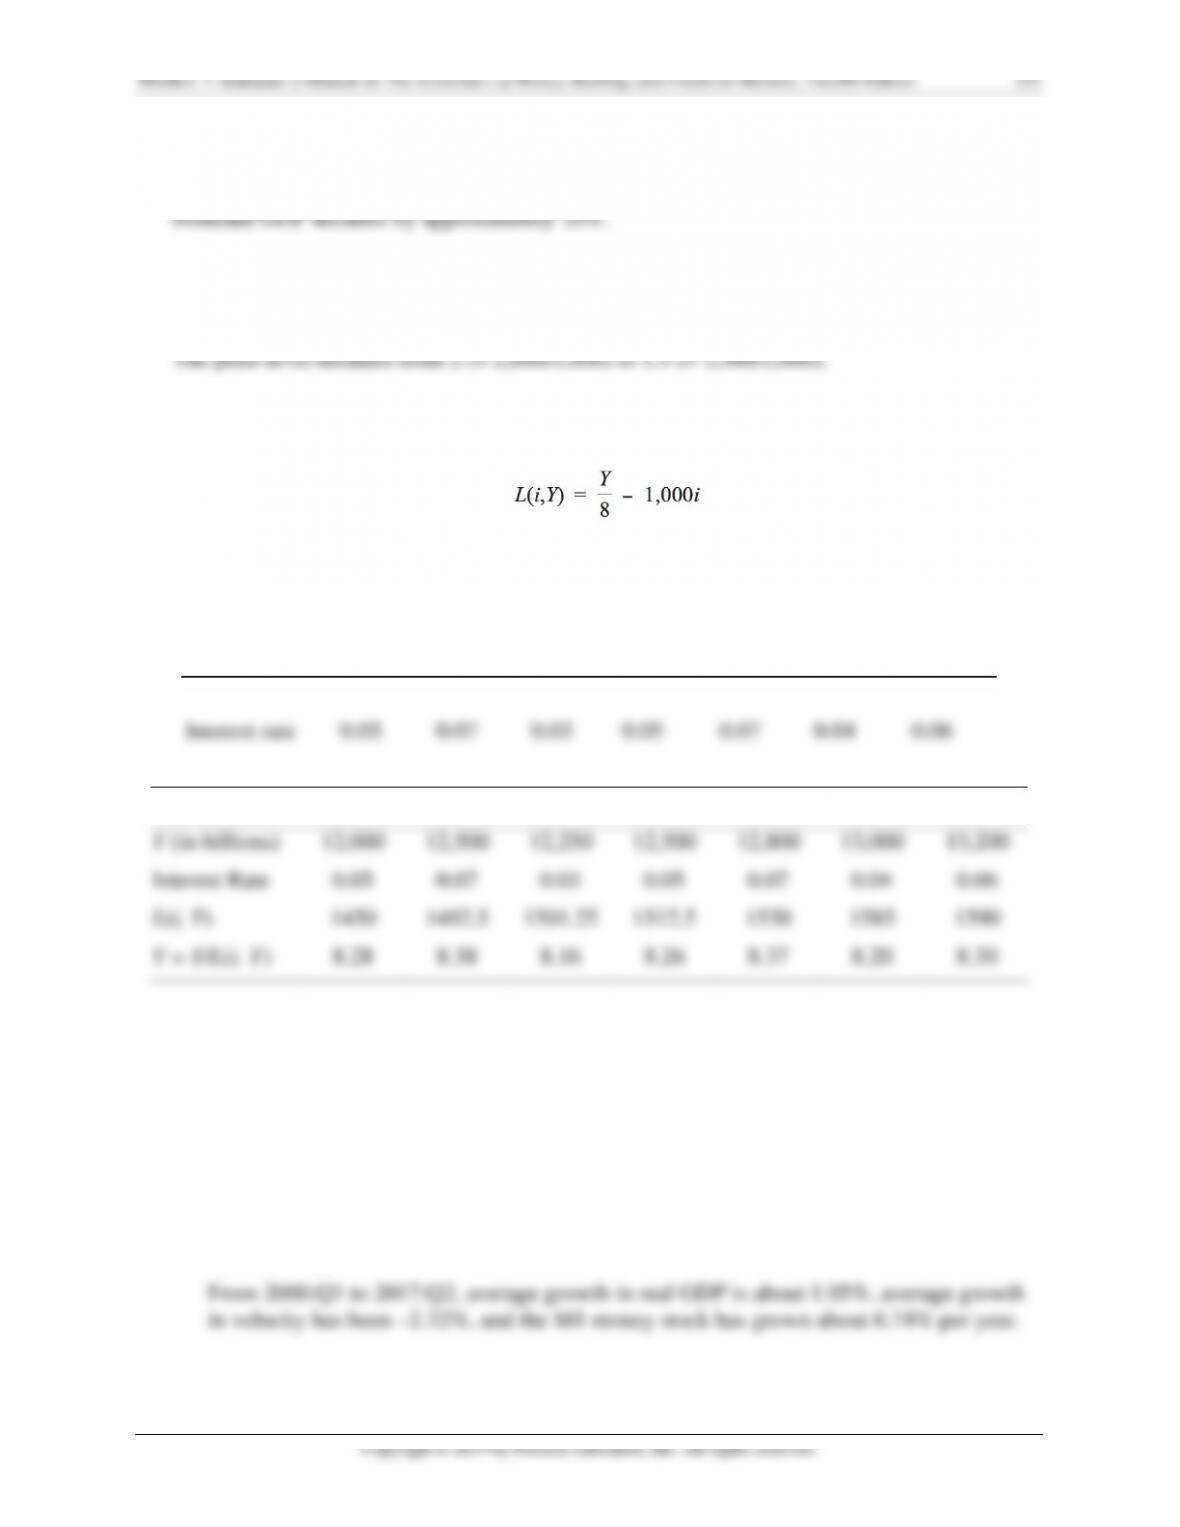
c. Next, find the data on the GDP deflator price index (GDPDEF), download the data using
the ‘Percent Change from Year Ago’ setting, and calculate the average inflation rate
since 2000:Q1. Comment on the value relative to your answer in part (b).
2. Go to the St. Louis Federal Reserve FRED database and find data on the budget deficit
(FYFSD), the amount of federal debt held by the public (FYGFDPUN), and the amount of
federal debt held by the Federal Reserve (FDHBFRBN). Convert the two “debt held” series
to “Annual” using the frequency setting. Download all three series into a spreadsheet. Make
sure that the rows of data align properly to the correct dates. Note that for the deficit series,
a negative number indicates a deficit; multiply the series by –1 so that a deficit is indicated
by a positive number. Manipulate the three series so that all data are given in terms of the
same units (either millions or billions of dollars). To do this, if a series is in millions and you
are converting it to billions, divide the series by 1000. Finally, for each year, convert the two
“debt held” series into one “changes in debt holdings by the public and the Federal
Reserve” series by calculating, for each year, the difference in bond holdings from the
preceding year.
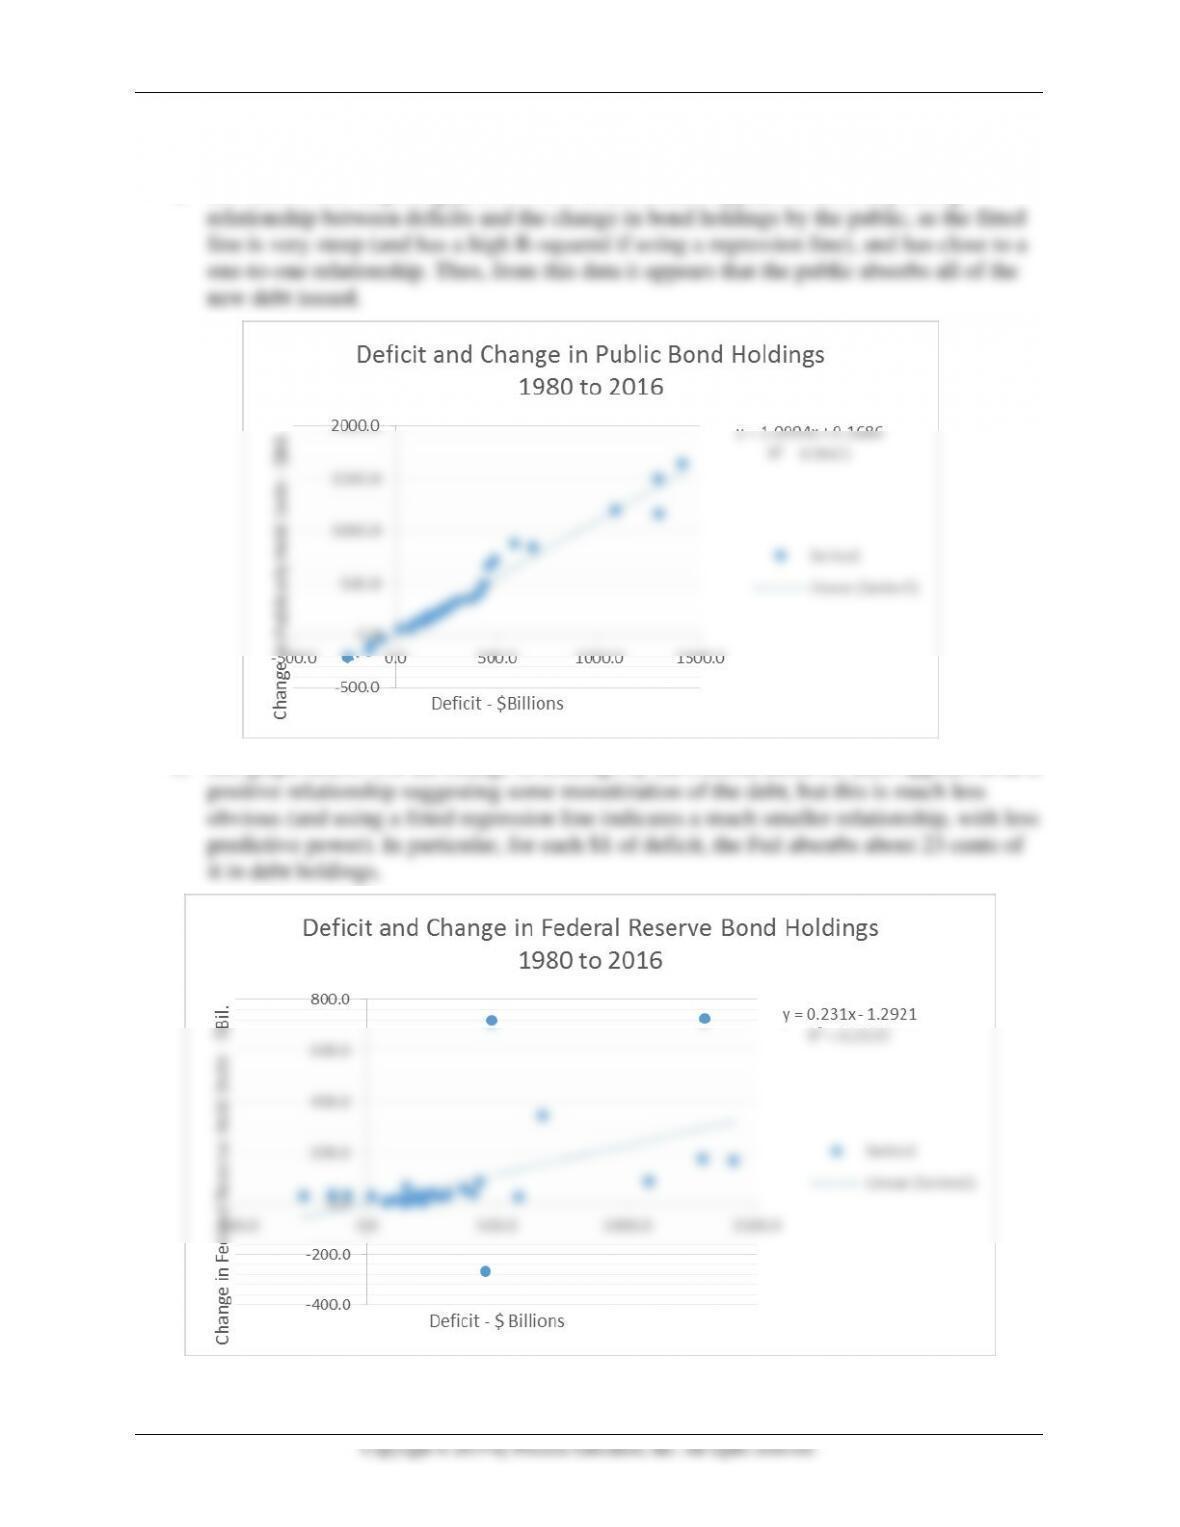
a. Create a scatter plot showing the deficit on the horizontal axis and the change in bond
holdings by the public on the vertical axis, using the data from 1980 through the most
recent period of data available. Insert a fitted line into the scatter plot, and comment on
the relationship between the deficit and the change in public bond holdings.
b. Create a scatter plot showing the deficit on the horizontal axis and the change in bond
holdings by the Federal Reserve on the vertical axis, using the data from 1980 through
the most recent period of data available. Insert a fitted line into the scatter plot, and
comment on the relationship between the deficit and the change in Federal Reserve
bond holdings.
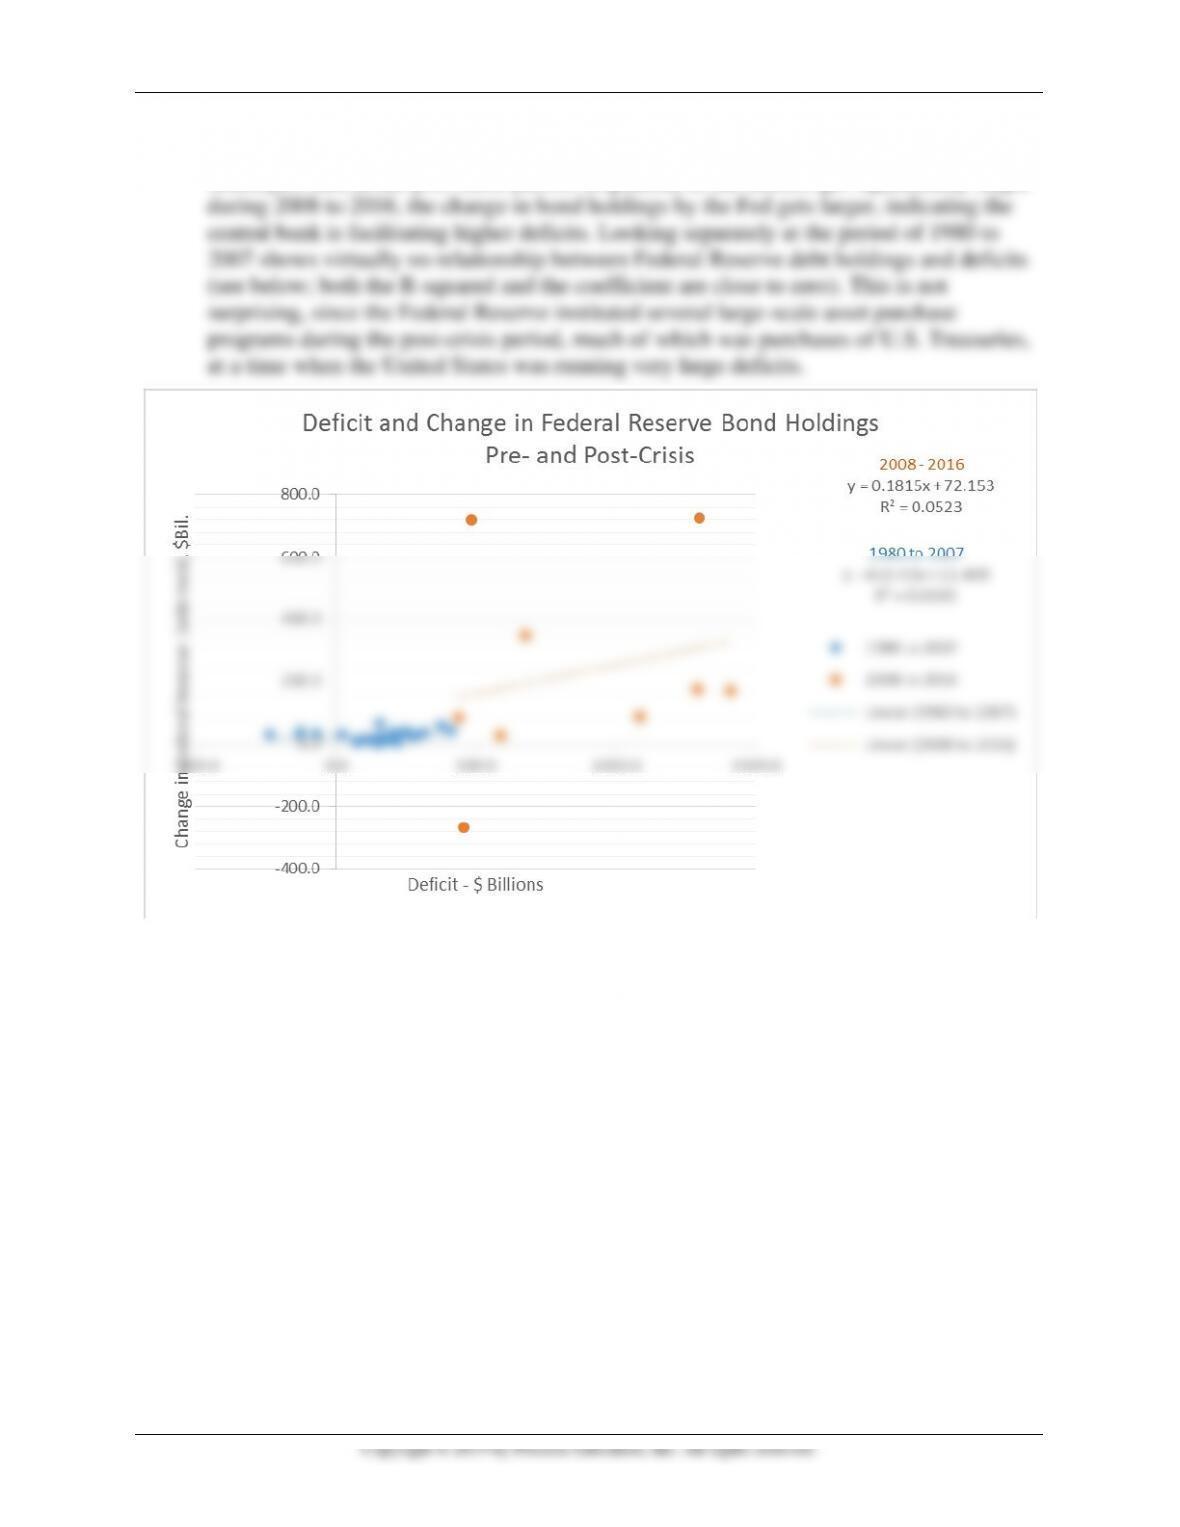
c. Now repeat part (b), but create separate scatterplots for the period of 1980 to 2007, and
2008 to the most recent year. Comment on how, if at all, the monetizing of the debt is
exhibited in the data. Do you think the relationship between the deficit and the change in
bond holdings of the Federal Reserve has changed since 2008? Why or why not?
Mishkin • Instructor’s Manual for The Economics of Money, Banking, and Financial Markets, Twelfth Edition 217
a. See below. Not surprisingly, from 1980 to 2016, there appears to be a very strong
b. See graph below. For the change in holdings by the Federal Reserve, there appears to be a
Mishkin • Instructor’s Manual for The Economics of Money, Banking, and Financial Markets, Twelfth Edition 218
c. See graph below. There appears to be some amount of debt monetization in the
scatterplot data in the post-crisis period: in general, as the deficits get significantly larger