Mishkin • Instructor’s Manual for The Economics of Money, Banking, and Financial Markets, Twelfth Edition 201
Chapter 18
ANSWERS TO QUESTIONS
1. If the Federal Reserve sells dollars in the foreign exchange market but conducts an offsetting
open market operation to sterilize the intervention, what will be the effect on international
reserves, the money supply, and the exchange rate?
2. If the Federal Reserve buys dollars in the foreign exchange market but does not sterilize the
intervention, what will be the impact on international reserves, the money supply, and the
exchange rate?
3. For each of the following, identify whether they increase or decrease the current account
balance:
Mishkin • Instructor’s Manual for The Economics of Money, Banking, and Financial Markets, Twelfth Edition 206
ASWERS TO APPLIED PROBLEMS
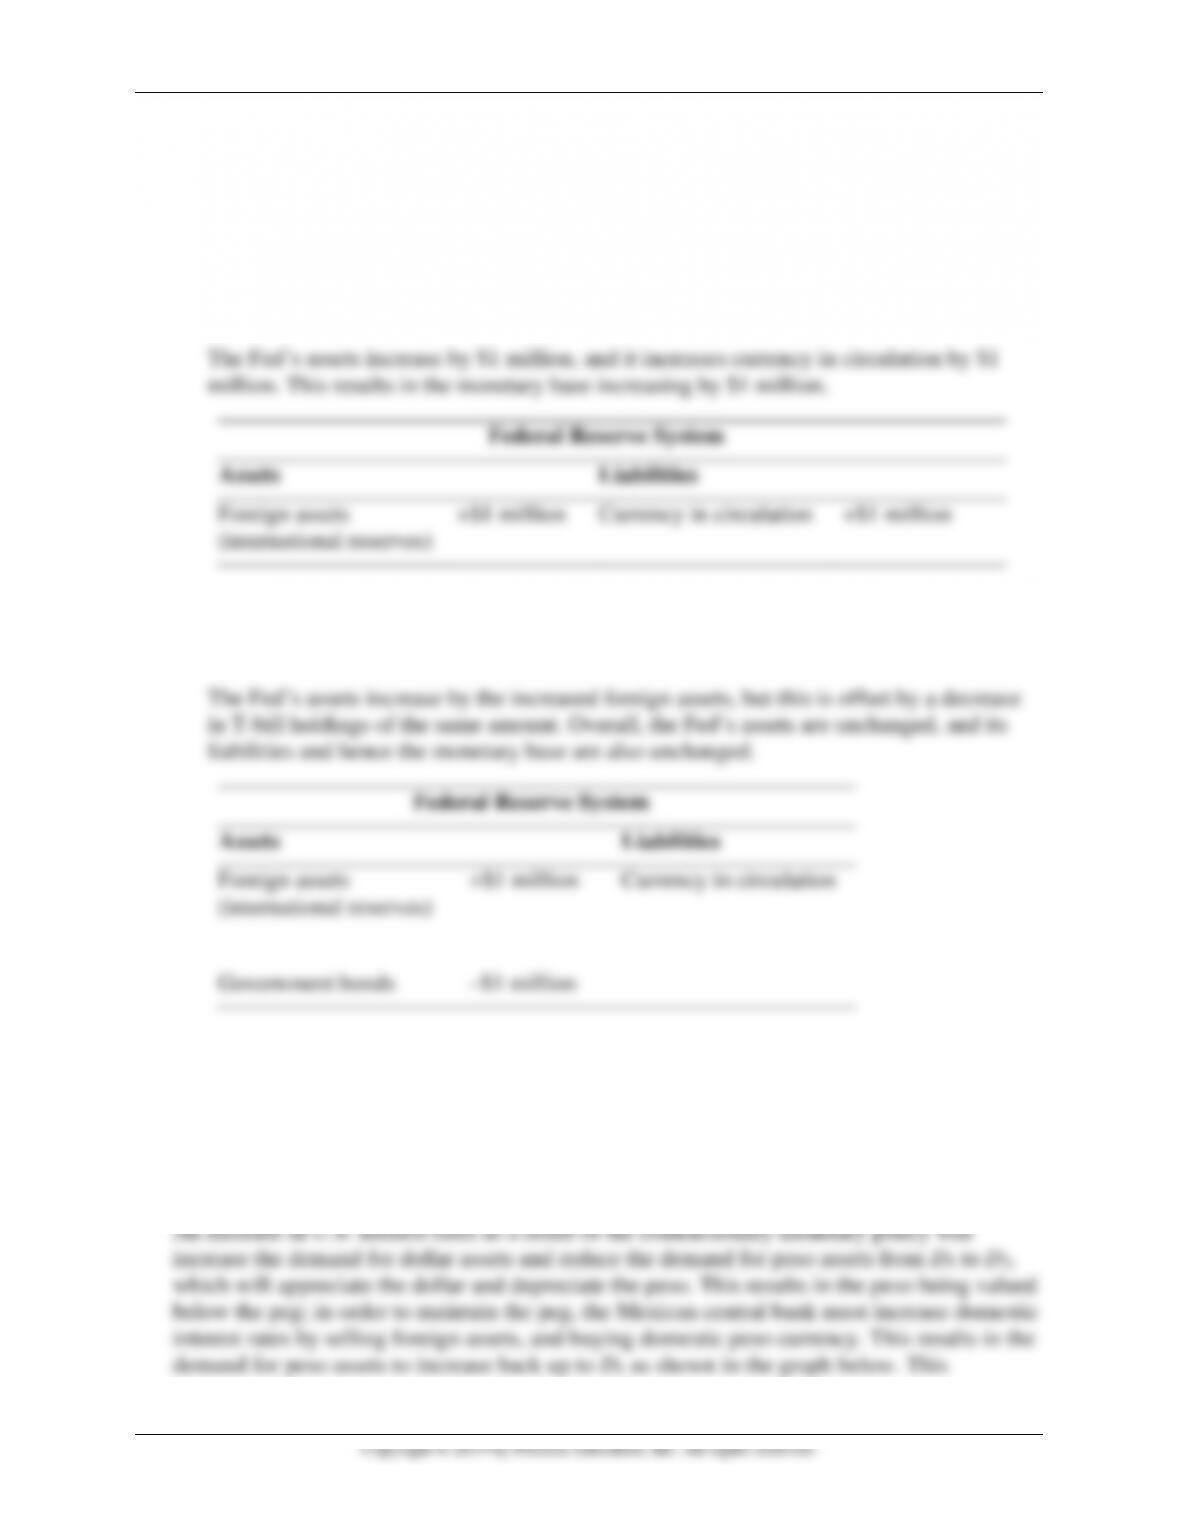
23. Suppose the Federal Reserve purchases $1,000,000 worth of foreign assets.
a. If the Federal Reserve purchases the foreign assets with $1,000,000 in currency, show
the effect of this open market operation, using T-accounts. What happens to the monetary
base?
Mishkin • Instructor’s Manual for The Economics of Money, Banking, and Financial Markets, Twelfth Edition 207
Copyright © 2019 by Pearson Education, Inc. All rights reserved.
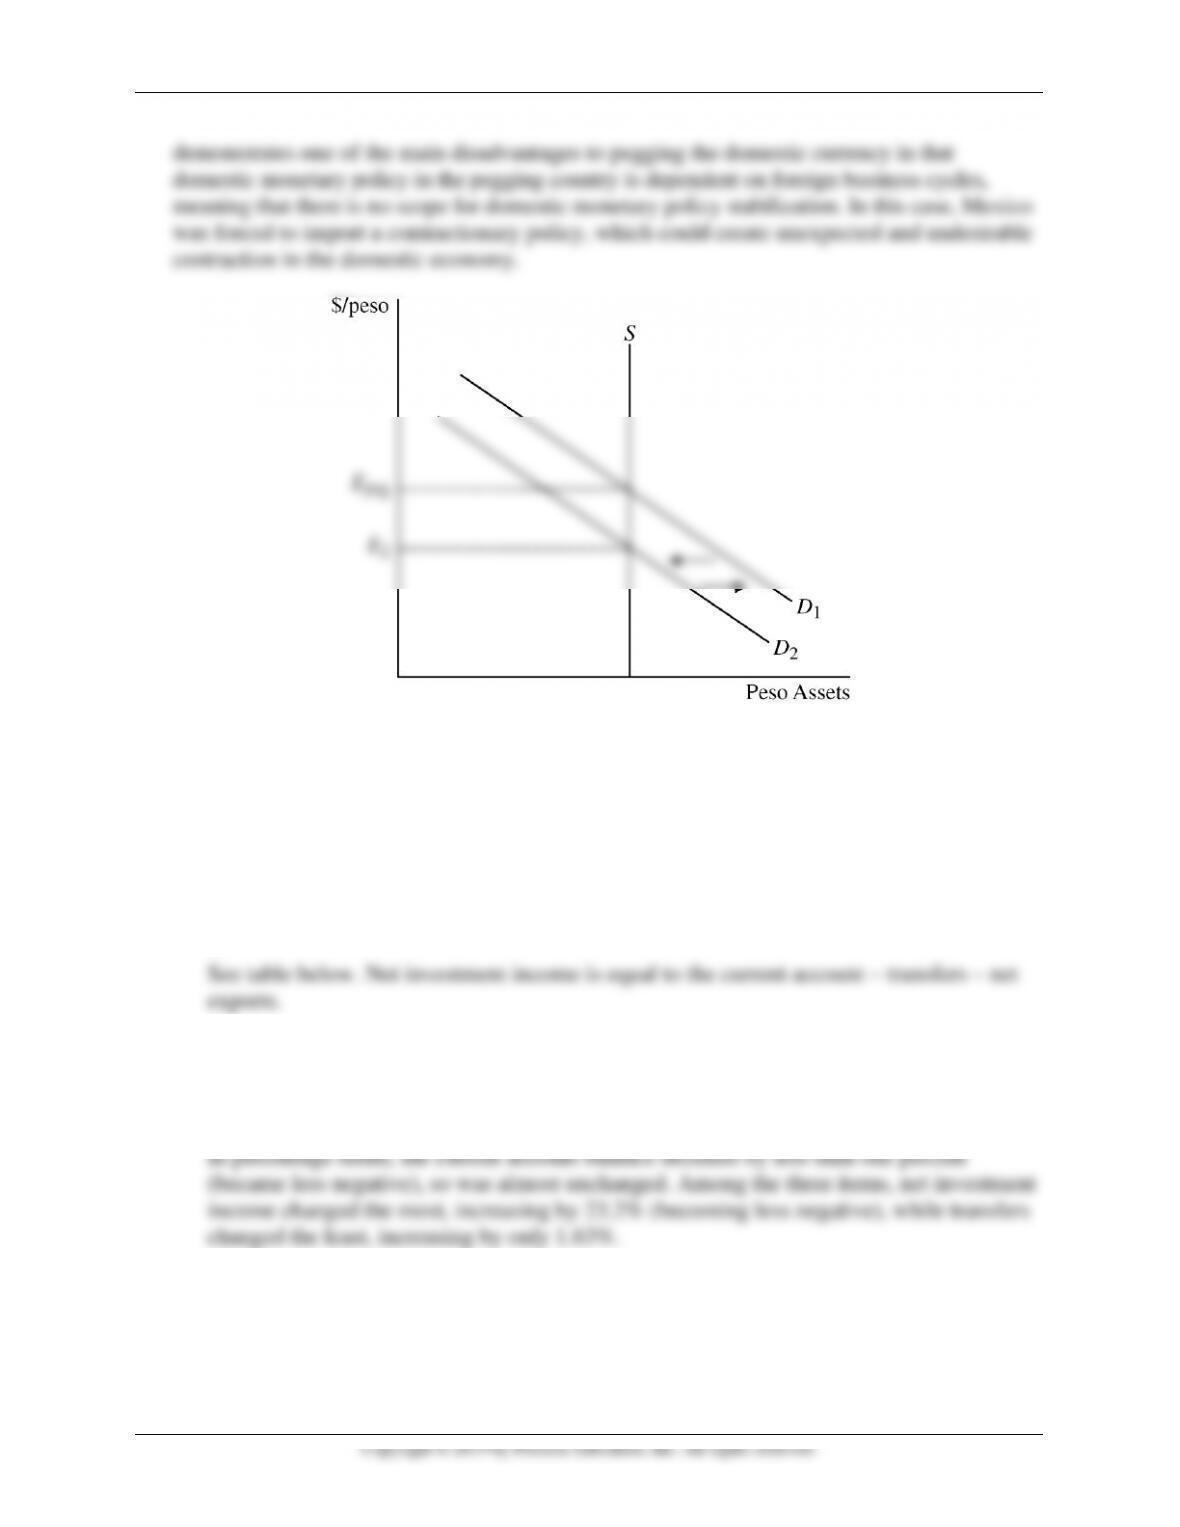
demonstrates one of the main disadvantages to pegging the domestic currency in that
domestic monetary policy in the pegging country is dependent on foreign business cycles,
meaning that there is no scope for domestic monetary policy stabilization. In this case, Mexico
was forced to import a contractionary policy, which could create unexpected and undesirable
contraction in the domestic economy.
ANSWERS TO DATA ANALYSIS PROBLEMS
1. Go to the St. Louis Federal Reserve FRED database, and find data on net exports
(NETEXP), transfers, (A123RC1Q027SBEA) and the current account balance (NETFI).
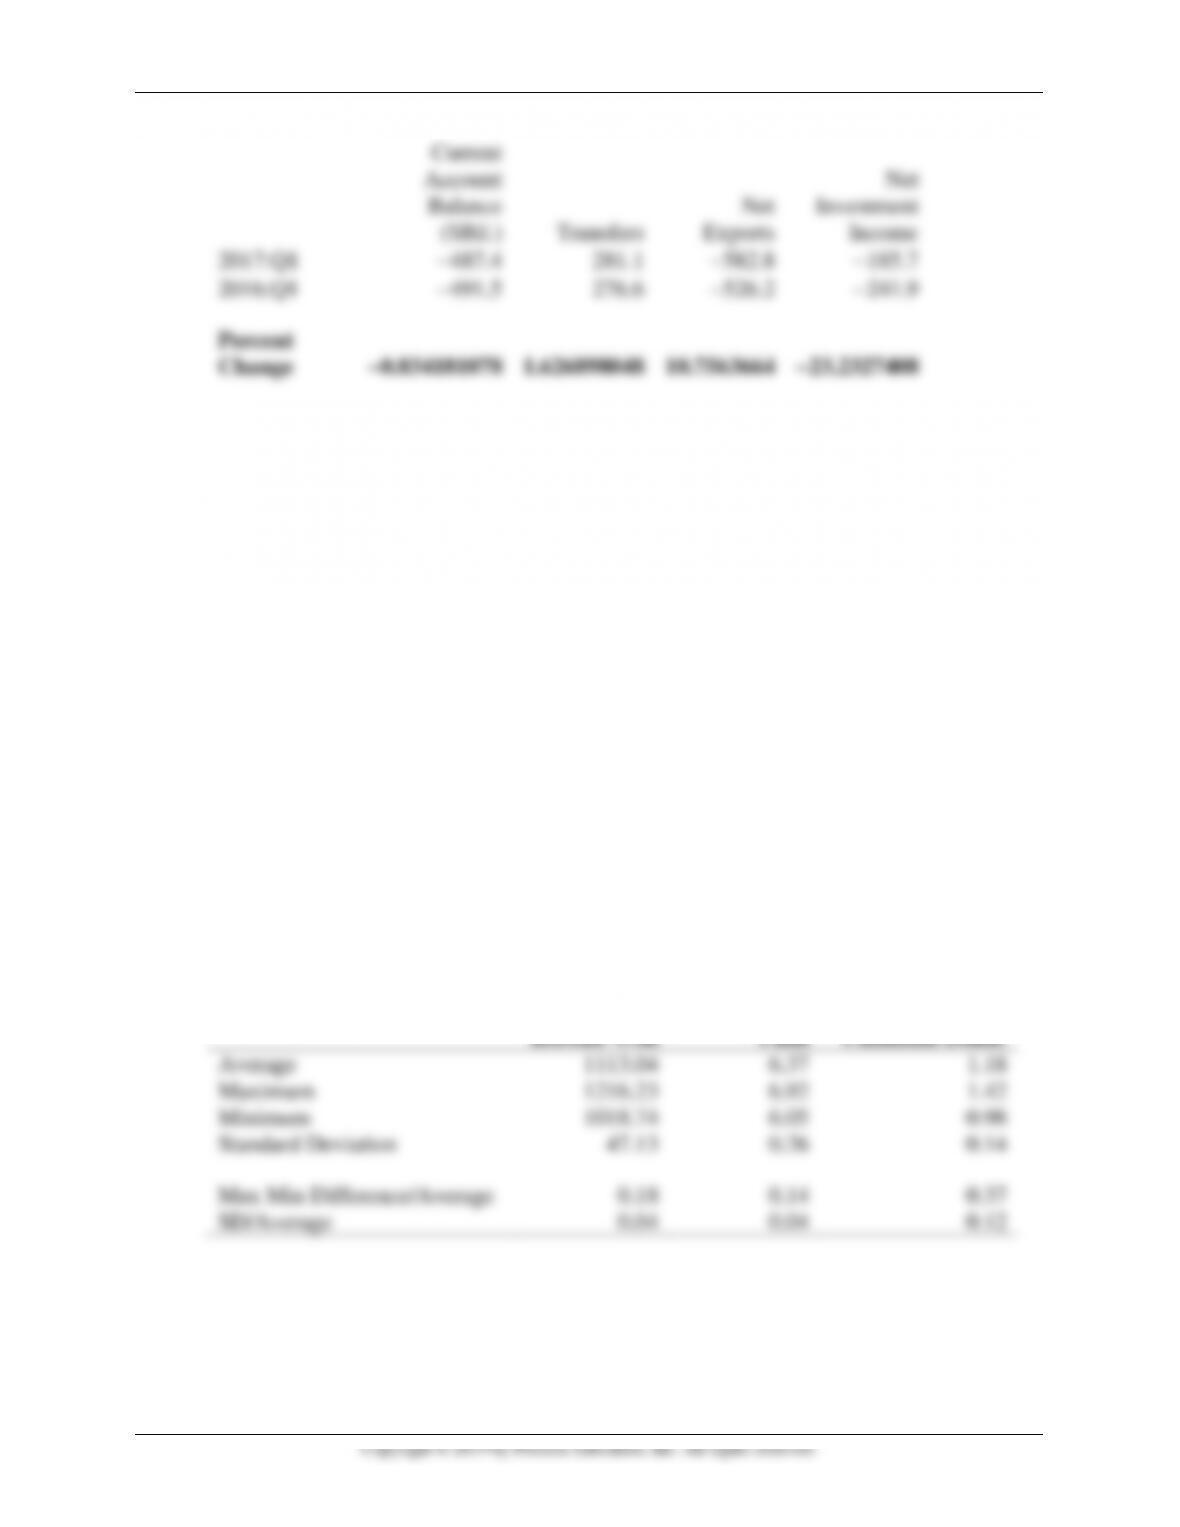
a. Calculate net investment income for the most recent quarter available, and for the same
quarter a year earlier.
b. Calculate the percentage change in the current account balance from the same quarter
one year earlier. Which one of the three items making up the current account balance
had the largest effect in percentage terms on the change of the current account? Which
one had the smallest effect?
Mishkin • Instructor’s Manual for The Economics of Money, Banking, and Financial Markets, Twelfth Edition 208
Current
Account
Balance
($Bil.)
Transfers
Net
Exports
Net
Investment
Income
2017:Q1
−487.4
281.1
−582.8
−185.7
2016:Q1
−491.5
276.6
−526.2
−241.9
Percent
Change
−0.834181078
1.626898048
10.7563664
−23.2327408
2. Go to the St. Louis Federal Reserve FRED database and find data on the monthly U.S. dollar
exchange rate to the Chinese yuan (EXCHUS), the Canadian dollar (EXCAUS), and the
South Korean won (EXKOUS). Download the data into a spreadsheet.
a. For the most recent five-year period of data available, use the average, max, min, and
stdev functions in Excel to calculate the average, highest, and lowest exchange rate
values, as well as the standard deviation of the exchange rate to the dollar (this is an
absolute measure of the volatility of the exchange rate).
b. Using the maximum and minimum values of each exchange rate over the last five years,
calculate the ratio of the difference between the maximum and minimum values to the
average level of the exchange rate (expressed as a percentage by multiplying by 100).
This value gives an indication of how tightly the exchange rate moves. Based on your
results, which of the three countries is most likely to peg its currency to the U.S. dollar?
How does this country’s currency compare with the other two?
c. Calculate the ratio of the standard deviation to the average exchange rate over the last
five years (expressed as a percentage by multiplying by100). This value gives an
indication of how volatile the exchange rate is. Based on your results, which of the three
currencies is most likely to be pegged to the U.S. dollar? How does this currency
compare with the other two?
a. See table below for July 2012 to July 2017.
South
Korean Won
Chinese
Yuan
Canadian Dollar
Average
1113.04
6.37
1.18
Maximum
1216.23
6.92
1.42
Minimum
1018.74
6.05
0.98
Standard Deviation
47.13
0.26
0.14
Max Min Difference/Average
0.18
0.14
0.37
SD/Average
0.04
0.04
0.12
Mishkin • Instructor’s Manual for The Economics of Money, Banking, and Financial Markets, Twelfth Edition 209
Copyright © 2019 by Pearson Education, Inc. All rights reserved.
b. (b) See table above. The Chinese yuan has a much smaller band that it moves in
relative to the average value; at only 14% of the average, this is slightly smaller than
the South Korean Won, and more than half as much as the Canadian dollar bands that
they fluctuated in over the last five years. Hence the Chinese yuan is the most likely
to be pegged.
c. The results are largely consistent with part (b); China’s currency along with South
Korea’s is the least volatile relative to the U.S. dollar with a standard deviation three
times smaller than that of the Canadian dollar (as a percentage of the average).