Mishkin • Instructor’s Manual for The Economics of Money, Banking, and Financial Markets, Twelfth Edition 179
Chapter 16
ANSWERS TO QUESTIONS
1. What are the benefits of using a nominal anchor for the conduct of monetary policy?
2. What incentives arise for a central bank to fall into the time-inconsistency trap of pursuing
overly expansionary monetary policy?
3. Why would it be problematic for a central bank to have a primary goal of maximizing
economic growth?
This could pose a problem for a couple reasons. First of all, monetary policy has limited
4. “Since financial crises can impart severe damage to the economy, a central bank’s primary
goal should be to ensure stability in financial markets.” Is this statement true, false, or
uncertain? Explain.
Uncertain. Most economists probably would not dispute that trying to maintain stability in
financial markets is important to the economy. However, having a constant and prioritized
Mishkin • Instructor’s Manual for The Economics of Money, Banking, and Financial Markets, Twelfth Edition 185
e. The Fed revises its (implicit) inflation target downward.
f. The equilibrium real fed funds rate decreases.
ANSWERS TO APPLIED PROBLEMS
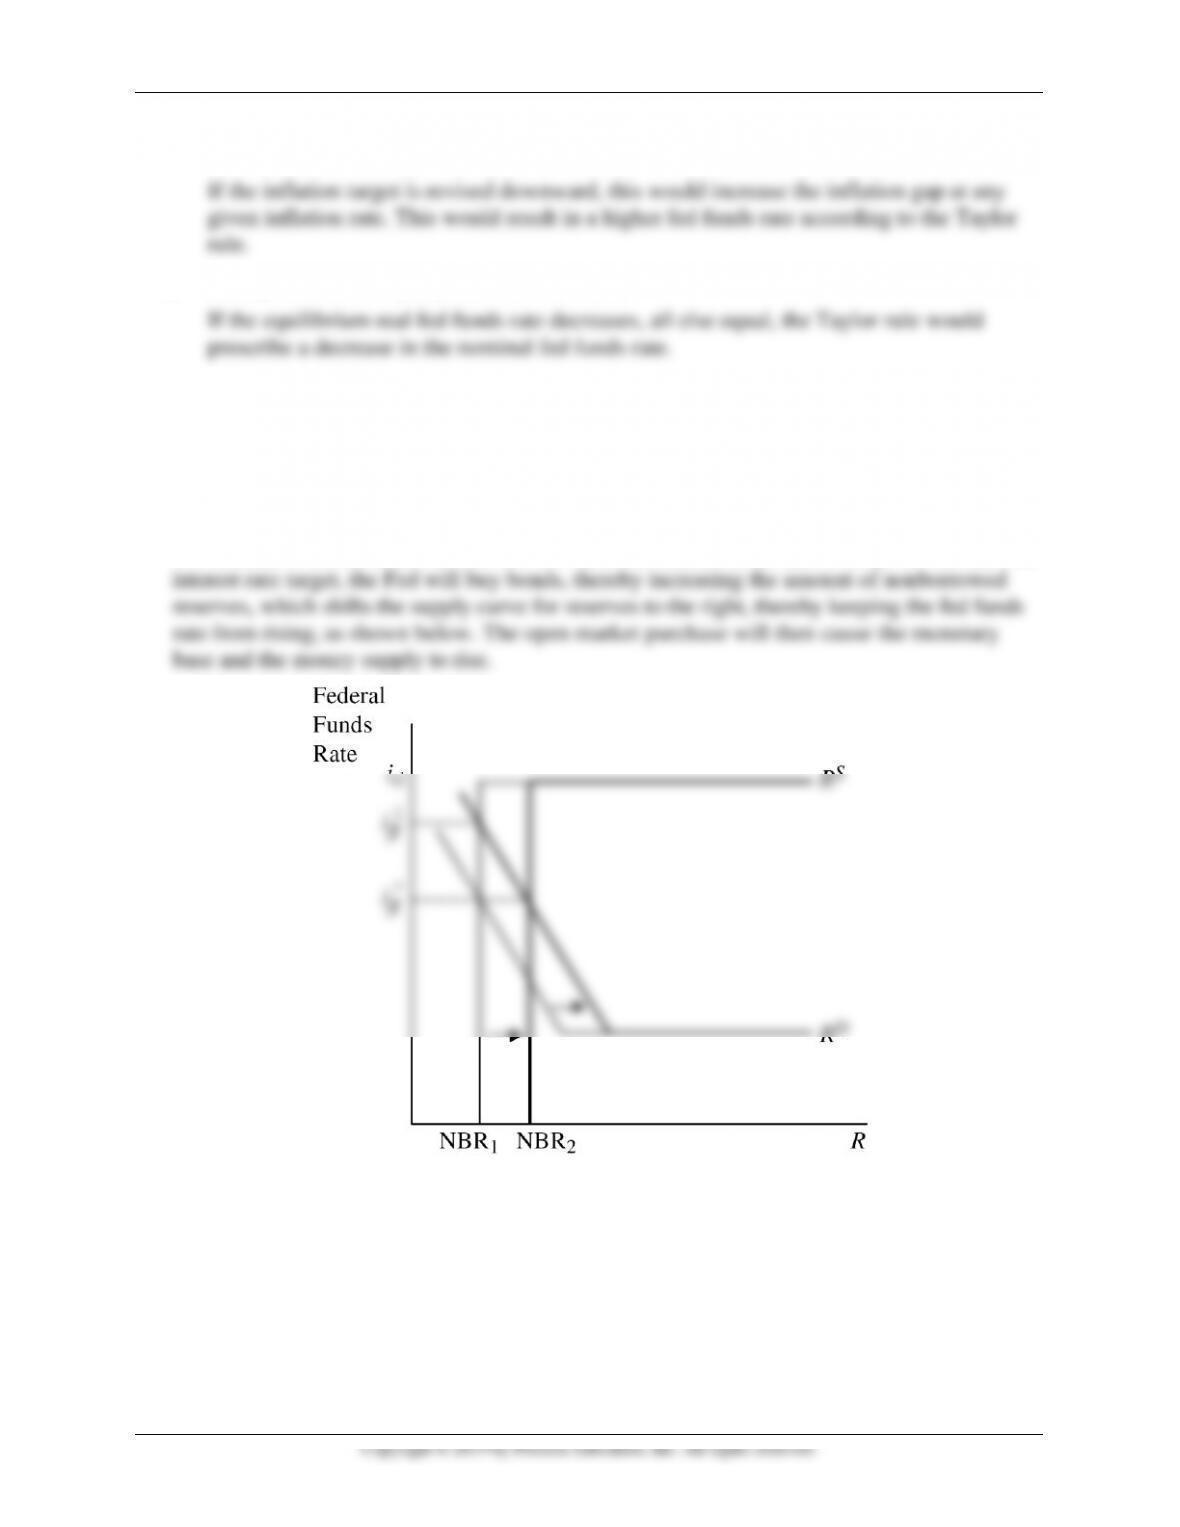
24. If the Fed has an interest-rate target, why will an increase in the demand for reserves lead to a
rise in the money supply? Use a graph of the market for reserves to explain.
An increase in the demand for reserves will raise the federal funds rate. In order to maintain the
Mishkin • Instructor’s Manual for The Economics of Money, Banking, and Financial Markets, Twelfth Edition 186
25. Since monetary policy changes made through the fed funds rate occur with a lag,
policymakers are usually more concerned with adjusting policy according to changes in the
forecasted or expected inflation rate, rather than the current inflation rate. In light of this,
suppose that monetary policymakers employ the Taylor rule to set the fed funds rate, where
the inflation gap is defined as the difference between expected inflation and the target
inflation rate. Assume that the weights on both the inflation and output gaps are ½ the
equilibrium real fed funds rate is 2%, the inflation rate target is 2%, and the output gap is
1%.
a. If the expected inflation rate is 4%, then at what target should the fed funds rate be set
according to the Taylor rule?
b. Suppose half of Fed economists forecast inflation to be 3%, and half of Fed economists
forecast inflation to be 5%. If the Fed uses the average of these two forecasts as its
measure of expected inflation, then at what target should the fed funds rate be set
according to the Taylor rule?
e = 0.5
c. Now suppose half of Fed economists forecast inflation to be 0%, and half forecast
inflation to be 8%. If the Fed uses the average of these two forecasts as its measure of
expected inflation, then at what target should the fed funds rate be set according to the
Taylor rule?
e = 0.5
d. Given your answers to parts (a)–(c) above, do you think it is a good idea for monetary
policymakers to use a strict interpretation of the Taylor rule as a basis for setting policy?
Why or why not?
Probably not. In the situation in part (a), it is assumed that there is very little uncertainty
about what inflation will be, thus a Taylor rule approach to policy may work fine.
Mishkin • Instructor’s Manual for The Economics of Money, Banking, and Financial Markets, Twelfth Edition 187
ANSWERS TO DATA ANALYSIS PROBLEMS
1. The Fed’s maximum employment mandate is generally interpreted as an attempt to achieve
an unemployment rate that is as close as possible to the natural rate and inflation that is
close to its 2% goal for personal consumption expenditure price inflation. Go to the St. Louis
Federal Reserve FRED database and find data on the personal consumption expenditure
price index (PCECTPI), the unemployment rate (UNRATE), and a measure of the natural
rate of unemployment (NROU). For the price index, adjust the units setting to “Percent
Change From Year Ago” to convert the data to the inflation rate; for the unemployment rate,
change the frequency setting to “Quarterly.” Download the data into a spreadsheet.
Calculate the unemployment gap and inflation gap for each quarter. Then, using the inflation
gap, create an average inflation gap measure by taking the average of the current inflation
gap and the gaps for the previous three quarters. Now apply the following (admittedly
arbitrary and ad hoc) test to the data from 2000:Q1 through the most recent data available:
If the unemployment gap is larger than 1.0 for two or more consecutive quarters, and/ or the
average inflation gap is larger in absolute value than 0.5 for two or more consecutive
quarters, consider the mandate “violated.”
a. Based on this ad hoc test, in which quarters has the Fed “violated” the price stability
portion of its mandate? In which quarters has the Fed “violated” the maximum
employment mandate?
See table below. As of 2017:Q1, the Fed violated the price stability mandate according
b. Is the Fed currently “in violation” of its mandate?
c. Interpret your results. What do your response to part (a) and the data imply about the
challenge that monetary policymakers face in achieving the Fed’s mandate perfectly at
all times?
It is clearly very difficult to meet the objectives set forth in the Fed’s mandate, even
under ideal conditions. The Fed “failed” the price stability test 40 out of 69 quarters over
six different occasions. The Fed “failed” the employment test 27 out of 69 quarters; this
Mishkin • Instructor’s Manual for The Economics of Money, Banking, and Financial Markets, Twelfth Edition 188
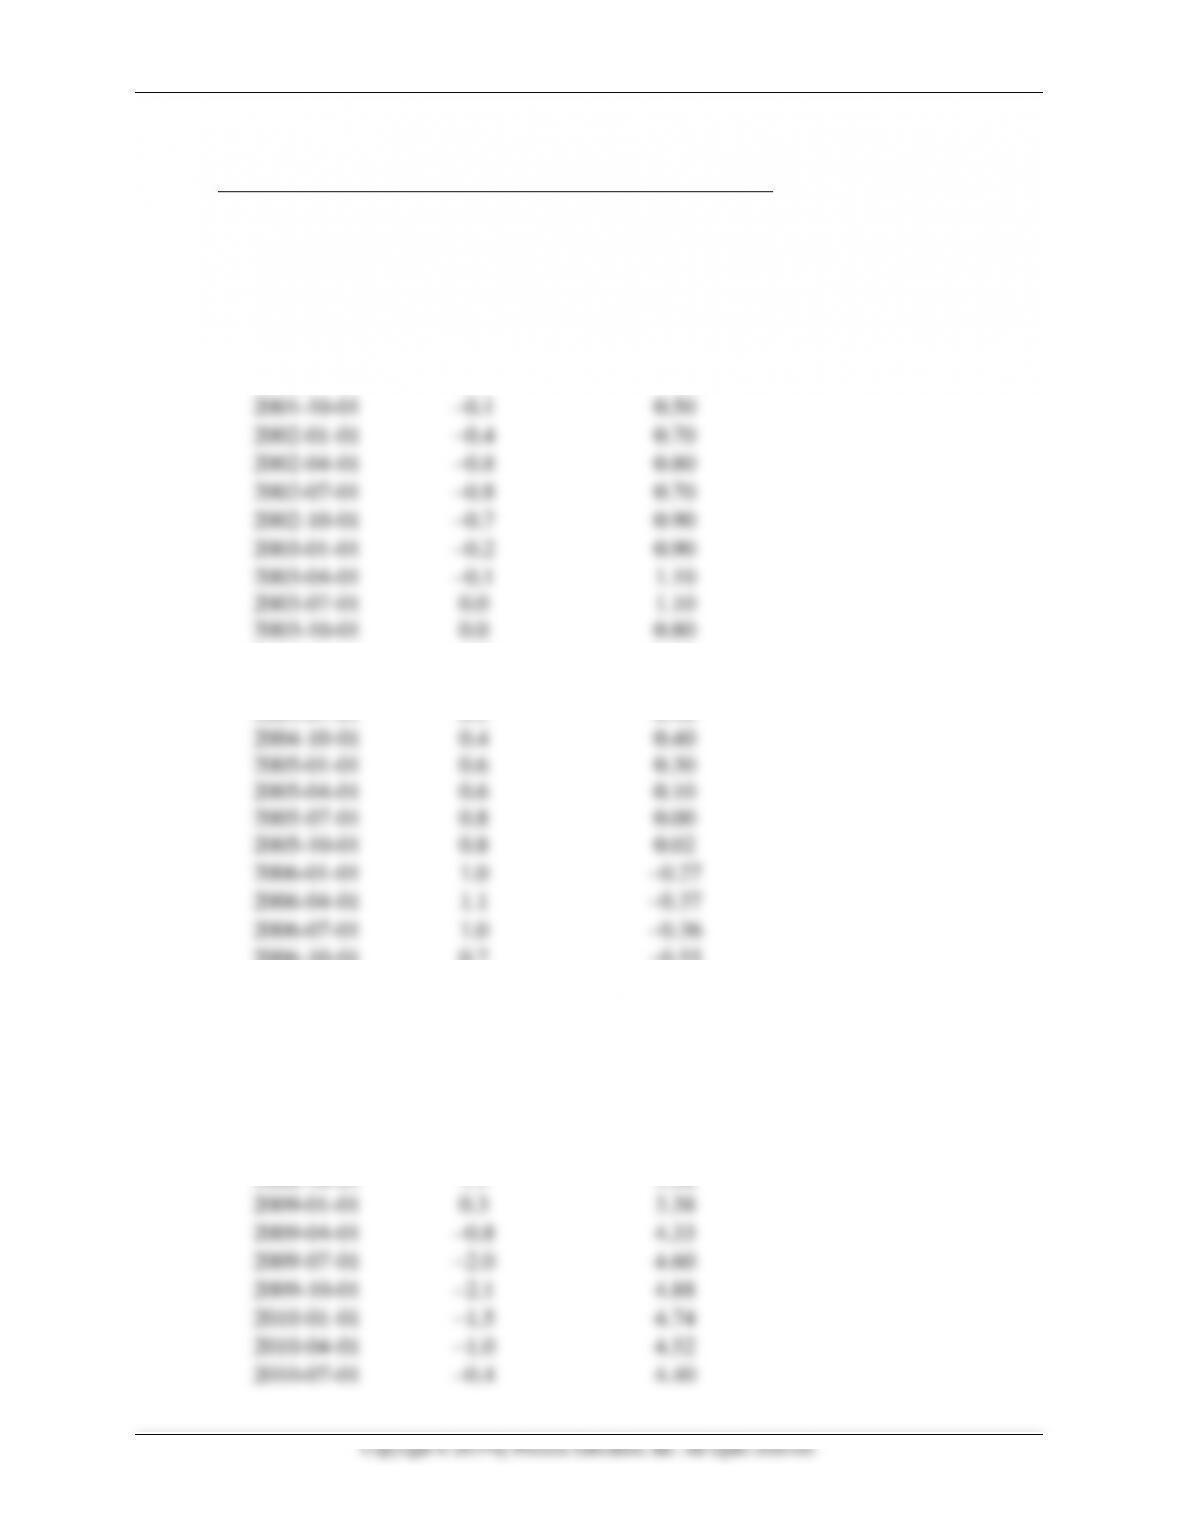
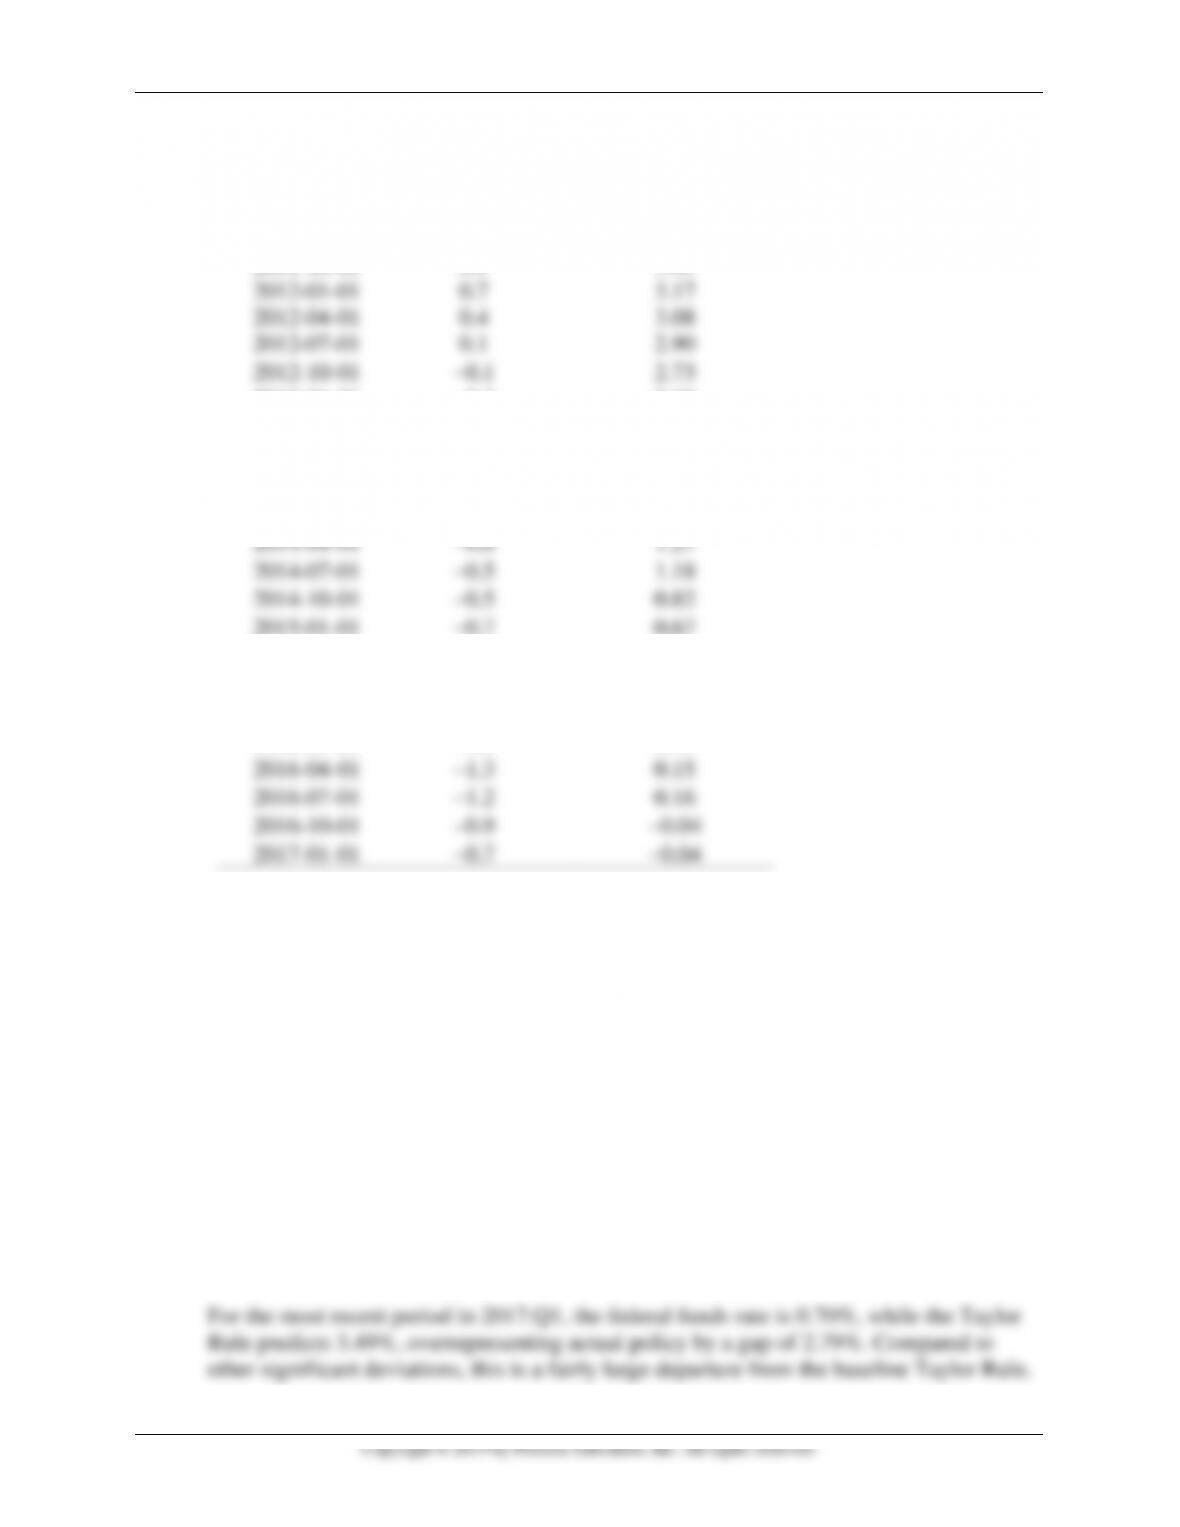
4 Qtr. Average
Inflation Gap
Unemployment
Gap
2000-01-01
−0.2
−1.01
2000-04-01
0.1
−1.11
2000-07-01
0.4
−1.01
2000-10-01
0.5
−1.10
2001-01-01
0.4
−0.80
2001-04-01
0.4
−0.60
2001-07-01
0.2
−0.20
2001-10-01
−0.1
0.50
2002-01-01
−0.4
0.70
2002-04-01
−0.8
0.80
2002-07-01
−0.8
0.70
2002-10-01
−0.7
0.90
2003-01-01
−0.2
0.90
2003-04-01
−0.1
1.10
2003-07-01
0.0
1.10
2003-10-01
0.0
0.80
2004-01-01
−0.2
0.70
2004-04-01
0.0
0.60
2004-07-01
0.2
0.40
2004-10-01
0.4
0.40
2005-01-01
0.6
0.30
2005-04-01
0.6
0.10
2005-07-01
0.8
0.00
2005-10-01
0.8
0.02
2006-01-01
1.0
−0.27
2006-04-01
1.1
−0.37
2006-07-01
1.0
−0.36
2006-10-01
0.7
−0.55
2007-01-01
0.5
−0.45
2007-04-01
0.3
−0.44
2007-07-01
0.1
−0.24
2007-10-01
0.5
−0.13
2008-01-01
0.8
0.07
2008-04-01
1.1
0.37
2008-07-01
1.5
1.08
2008-10-01
1.1
1.98
2009-01-01
0.3
3.38
2009-04-01
−0.8
4.33
2009-07-01
−2.0
4.60
2009-10-01
−2.1
4.88
2010-01-01
−1.5
4.74
2010-04-01
−1.0
4.52
2010-07-01
−0.4
4.40
Mishkin • Instructor’s Manual for The Economics of Money, Banking, and Financial Markets, Twelfth Edition 189
2010-10-01
−0.3
4.39
2011-01-01
−0.4
3.87
2011-04-01
−0.2
3.96
2011-07-01
0.1
3.85
2011-10-01
0.5
3.45
2012-01-01
0.7
3.17
2012-04-01
0.4
3.08
2012-07-01
0.1
2.90
2012-10-01
−0.1
2.73
2013-01-01
−0.3
2.65
2013-04-01
−0.5
2.47
2013-07-01
−0.5
2.30
2013-10-01
−0.7
1.92
2014-01-01
−0.7
1.75
2014-04-01
−0.6
1.27
2014-07-01
−0.5
1.18
2014-10-01
−0.5
0.82
2015-01-01
−0.7
0.67
2015-04-01
−1.1
0.61
2015-07-01
−1.4
0.33
2015-10-01
−1.7
0.24
2016-01-01
−1.5
0.15
2016-04-01
−1.3
0.15
2016-07-01
−1.2
0.16
2016-10-01
−0.9
−0.04
2017-01-01
−0.7
−0.04
2. Go to the St. Louis Federal Reserve FRED database and find data on the personal
consumption expenditure price index (PCECTPI), real GDP (GDPC1), an estimate of
potential GDP (GDPPOT), and the federal funds rate (DFF). For the price index, adjust the
units setting to “Percent Change From Year Ago” to convert the data to the inflation rate;
for the federal funds rate, change the frequency setting to “Quarterly.” Download the data
into a spreadsheet. Assuming the inflation target is 2% and the equilibrium real fed funds
rate is 2%, calculate the inflation gap and the output gap for each quarter, from 2000 until
the most recent quarter of data available. Calculate the output gap as the percentage
deviation of output from the potential level of output.
a. Use the output and inflation gaps to calculate, for each quarter, the fed funds rate
predicted by the Taylor rule. Assume that the weights on inflation stabilization and output
stabilization are both ½ (see the formula in the chapter). Compare the current (quarterly
average) federal funds rate to the federal funds rate prescribed by the Taylor rule. Does
the Taylor rule accurately predict the current rate? Briefly comment.
Mishkin • Instructor’s Manual for The Economics of Money, Banking, and Financial Markets, Twelfth Edition 190
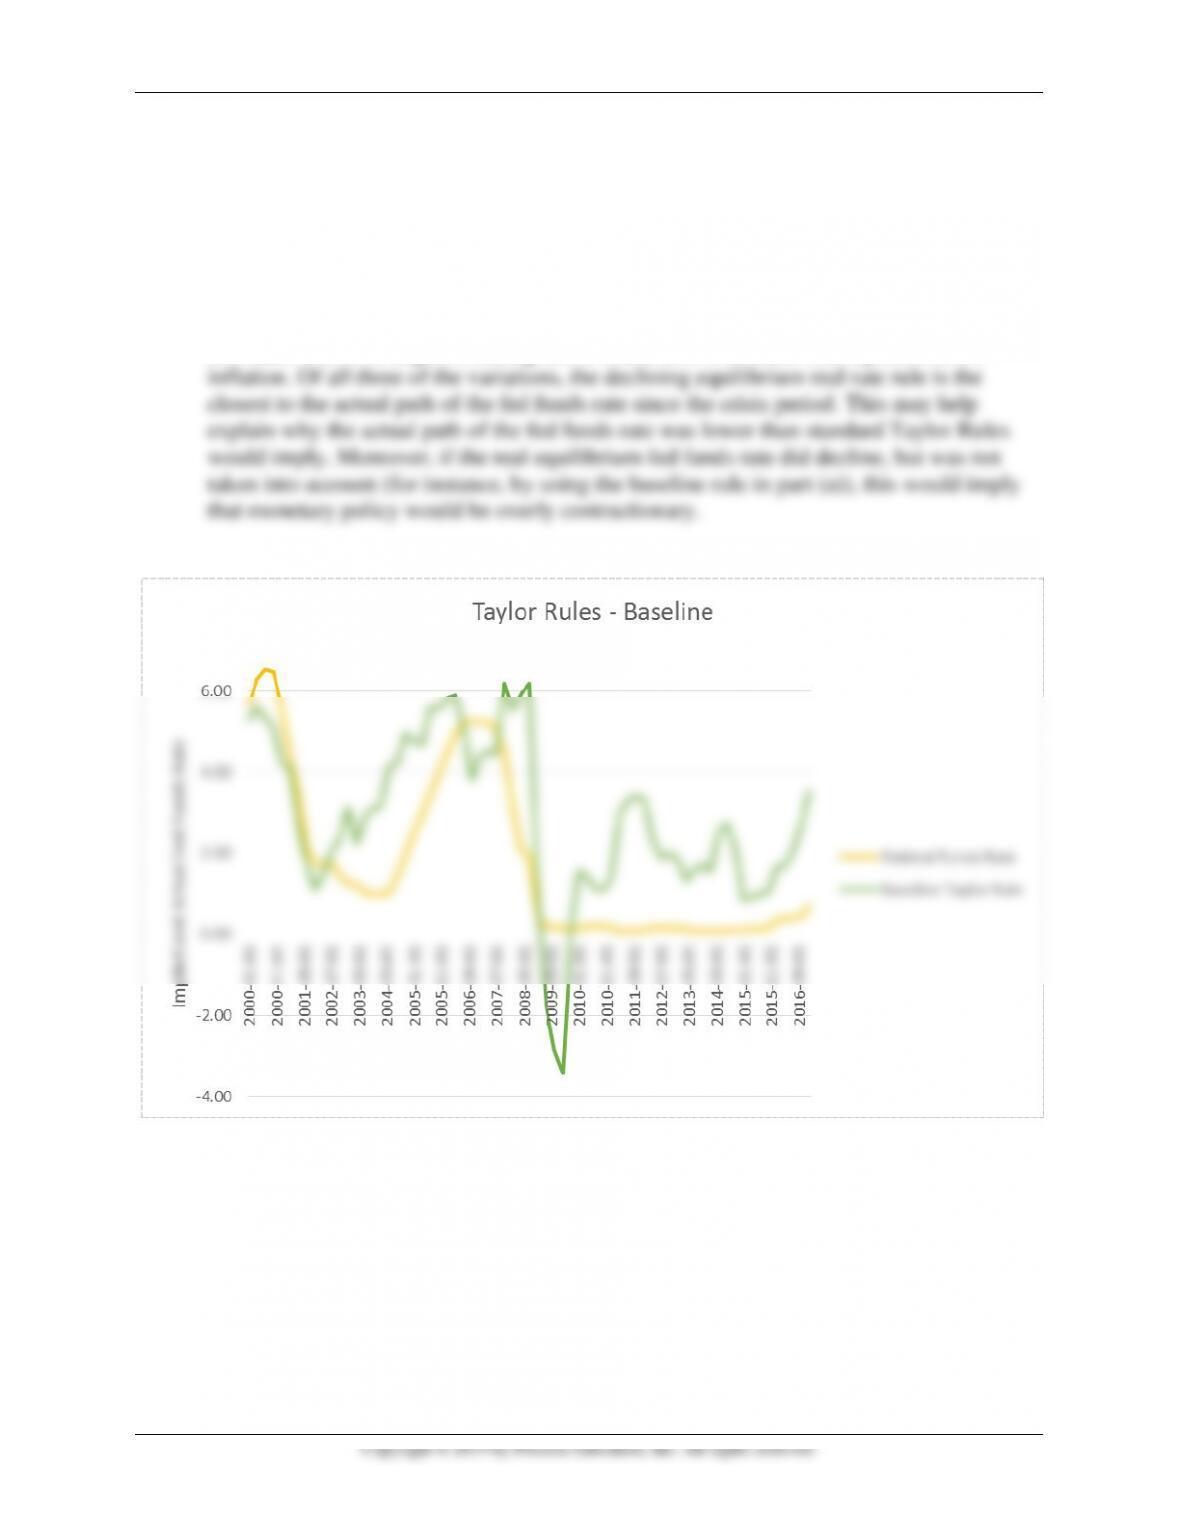
b. Create a graph that compares the predicted Taylor rule values with the actual quarterly
federal funds rate averages. How well, in general, does the Taylor rule prediction fit the
average federal funds rate? Briefly explain.
See graph below. The Taylor rule since 2000 has periods in which they are fairly closely
c. Based on the results from the 2008–2009 period, explain the limitations of the Taylor
rule as a formal policy tool. How do these limitations help explain the use of
nonconventional monetary policy during this period?
Since the Federal funds rate was at the zero lower bound during that time, conventional
monetary policy through adjustments in the federal funds rate was not possible, and
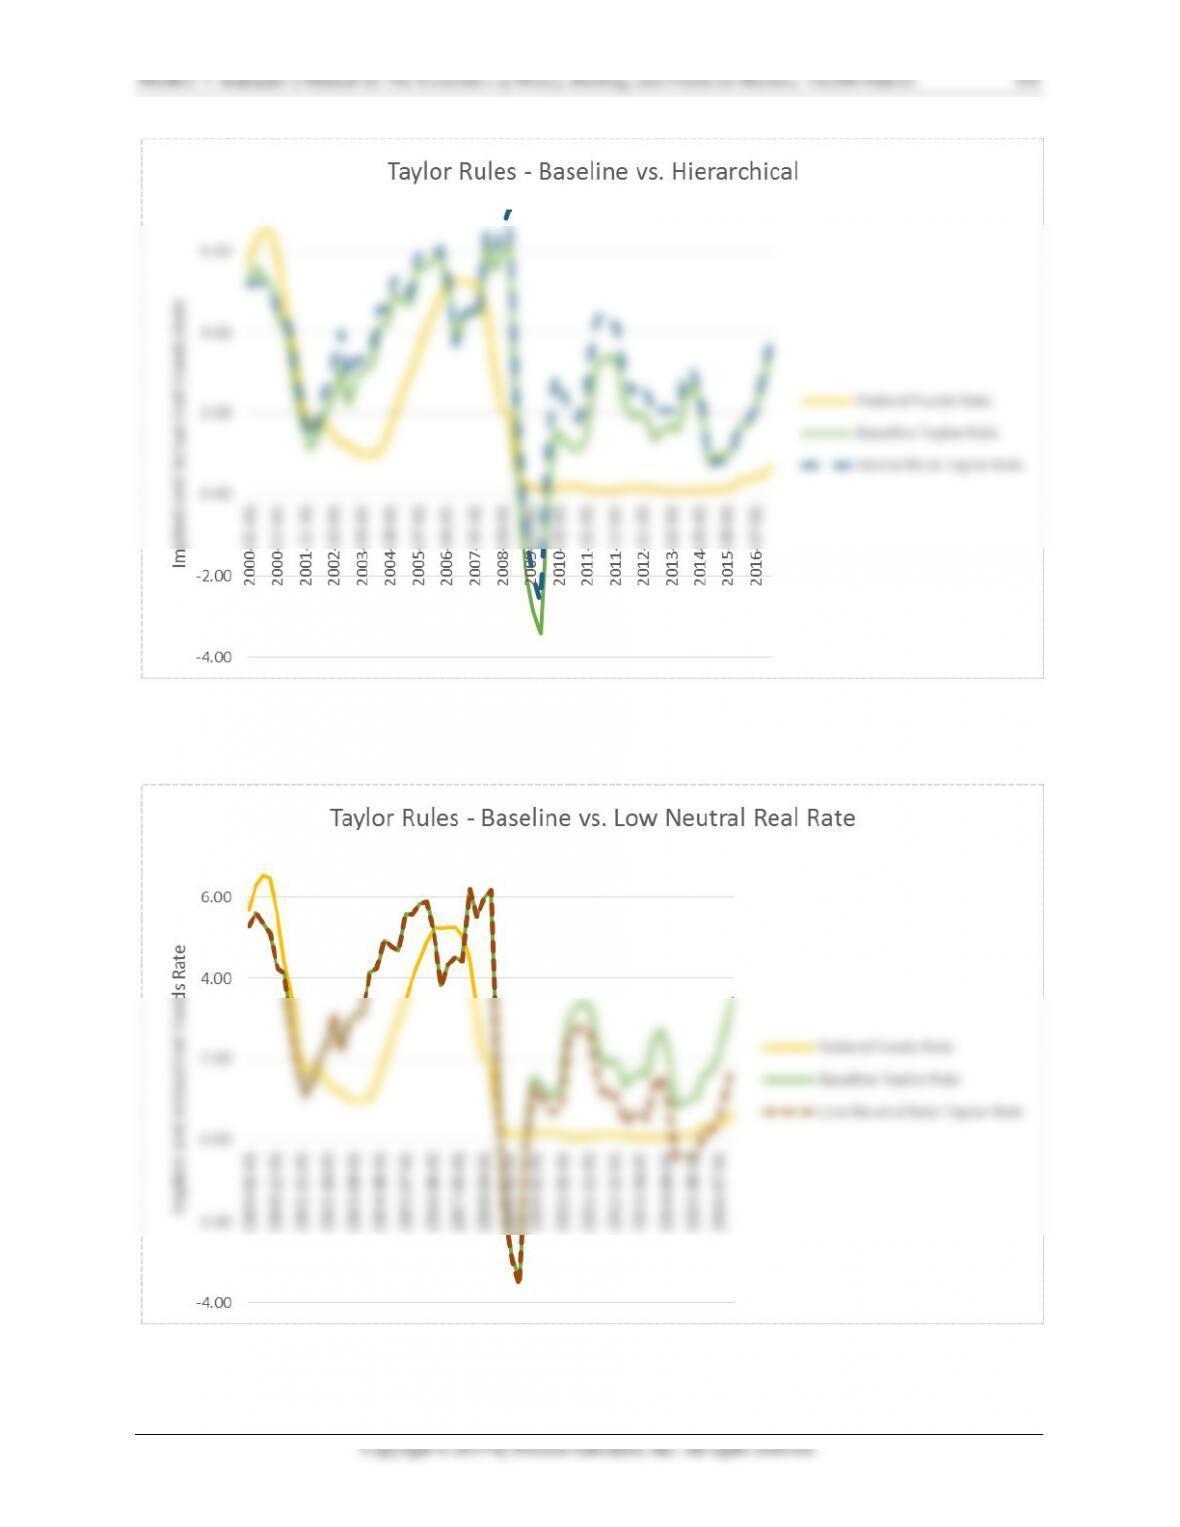
d. Suppose Congress changes the Fed’s mandate to a hierarchical one in which inflation
stabilization takes priority over output stabilization. In this context, recalculate the
predicted Taylor rule value for each quarter since 2000, assuming that the weight on
inflation stabilization is ¾ and the weight on output stabilization is ¼. Create a graph
showing the Taylor rule prediction calculated in part (a), the prediction using new
“hierarchical” Taylor rule, and the fed funds rate. How, if at all, does changing the
mandate change the predicted policy paths? How would the fed funds rate be affected
by a hierarchical mandate? Briefly explain.
See graph below. For the most part, the baseline Taylor rule and the hierarchical Taylor
Mishkin • Instructor’s Manual for The Economics of Money, Banking, and Financial Markets, Twelfth Edition 191
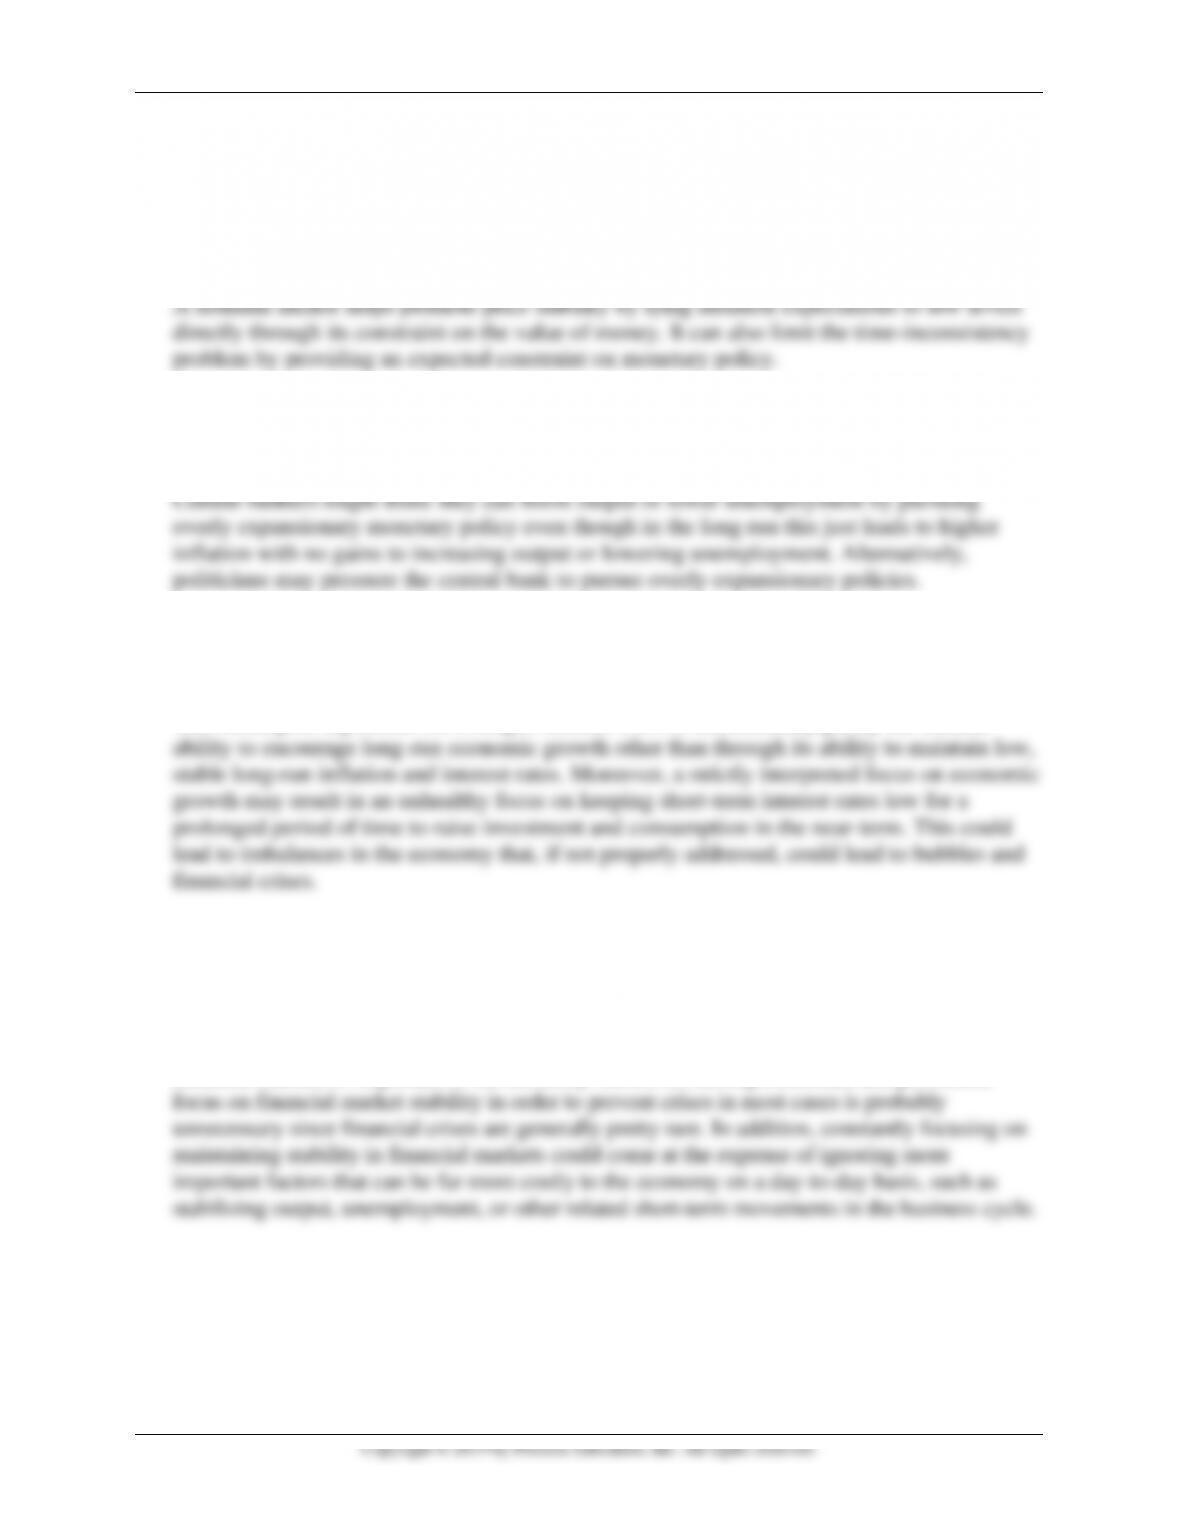
e. Assume again equal weights of ½ on inflation and output stabilization, and suppose
instead that beginning after the end of 2008, the equilibrium real fed funds rate declines
by 0.05 each quarter (i.e. 2009:Q1 is 1.95, then 1.90, etc.), and once it reaches zero, it
remains at zero thereafter. How does it affect the prescribed fed funds rate? Why might
this be important for policymakers to take into consideration?
A decline in the equilibrium real fed funds rate has the effect of reducing the implied
Taylor rule fed funds rate lower. In fact, under this policy rule, it would have implied the
fed funds rate to be negative during 2015, which also coincided with a period of low