
Mishkin • Instructor’s Manual for The Economics of Money, Banking, and Financial Markets, Twelfth Edition 143
Chapter 12
ANSWERS TO QUESTIONS
1. How does the concept of asymmetric information help to define a financial crisis?
Asymmetric information problems (adverse selection and moral hazard) are always present
2. How can the bursting of an asset-price bubble in the stock market help trigger a financial
crisis?
3. How does an unanticipated decline in the price level cause a drop in lending?
4. Define “financial frictions” in your own terms and explain why an increase in financial
frictions is a key element in financial crises.


Mishkin • Instructor’s Manual for The Economics of Money, Banking, and Financial Markets, Twelfth Edition 145
9. Describe the process of “securitization” in your own words. Was this process solely
responsible for the Great Recession financial crisis of 2007–2009?
The process of securitization converts a series of financial instruments (i.e. loans) into
10. Provide one argument in favor of and one against the idea that the Fed was responsible for
the housing price bubble of the mid 2000s.
11. What role does weak financial regulation and supervision play in causing financial crises?
12. Describe two similarities and two differences between the United States’ experiences during
the Great Depression and the Great Recession financial crisis of 2007–2009.

Mishkin • Instructor’s Manual for The Economics of Money, Banking, and Financial Markets, Twelfth Edition 146
Copyright © 2019 by Pearson Education, Inc. All rights reserved.
both episodes resulted in significant declines in GDP and increases in unemployment, this
was much more pronounced during the Great Depression, when unemployment peaked at
25% (as opposed to the recent crisis, in which the unemployment rate reached 10.2%). In
part, this is the result of Federal Reserve policymakers trying much more aggressively to
contain the financial crisis and reverse the decline in economic activity during the Great
Recession than was true during the Great Depression.
13. What do you think prevented the financial crisis of 2007–2009 from becoming a depression?
14. What technological innovations led to the development of the subprime mortgage market?
15. Why is the originate-to-distribute business model subject to the principal–agent problem?
16. True, false, or uncertain: Deposit insurance always and everywhere prevents financial
crises.

Mishkin • Instructor’s Manual for The Economics of Money, Banking, and Financial Markets, Twelfth Edition 147
17. How did a decline in housing prices help trigger the subprime financial crisis that began in
2007?
18. What role did the shadow banking system play in the 2007–2009 financial crisis?
19. Why would haircuts on collateral increase sharply during a financial crisis? How would this
lead to fire sales on assets?
20. How did the global financial crisis promote a sovereign debt crisis in Europe?
21. Why is it a good idea for macroprudential policies to require countercyclical capital
requirements?

Mishkin • Instructor’s Manual for The Economics of Money, Banking, and Financial Markets, Twelfth Edition 148
Copyright © 2019 by Pearson Education, Inc. All rights reserved.
and help to mitigate credit bubbles that can be damaging later on. Likewise, when the economy
goes into a downturn, capital requirements could be lowered, which would encourage more
lending and facilitate faster economic growth.
22. How does the process of financial innovation impact the effectiveness of macroprudential
regulation?
23. What are the three approaches to limiting the too-big-to-fail problem? Briefly describe the
advantages and disadvantages of each of the approaches.
forbearance, thereby increasing the cost of the S&L bailout.
24. Why were consumer protection provisions included in the Dodd-Frank bill, a bill designed to
strengthen the financial system? What are some of the problems with these regulations?

Mishkin • Instructor’s Manual for The Economics of Money, Banking, and Financial Markets, Twelfth Edition 149
25. Why is it important for the U.S. government to have resolution authority?
Prior to 2009, the U.S. government had no legal authority to seize the largest failing financial
ANSWERS TO DATA ANALYSIS PROBLEMS
1. Go to the St. Louis Federal Reserve FRED database and find data on house prices
(SPCS20RSA), stock prices (SP500), a measure of the net wealth of households
(TNWBSHNO), and personal consumption expenditures (PCEC). For all four measures, be
sure to convert the frequency setting to “Quarterly.” Download the data into a spreadsheet,
and make sure the data align correctly with the appropriate dates. For all four series, for
each quarter, calculate the annualized growth rate from quarter to quarter. To do this, take
the current-period data minus the previous-quarter data, and then divide by the previous
quarter data. Multiply by 100 to change each result to a percent, and multiply by 4 to
annualize the data.
a. For the four series, calculate the average growth rates over the most recent four quarters
of data available. Comment on the relationships among house prices, stock prices, net
wealth of households, and consumption as they relate to your results.
b. Repeat part (a) for the four quarters of 2005, and again for the period from 2008:Q3 to
2009:Q2. Comment on the relationships among house prices, stock prices, net wealth of
households, and consumption as they relate to your results, before and during the crisis.

Mishkin • Instructor’s Manual for The Economics of Money, Banking, and Financial Markets, Twelfth Edition 150
c. How do the current household data compare to the data from the period prior to the
financial crisis, and during the crisis? Do you think the current data are indicative of a
bubble?
period.
NASDAQ
Stock Price
Growth
Case-Shiller
Home Price
Growth
Household
Net Worth
Consumption
Growth
2016:Q2 to
2017:Q1
22.4
5.7
8.1
4.9
2008:Q3 to
2009:Q2
−26.2
−18.0
−11.2
−3.2
2005:Q1 to
2005:Q4
6.3
14.7
10.5
6.1
2. Go to the St. Louis Federal Reserve FRED database and find data on corporate net worth of
nonfinancial businesses (TNWMVBSNNCB), private domestic investment (GPDIC1), and a
measure of financial frictions, the St. Louis Fed financial stress index (STLFSI). For all three
measures, be sure to convert the frequency setting to “Quarterly.” Download the data into a
spreadsheet, and make sure the data align correctly with the appropriate dates. For
corporate net worth and private domestic investment, calculate the annualized growth rates
from quarter to quarter. To do this, take the current-period data minus the previous-quarter
data, then divide by the previous quarter data. Multiply by 100 to change the results to
percentage form, and then multiply by 4 to annualize the data.
a. Calculate the average growth rates over the most recent four quarters of data available
for the corporate net worth and private domestic investment variables. Calculate the
difference between the value of the stress index during the most recent quarter and the
value of the stress index one year earlier. Comment on the relationships among financial
stress, net wealth of corporate businesses, and private domestic investment.
b. Repeat part (a) for the four quarters of 2005 and for the period from 2008:Q3 to
2009:Q2. Comment on the relationships among financial stress, net wealth of corporate
businesses, and private domestic investment before and during the crisis as they relate to
your results. Assuming the financial stress measure is indicative of heightened
asymmetric information problems, comment on how the crisis-period data relate to the
typical dynamics of a financial crisis.
Mishkin • Instructor’s Manual for The Economics of Money, Banking, and Financial Markets, Twelfth Edition 151
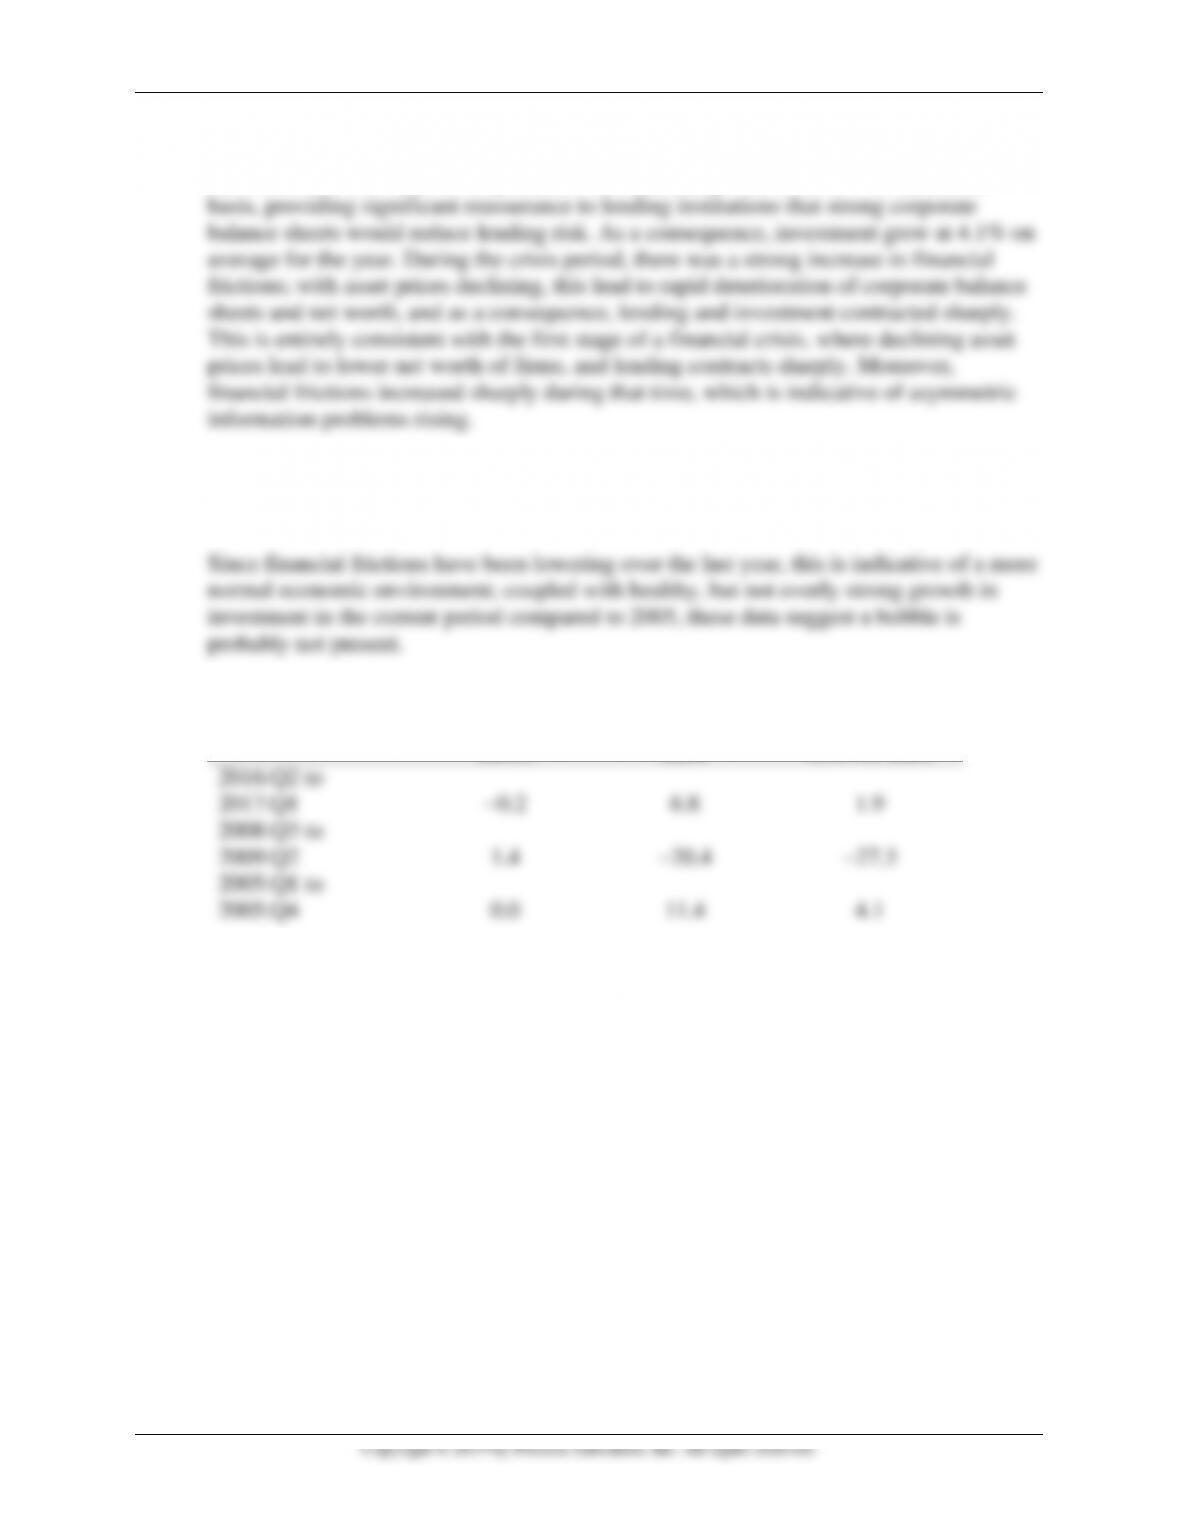
See table below. During the pre-crisis period in 2005, financial frictions were essentially
flat. However, net worth of corporations was increasing well over 10% on an annual
c. How do the current investment data compare to the data for the period prior to the
financial crisis, and during the crisis? Do you think the current data are indicative of a
bubble?
Average
Change, Stress
Index
Corporate Net
Worth Growth
Rate
Investment
Growth Rate
2016:Q2 to
2017:Q1
−0.2
6.8
1.9
2008:Q3 to
2009:Q2
1.4
−20.4
−27.3
2005:Q1 to
2005:Q4
0.0
11.4
4.1