308 Brooks ◼ Financial Management: Core Concepts, 4e
© 2018 Pearson Education, Inc.
Project X’s PV Benefits = $245,901.64 + $335,931.20 + $385,494.82 + $406,259.18
+ $406,999.18 = $1,780,586.02
Project X’s PV Cost = $1,750,000
Project X’s PI = $1,780,586.02 / $1,750,000 = 1.0175 and accept project.
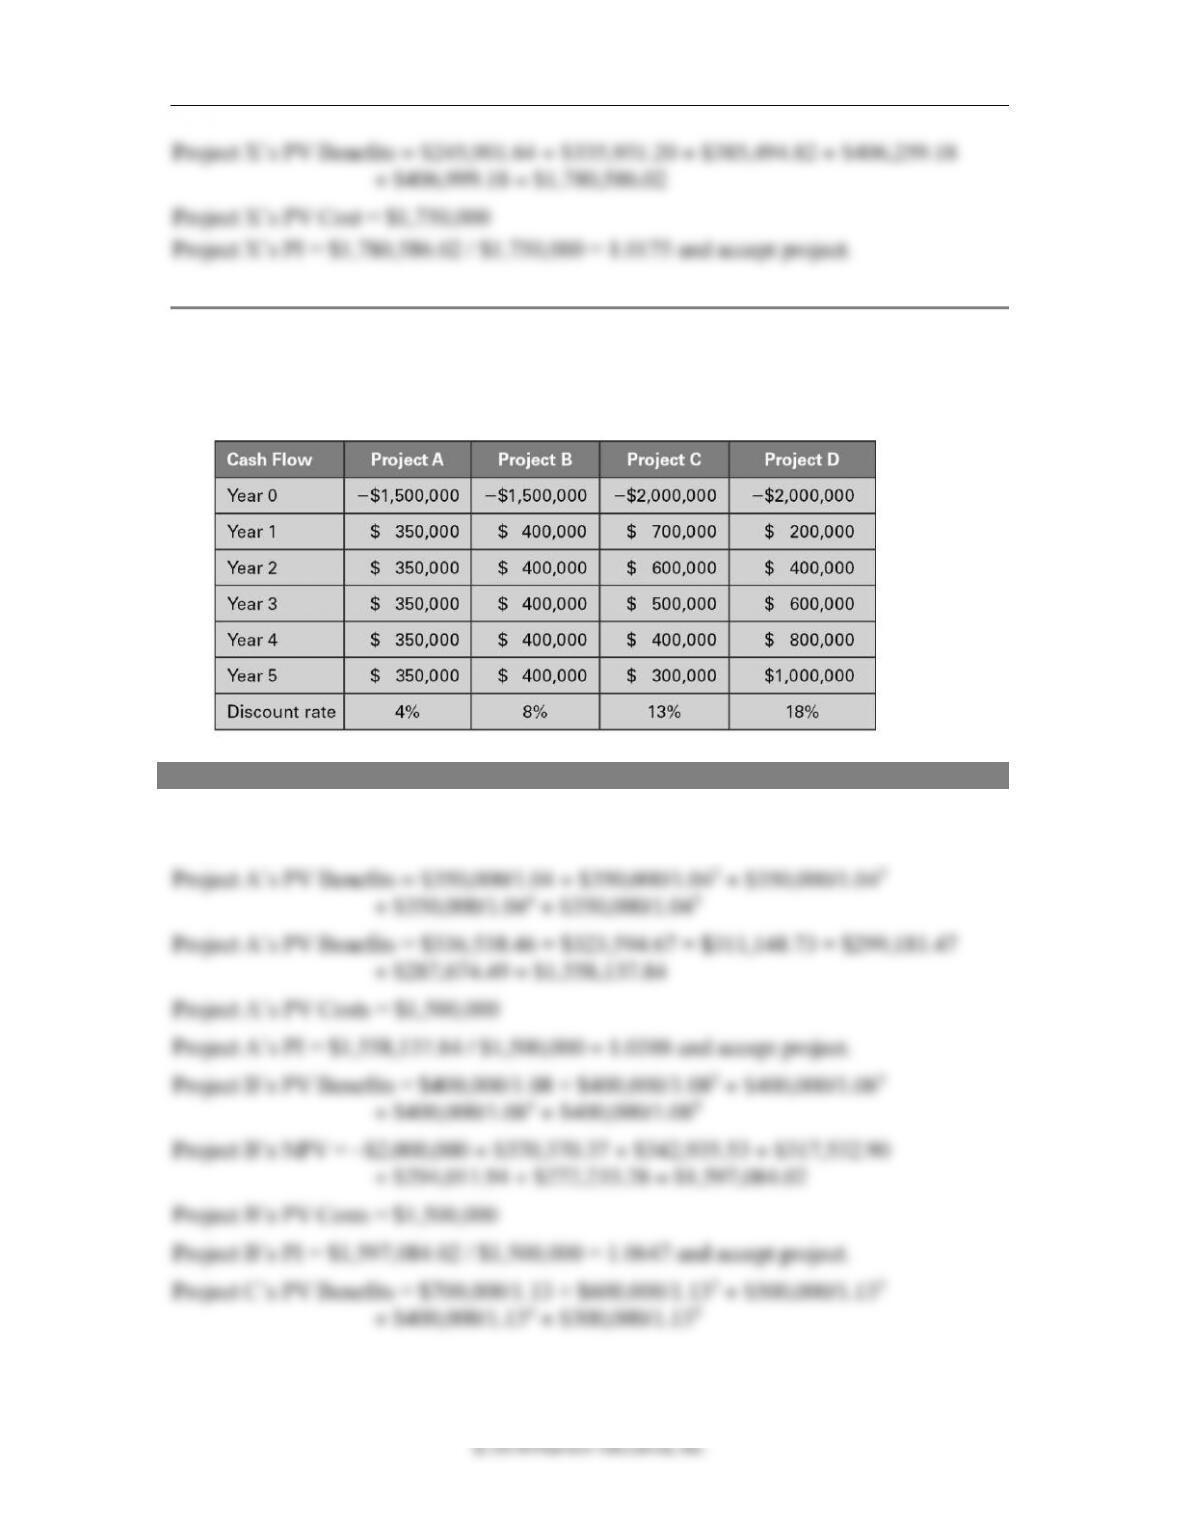
20. Profitability index. Given the discount rates and the future cash flow of each project
listed in the following table, use the PI to determine which projects the company
should accept.
ANSWER
Find the present value of benefits and divide by the present value of the costs for each
project.
Chapter 9 ◼ Capital Budgeting Decision Models 309
© 2018 Pearson Education, Inc.
Project C’s PV Benefits = $619,469.03 + $469,888.01 + $346,525.08 + $245,327.49
+ $162,827.98 = $1,844,037.59
Project C’s PV Costs = $2,000,000
Project C’s PI = $1,844,037.59 / $2,000,000 = 0.9220 and reject project.
Project D’s PV Benefits = $200,000/1.18 + $400,000/1.182 + $600,000/1.183
+ $800,000/1.184 + $1,000,000/1.185
Project D’s PV Benefits = $169,491.53 + $287,273.77 + $365,178.52 + $412,631.10
+ $437,109.22 = $1,671,684.14
Project D’s PV Costs = $2,000,000
Project D’s PI = $1,671,684.14 / $2,000,000 = 0.8358 and reject project.
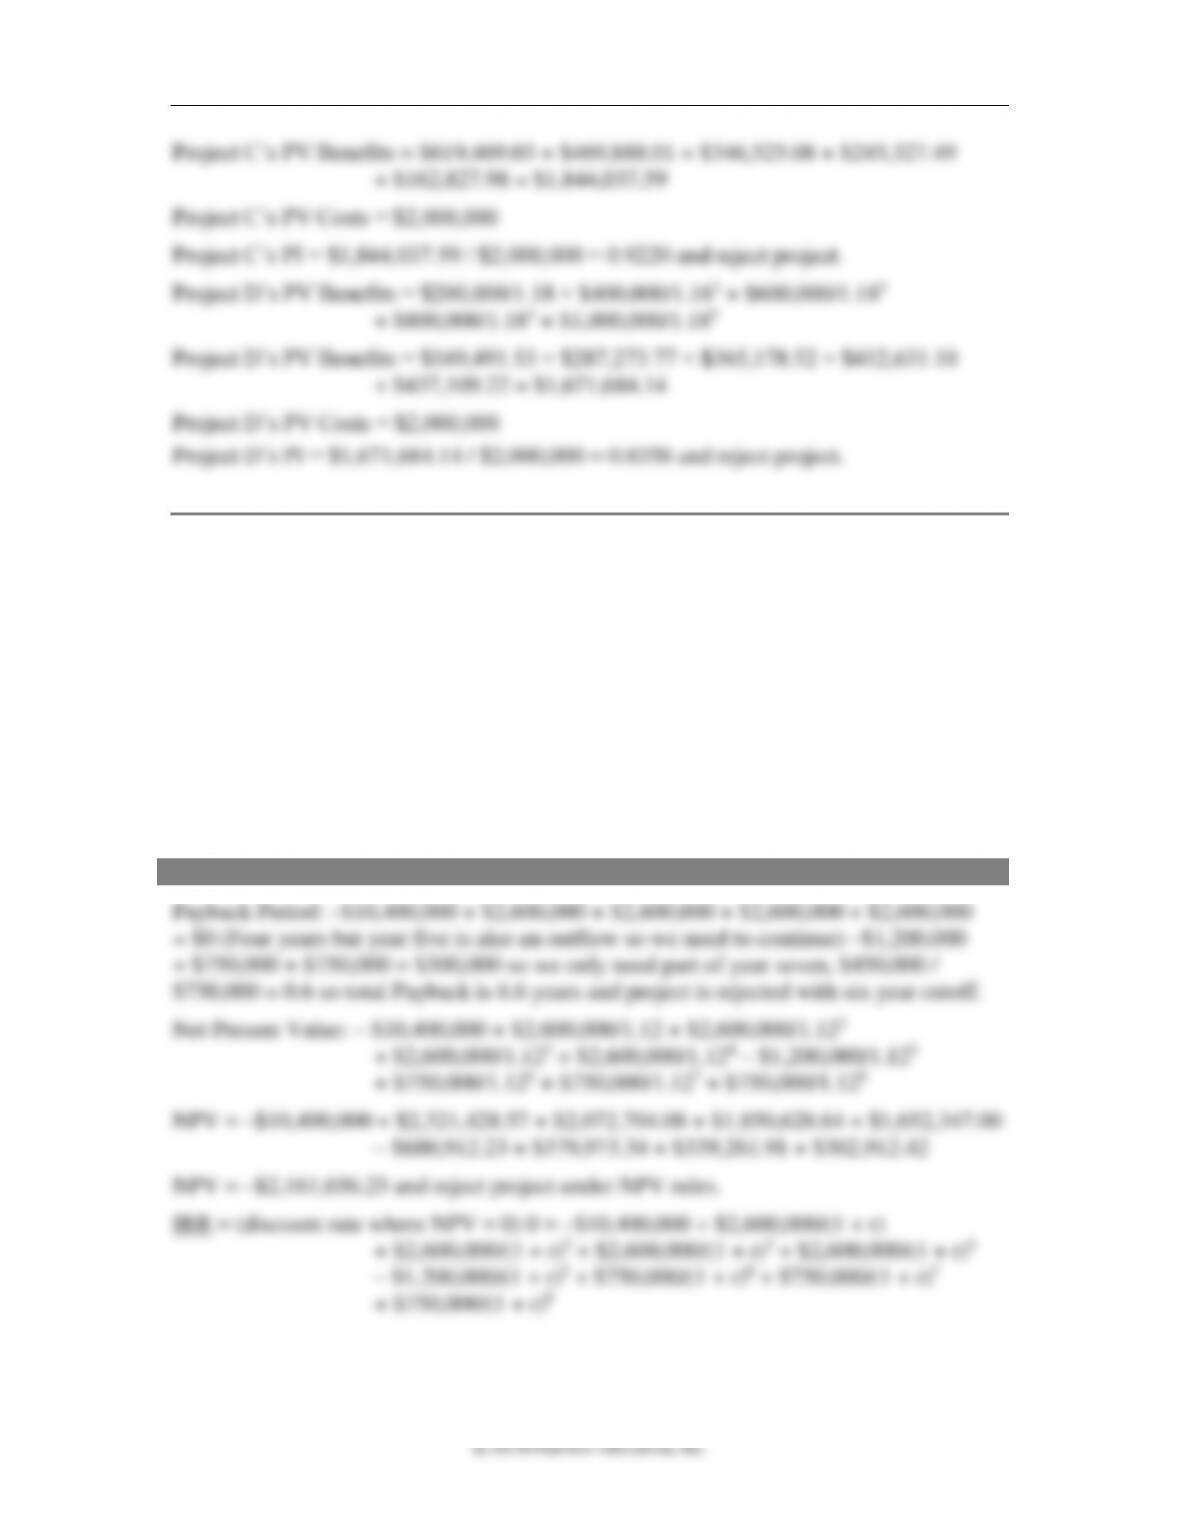
21. Comparing all methods. Given the following after-tax cash flows on a new toy for
Tyler’s Toys, find the project’s payback period, NPV, and IRR. The appropriate
discount rate for the project is 12%. If the cutoff period is six years for major projects,
determine whether management will accept or reject the project under the three
different decision models.
Initial cash outflow: $10,400,000
Years one through four cash inflow: $2,600,000 each year
Year five cash outflow: $1,200,000
Years six through eight cash inflow: $750,000 each year
ANSWER
310 Brooks ◼ Financial Management: Core Concepts, 4e
© 2018 Pearson Education, Inc.
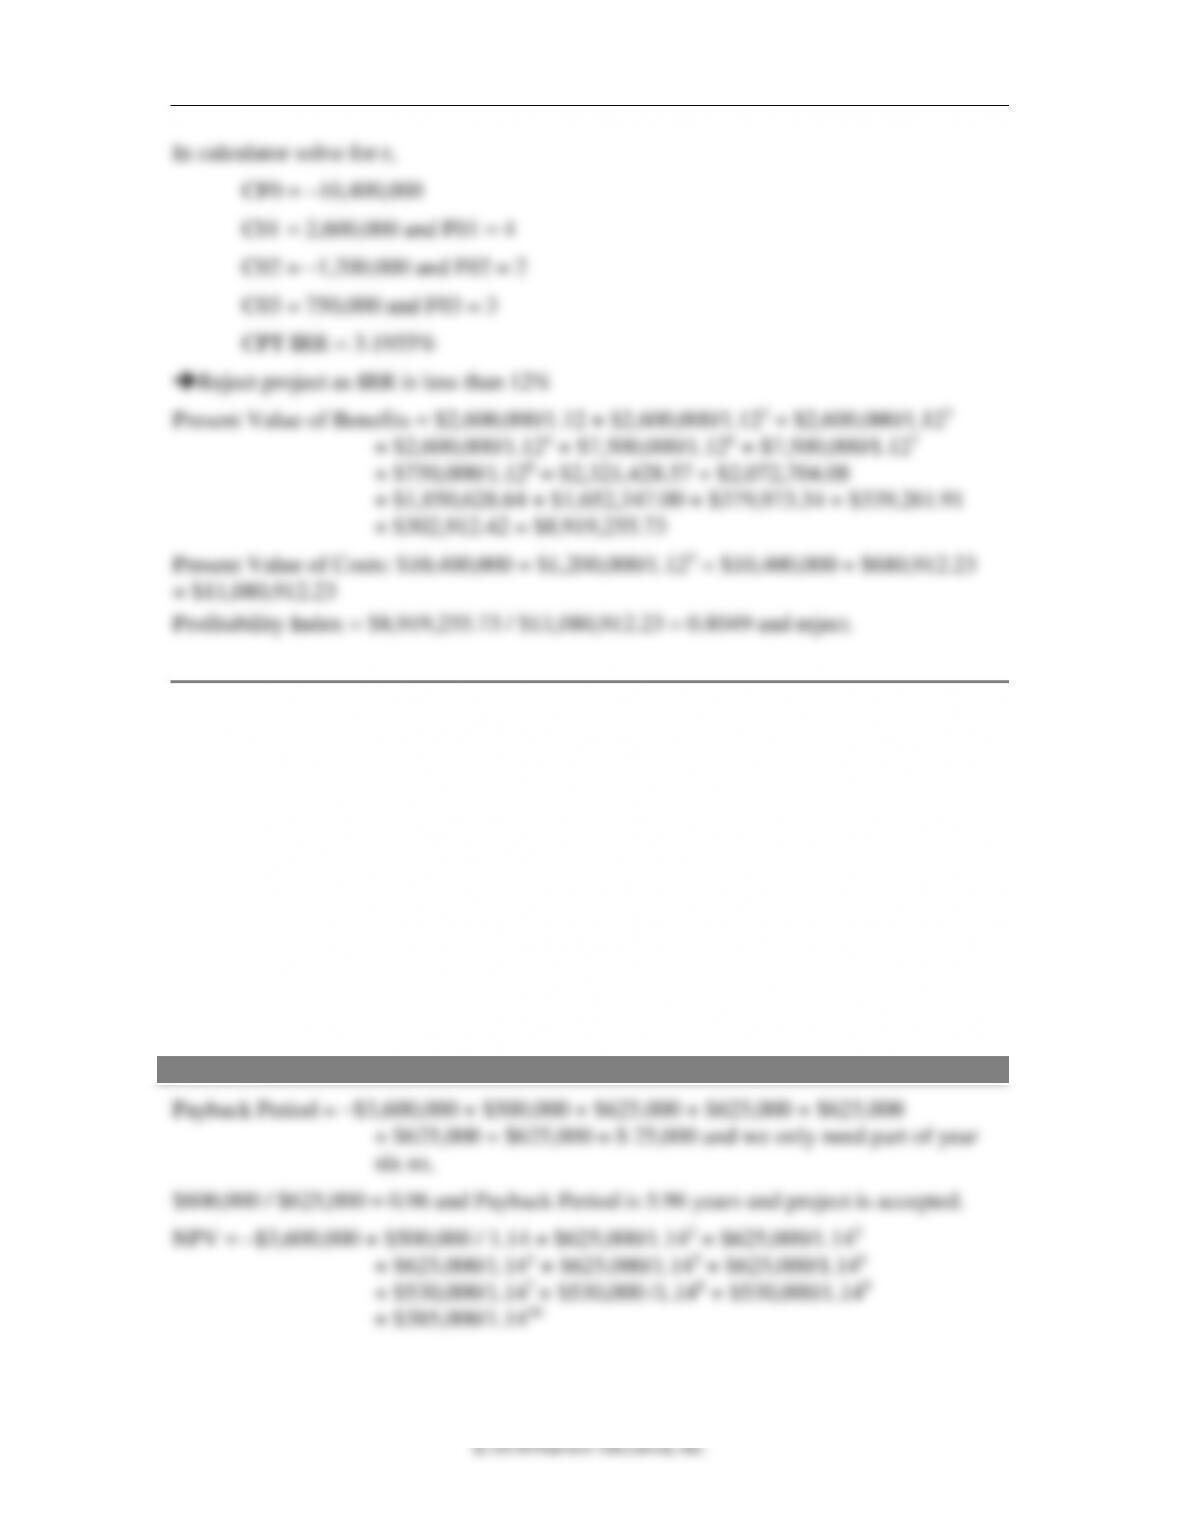
In calculator solve for r,
CF0 = –10,400,000
C01 = 2,600,000 and F01 = 4
C02 = –1,200,000 and F02 = 2
C03 = 750,000 and F03 = 3
CPT IRR = 3.1955%
➔Reject project as IRR is less than 12%
Present Value of Benefits = $2,600,000/1.12 + $2,600,000/1.122 + $2,600,000/1.123
+ $2,600,000/1.124 + $7,500,000/1.126 + $7,500,000/1.127
+ $750,000/1.128 = $2,321,428.57 + $2,072,704.08
+ $1,850,628.64 + $1,652,347.00 + $379,973.34 + $339,261.91
+ $302,912.42 = $8,919,255.73
Present Value of Costs: $10,400,000 + $1,200,000/1.125 = $10,400,000 + $680,912.23
= $11,080,912.23
Profitability Index = $8,919,255.73 / $11,080,912.23 = 0.8049 and reject.
22. Comparing all methods. Risky Business is looking at a project with the estimated
cash flows as follows:
Initial Investment at start of project: $3,600,000
Cash Flow at end of year one: $500,000
Cash Flow at end of years two through six: $625,000 each year
Cash Flow at end of years seven through nine: $530,000 each year
Cash Flow at end of year ten: $385,000
Risky Business wants to know payback period, NPV, IRR, MIRR, and PI of this
project. The appropriate discount rate for the project is 14%. If the cutoff period is six
years for major projects, determine whether management at Risky Business will
accept or reject the project under the five different decision models.
ANSWER
Chapter 9 ◼ Capital Budgeting Decision Models 311
© 2018 Pearson Education, Inc.
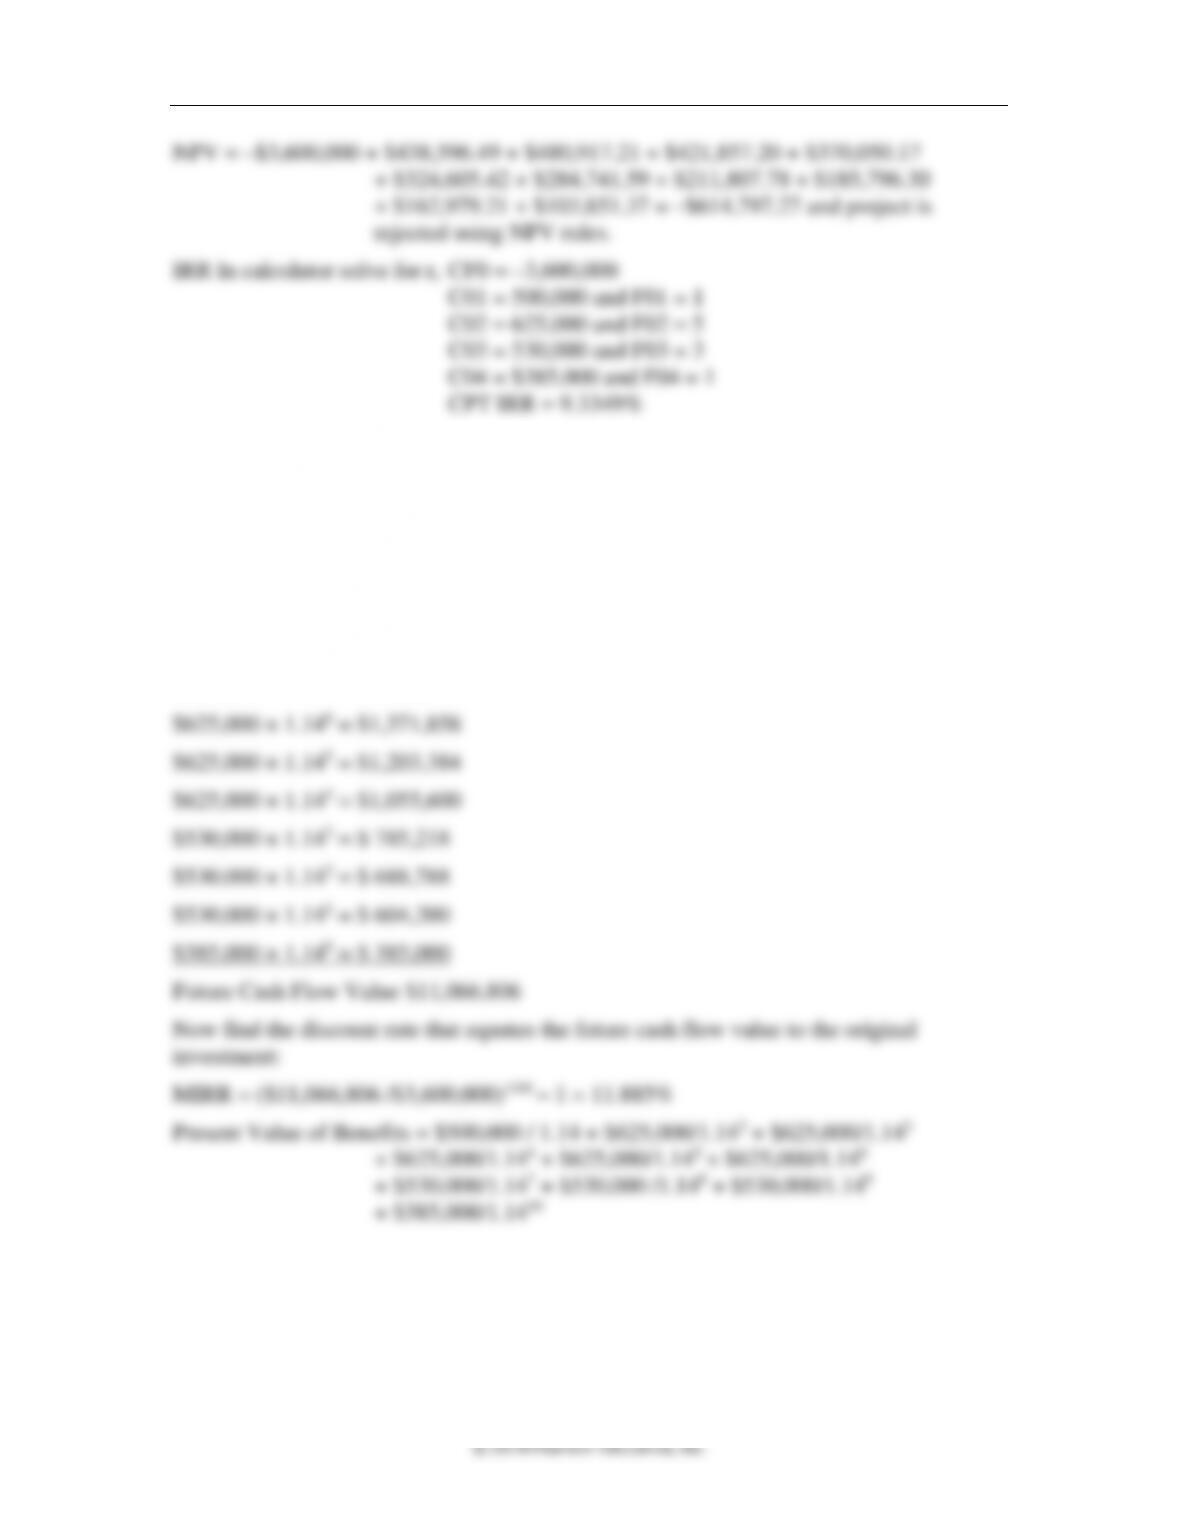
NPV = –$3,600,000 + $438,596.49 + $480,917.21 + $421,857.20 + $370,050.17
+ $324,605.42 + $284,741.59 + $211,807.78 + $185,796.30
+ $162,979.21 + $103,851.37 = –$614,797.27 and project is
rejected using NPV rules.
IRR In calculator solve for r, CF0 = –3,600,000
C01 = 500,000 and F01 = 1
C02 = 625,000 and F02 = 5
C03 = 530,000 and F03 = 3
C04 = $385,000 and F04 = 1
CPT IRR = 9.3349%
➔Reject project as IRR is less than 14%
MIRR solution with the 14% cost of capital as the investment rate for the annual cash
flows.
Take all positive cash flows to year ten and find the future value of the cash flow at the
end of year ten.
$500,000 × 1.149 = $1,625,974
$625,000 × 1.148 = $1,782,866
$625,000 × 1.147 = $1,563,918

312 Brooks ◼ Financial Management: Core Concepts, 4e
© 2018 Pearson Education, Inc.
Present Value of Benefits = $438,596.49 + $480,917.21 + $421,857.20 + $370,050.17
+ $324,605.42 + $284,741.59 + $211,807.78 + $185,796.30
+ $162,979.21 + $103,851.37 = $2,985,202.73
Present Value of Costs: $3,600,000
Profitability Index = $2,985,202.73 / $3,600,000 = 0.8292 and reject.
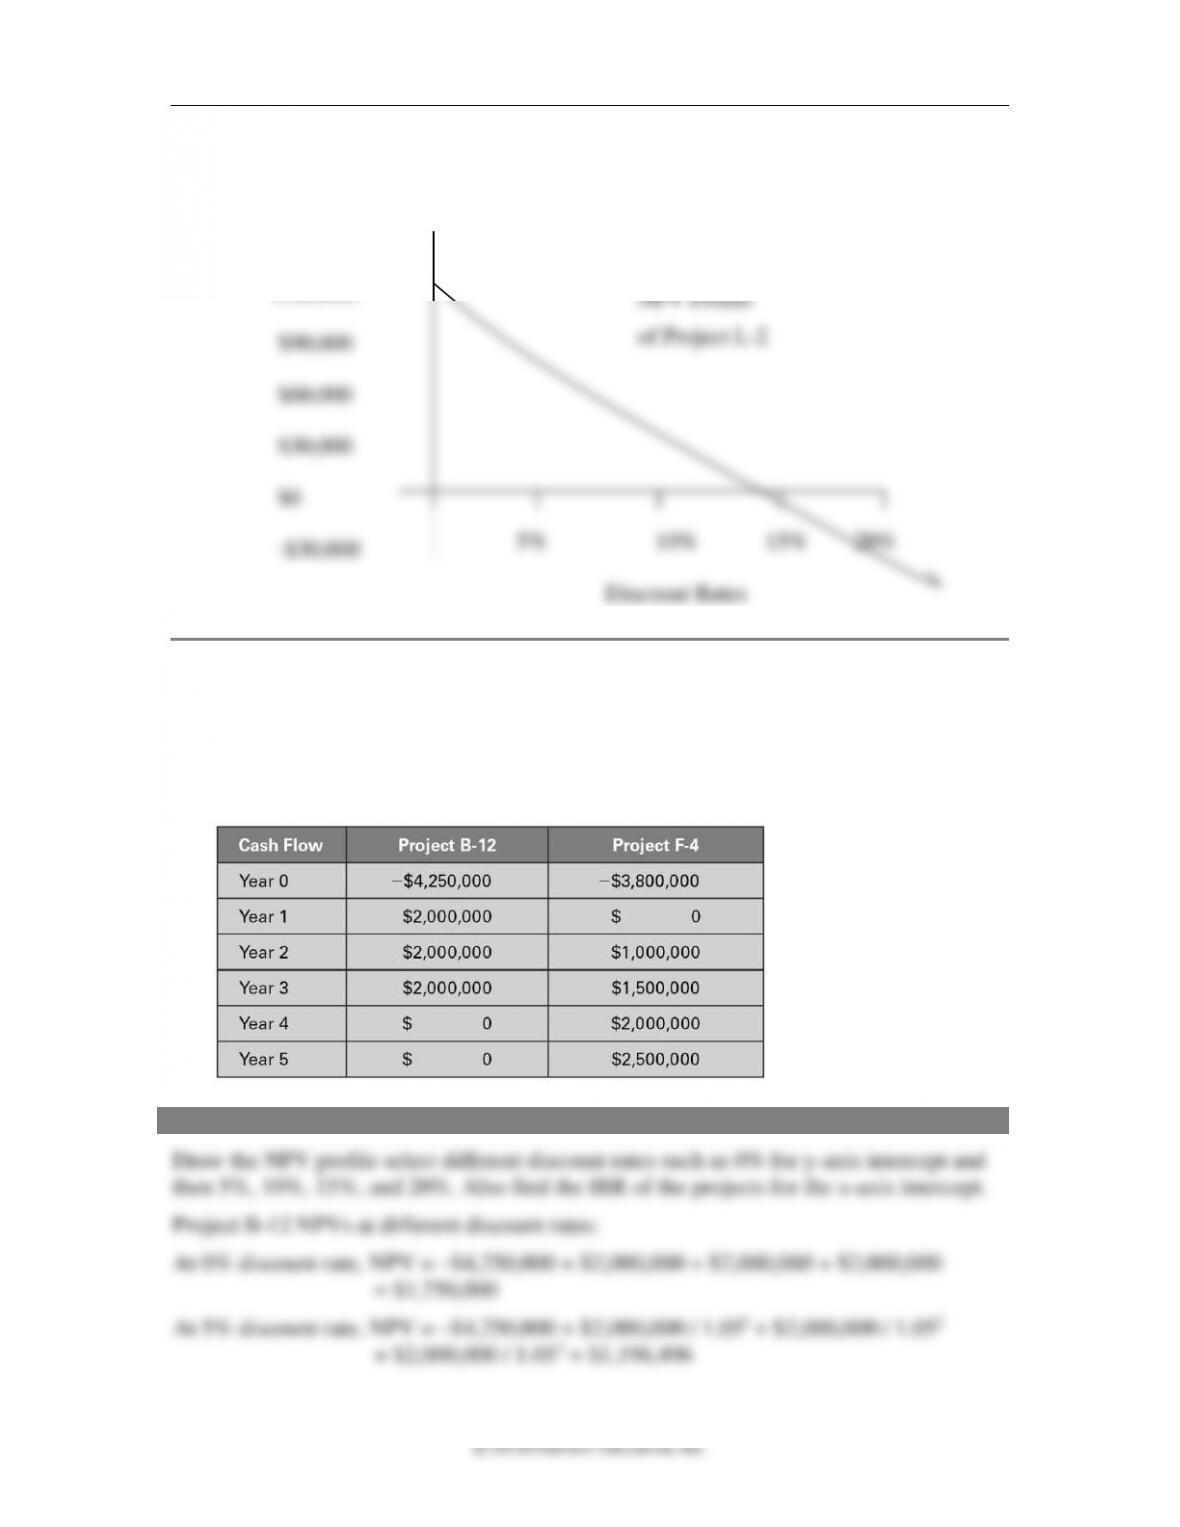
23. NPV profile of a project. Given the following cash flows of Project L-2, draw the
NPV profile. Hint: Be sure to use a discount rate of zero for one intercept (y-axis) and
solve for the IRR for the other intercept (x-axis).
Year 0 = –$250,000
Year 1 = $45,000
Year 2 = $75,000
Year 3 = $115,000
Year 4 = $135,000
ANSWER
Chapter 9 ◼ Capital Budgeting Decision Models 313
24. NPV profiles of two mutually exclusive projects. Moulton Industries has two
potential projects for the coming year, Project B-12 and Project F-4. The two projects
are mutually exclusive. The cash flows are listed in the following table. Draw the
NPV profile of each project, and determine their crossover rate. If the appropriate
hurdle rate is 10% for both projects, which project does Moulton Industries choose?
ANSWER
5% 10% 15% 20%
Discount Rates
$120,000
$90,000
$60,000
$30,000
$0
-$30,000
NPV Dollars
314 Brooks ◼ Financial Management: Core Concepts, 4e
At 10% discount rate, NPV = –$4,250,000 + $2,000,000 / 1.101 + $2,000,000 / 1.102
Project F-4 NPVs at different discount rates:
At 0% discount rate, NPV = –$3,800,000 + $1,000,000 + $1,500,000 + $2,000,000
+ $2,500,000 = $3,200,000
At 5% discount rate, NPV = –$3,800,000 + $1,000,000 / 1.052 + $1,500,000 /1.053
flows for each year.
Dollars in Millions
IRR of the differences in cash flows is:
Project
Year 0
Year 1
Year 2
Year 3
Year 4
Year 5
B-12
–$4.250
$2.000
$2.000
$2.000
$0.000
$0.000
F-4
–$3.800
$0.000
$1.000
$1.500
$2.000
$2.500
Difference
–$0.450
$2.000
$1.000
$0.500
–$2.000
–$2.500
Chapter 9 ◼ Capital Budgeting Decision Models 315
© 2018 Pearson Education, Inc.
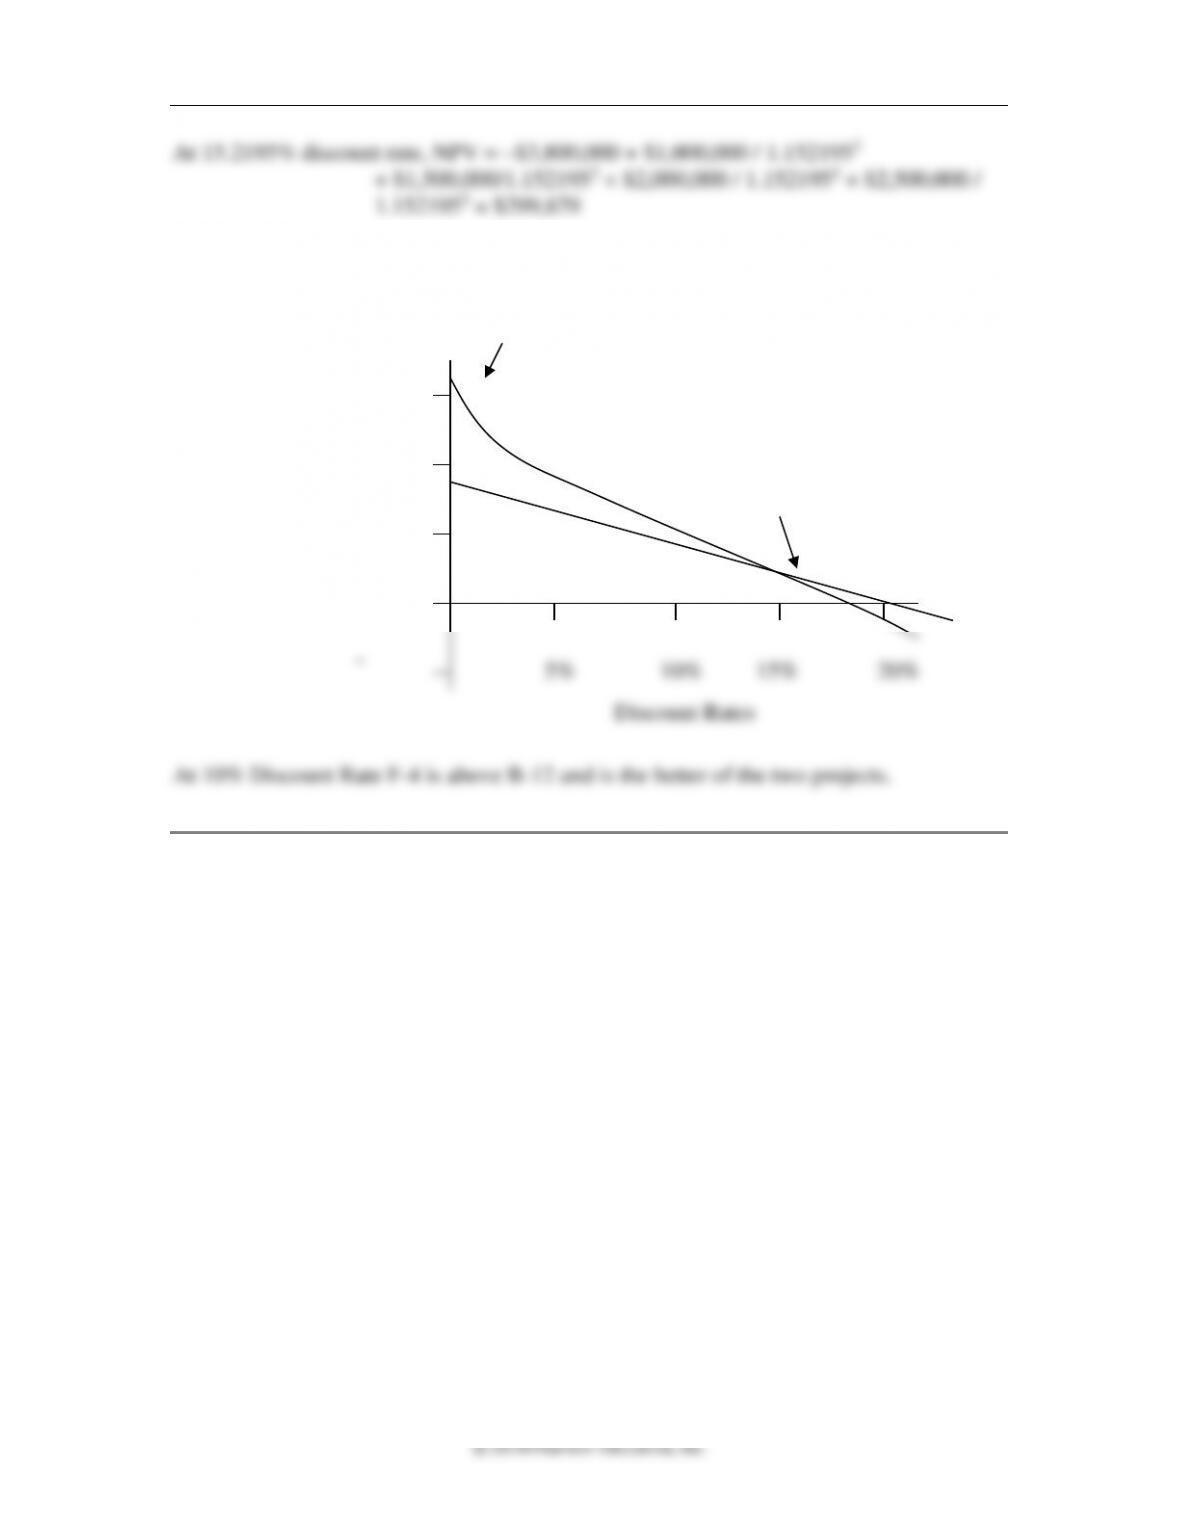
At 15.2195% discount rate, NPV = –$3,800,000 + $1,000,000 / 1.1521952
+ $1,500,000/1.1521953 + $2,000,000 / 1.1521954 + $2,500,000 /
1.1521955 = $299,879
NPV Profiles of B-12 and F-4
$ in Millions
Discount Rates
5% 10% 15% 20%
3.0
2.0
1.0
0.0
F-4
B-12
316 Brooks ◼ Financial Management: Core Concepts, 4e
Solutions for Advanced Problems for Spreadsheet Application
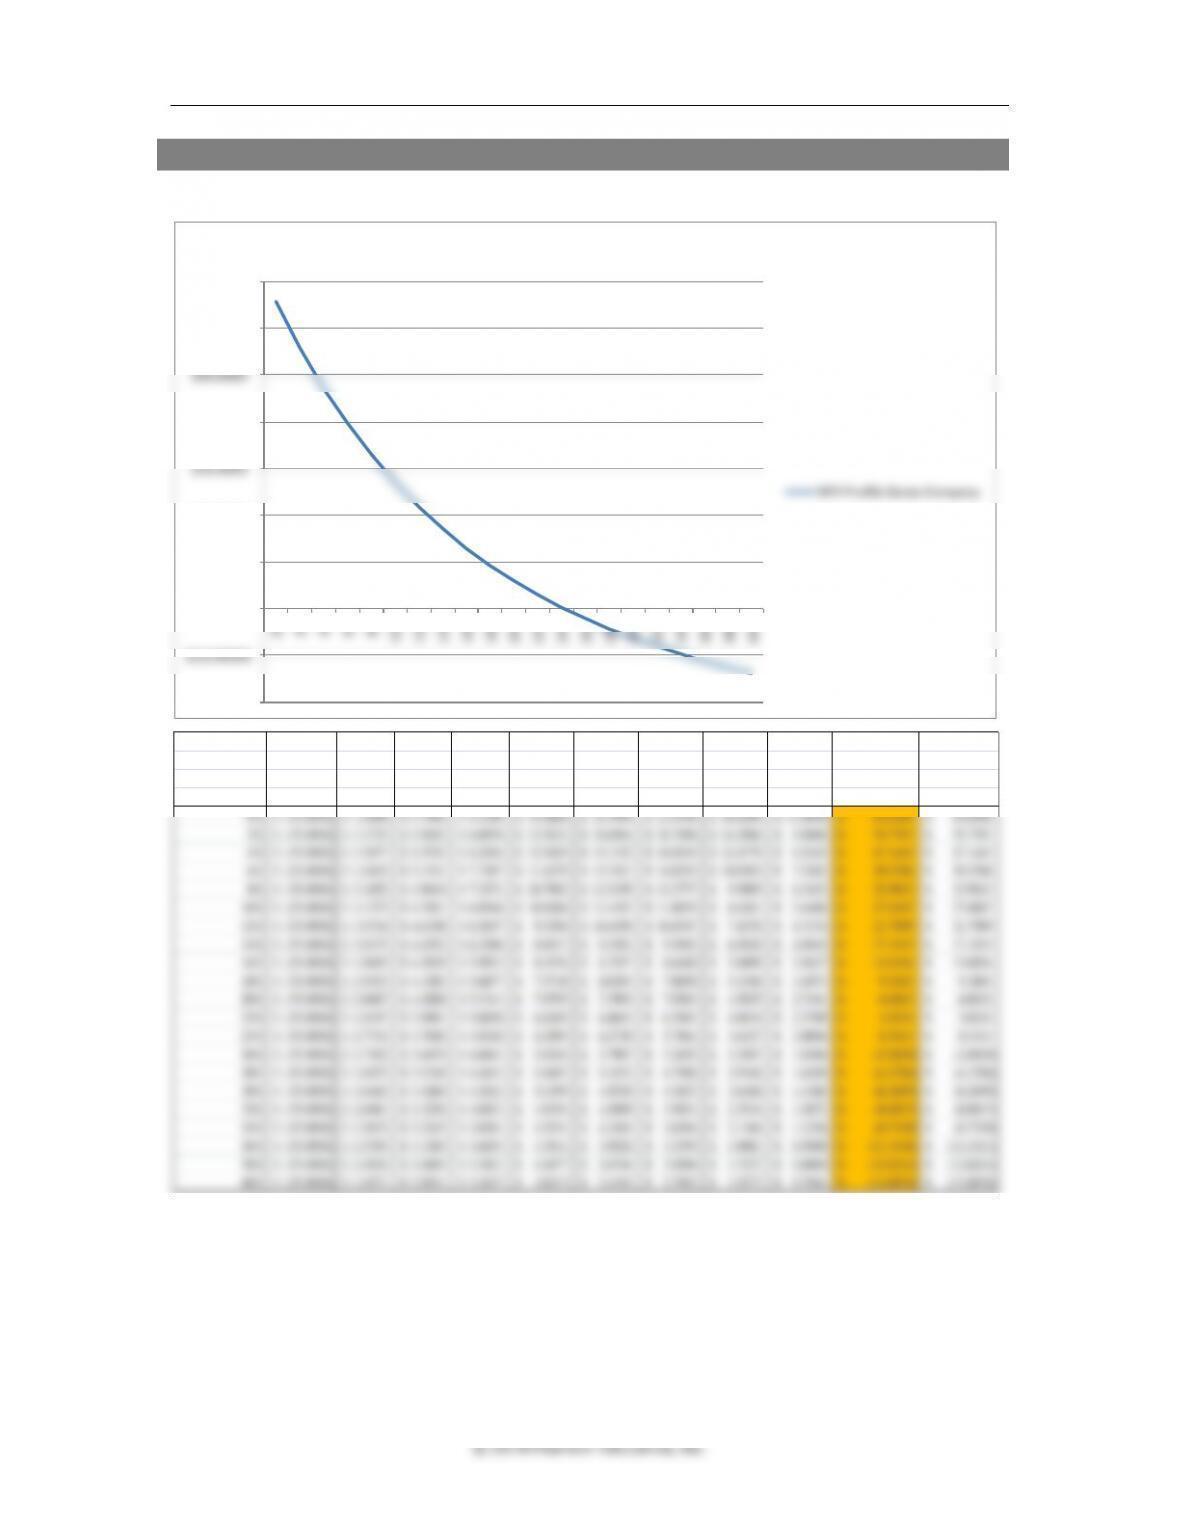
1. NPV Profile:
$(20.0000)
$(10.0000)
$-
$10.0000
$20.0000
$30.0000
$40.0000
$50.0000
$60.0000
$70.0000
0%
2%
4%
6%
8%
10%
12%
14%
16%
18%
20%
22%
24%
26%
28%
30%
32%
34%
36%
38%
40%
NPV Profile Siesta Company
NPV Profile Siesta Company
Year 0 1 2 3 4 5 6 7 8
CF ($ millions) $(35.0500) $3.4400 $5.7900 $9.2300 $14.6800 $18.3900 $21.0700 $16.4200 $11.6800
Calculated NPV Using
Discount Rates PV of Cfo PV CF1 PV CF2 PV CF3 PV CF4 PV CF5 PV CF6 PV CF7 PV CF8 NPV of Project
NPV Function
0% (35.0500)$ 3.4400$ 5.7900$ 9.2300$ 14.6800$ 18.3900$ 21.0700$ 16.4200$ 11.6800$ 65.6500$ 65.6500$
2% (35.0500)$ 3.3725$ 5.5652$ 8.6976$ 13.5621$ 16.6564$ 18.7096$ 14.2946$ 9.9688$ 55.7767$ 55.7767$
4% (35.0500)$ 3.3077$ 5.3532$ 8.2054$ 12.5485$ 15.1152$ 16.6519$ 12.4779$ 8.5345$ 47.1443$ 47.1443$
6% (35.0500)$ 3.2453$ 5.1531$ 7.7497$ 11.6279$ 13.7421$ 14.8535$ 10.9202$ 7.3282$ 39.5700$ 39.5700$
8% (35.0500)$ 3.1852$ 4.9640$ 7.3271$ 10.7902$ 12.5159$ 13.2777$ 9.5809$ 6.3103$ 32.9013$ 32.9013$
10% (35.0500)$ 3.1273$ 4.7851$ 6.9346$ 10.0266$ 11.4187$ 11.8935$ 8.4261$ 5.4488$ 27.0107$ 27.0107$
12% (35.0500)$ 3.0714$ 4.6158$ 6.5697$ 9.3294$ 10.4350$ 10.6747$ 7.4276$ 4.7174$ 21.7909$ 21.7909$
14% (35.0500)$ 3.0175$ 4.4552$ 6.2300$ 8.6917$ 9.5512$ 9.5992$ 6.5620$ 4.0945$ 17.1515$ 17.1515$
16% (35.0500)$ 2.9655$ 4.3029$ 5.9133$ 8.1076$ 8.7557$ 8.6480$ 5.8099$ 3.5627$ 13.0156$ 13.0156$
18% (35.0500)$ 2.9153$ 4.1583$ 5.6177$ 7.5718$ 8.0384$ 7.8050$ 5.1546$ 3.1073$ 9.3184$ 9.3184$
20% (35.0500)$ 2.8667$ 4.0208$ 5.3414$ 7.0795$ 7.3905$ 7.0563$ 4.5825$ 2.7164$ 6.0042$ 6.0042$
22% (35.0500)$ 2.8197$ 3.8901$ 5.0830$ 6.6265$ 6.8043$ 6.3901$ 4.0818$ 2.3799$ 3.0254$ 3.0254$
24% (35.0500)$ 2.7742$ 3.7656$ 4.8410$ 6.2093$ 6.2730$ 5.7961$ 3.6427$ 2.0896$ 0.3414$ 0.3414$
26% (35.0500)$ 2.7302$ 3.6470$ 4.6141$ 5.8243$ 5.7907$ 5.2655$ 3.2567$ 1.8386$ (2.0829)$ (2.0829)$
28% (35.0500)$ 2.6875$ 3.5339$ 4.4012$ 5.4687$ 5.3522$ 4.7908$ 2.9168$ 1.6209$ (4.2780)$ (4.2780)$
30% (35.0500)$ 2.6462$ 3.4260$ 4.2012$ 5.1399$ 4.9530$ 4.3652$ 2.6168$ 1.4318$ (6.2699)$ (6.2699)$
32% (35.0500)$ 2.6061$ 3.3230$ 4.0131$ 4.8354$ 4.5889$ 3.9831$ 2.3516$ 1.2672$ (8.0817)$ (8.0817)$
34% (35.0500)$ 2.5672$ 3.2245$ 3.8361$ 4.5531$ 4.2565$ 3.6394$ 2.1166$ 1.1236$ (9.7329)$ (9.7329)$
318 Brooks ◼ Financial Management: Core Concepts, 4e
© 2018 Pearson Education, Inc.
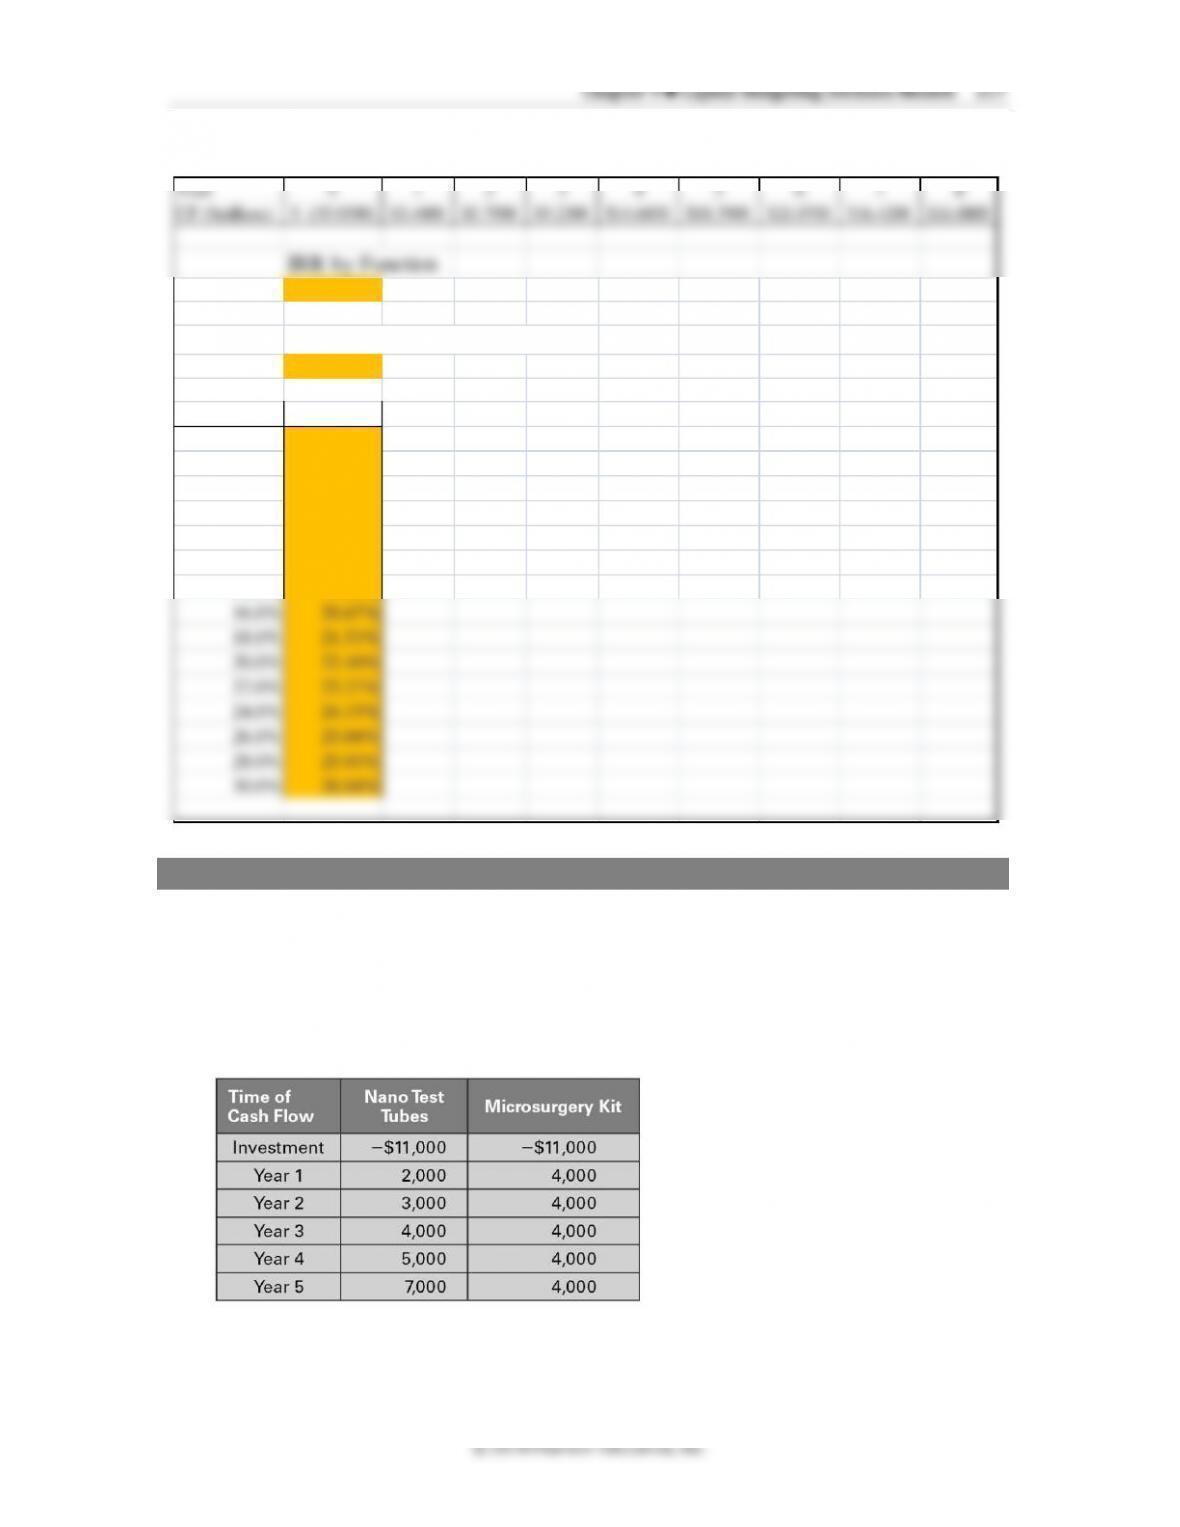
Payback for Nano: cash flows for the first three years total $9,000.
(11,000 –9000)/4,000 = 0.5, so payback for Nano is 3.5 years. For Microsurgery: cash
flows for the first two years total $8,000. (11,000 – 8,000)/4000 = 0.75, so payback
for Microsurgery is 2.75 years.
a. Explain the rationale behind the payback method.
b. State and explain the decision rule for the payback method.
c. Explain how the company would use the payback method to rank mutually
exclusive projects.
d. Comment on the advantages and shortcomings of this method.
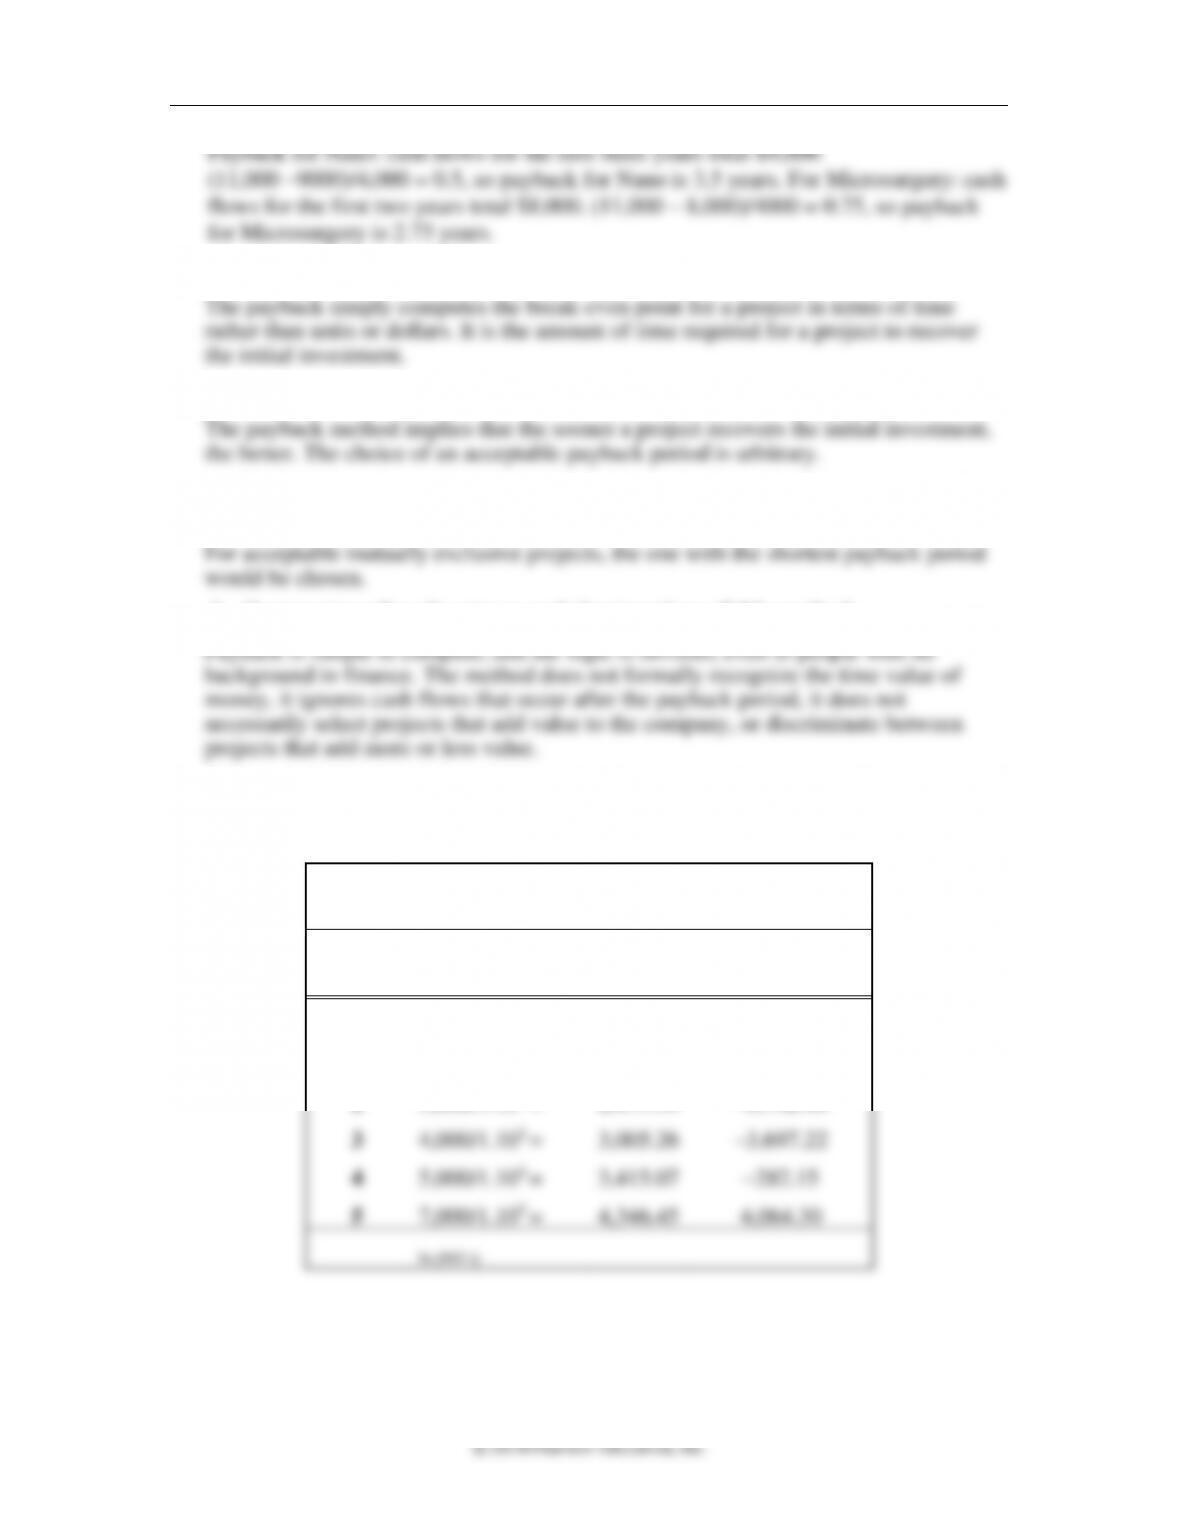
2. Compute the discounted payback period for each project using a discount rate of
10%.
Nano Test
Tubes
Year
PV of CF at 10%
Remaining cost
to recover
0
$ (11.000.00)
1
2,000/1.101 =
1,818.18
–9,181.82
2
3,000/1.102 =
2,479.34
–6,702.48
3
4,000/1.103 =
3,005.26
–3,697.22
4
5,000/1.104 =
3,415.07
–282.15
5
7,000/1.105 =
4,346.45
4,064.30
In (000’s)