

268
Chapter 9
Capital Budgeting Decision Models
LEARNING OBJECTIVES (Slides 9-2 to 9-3)
1. Explain capital budgeting and differentiate between short-term and long-term
budgeting decisions.
2. Explain the payback model and its two significant weaknesses and how the
discounted payback period model addresses one of the problems.
3. Understand the net present value (NPV) decision model and appreciate why it is the
preferred criterion for evaluating proposed investments.
4. Calculate the most popular capital budgeting alternative to the NPV, the internal rate
of return (IRR); and explain how the modified internal rate of return (MIRR) model
attempts to address the IRR’s problems.
5. Understand the profitability index (PI) as a modification of the NPV model.
6. Compare and contrast the strengths and weaknesses of each decision model in a
holistic way.
IN A NUTSHELL…
In this chapter, the author explains the various capital budgeting techniques that can be
used to make informed investment decisions involving productive assets such as plant
and equipment, machinery, etc. In particular, six alternative evaluations techniques are
covered including the payback period, the discounted payback period, the net present
value (NPV) model, the internal rate of return (IRR) criterion, the modified internal rate
of return model (MIRR), and the profitability index (PI). After illustrating and explaining
in detail how each technique is to be used, the strengths and weaknesses of each decision
model are summarized. This chapter sets the stage for the material in the next chapter,
which involves the forecasting and analysis of project cash flows.
LECTURE OUTLINE
9.1 Short-Term and Long-Term Decisions (Slides 9-4 to 9-5)
Long-term decisions, typically, involve longer time horizons, cost larger sums of money,
and require a lot more information to be collected as part of their analysis compared to
short-term decisions. The investment of funds into capital or productive assets, which is
what capital budgeting entails, meets all three of these criteria and therefore is considered
a long-term decision. The efficacy of capital budgeting decisions can have long-term
effects on a firm and are thus to be made with considerable thought and care. Three keys
things should be remembered about capital budgeting decisions:


1. A capital budgeting decision is typically a go or no-go decision on a product, service,
facility, or activity of the firm. That is, we either accept the business proposal or we
reject it.
2. A capital budgeting decision will require sound estimates of the timing and amount of
cash flow for the proposal.
3. The capital budgeting model has a predetermined accept or reject criterion.
9.2 Payback Period and Discounted Payback Period
(Slides 9-6 to 9-12)
Payback Period: This method, which is the easiest to interpret and use, simply tries to
determine the length of time in which an investment pays back its original cost.
If the payback period is less than or equal to the cutoff period, the investment would be
acceptable and vice versa. Thus, its main focus is on cost recovery or liquidity.
The method assumes that all cash outflows occur right at the beginning of the project’s
life followed by a stream of inflows. Furthermore, it assumes that that cash inflows occur
uniformly over the year. Thus, if we need to recover $40,000 and we receive three cash
Example 1: Payback period of a new machine
Year
Cash flow
Yet to be recovered
Percentage of Year
Recovered/Inflow
0
(10,000)
(10,000)
1
4,000
(6,000)
2
4,500
(1,500)
3
10,000
0. (recovered)
15%
4
8,000
Not used in decision
Payback Period = 2.15 yrs.
Reject
➢ 2 years
Let’s say that the owner of Perfect Images Salon is considering the purchase of a new
tanning bed, which costs $10,000 and is likely to bring in after-tax cash inflows of $4,000
in the first year, $4,500 in the second year, $10,000 in the third year, and $8,000 in the
fourth year. The firm has a policy of buying equipment only if the payback period is two
years or less. Calculate the payback period of the tanning bed, and state whether or not
the owner would buy it.


270 Brooks ◼ Financial Management: Core Concepts, 4e
The payback period method has three major flaws:
1. It ignores all cash flow after the initial cash outflow has been recovered.
2. It ignores the time value of money.
3. It does not take into account the risk of the cash flows.
Discounted Payback Period calculates the time it takes to recover the initial investment
in current or discounted dollars.
Thus, it takes into account the time value of money by adding up the cash inflows that
have been discounted to time 0, using the appropriate hurdle or discount rate and then
measuring the payback period.
It is still flawed in that cash flows after the payback are ignored.
Example 2: Calculate discounted payback period
Calculate the discounted payback period of the tanning bed, stated in Example 1 above,
by using a discount rate of 10%.
9.3 Net Present Value (NPV) (Slides 9-13 to 9-29)
The NPV method is applied by discounting all the cash flows from a project back to time
0 using an appropriate discount rate, r as shown in Equation 9.1 below:
A positive NPV implies that the project is adding value to the firm’s bottom line and
therefore when comparing projects, the higher the NPV the better.
Year
Cash flow
Discounted
CF
Yet to be
recovered
Percentage of Year
Recovered/Inflow
0
(10,000)
(10,000)
(10,000)
1
4,000
3,636
(6,364)
2
4,500
3,719
(2,645)
3
7,513
4,869
decision


Chapter 9 ◼ Capital Budgeting Decision Models 271
Example 3: Calculating NPV
Using the cash flows for the tanning bed given in Example 2 above, calculate its NPV
and indicate whether the investment should be undertaken or not.
Mutually Exclusive versus Independent Projects
The NPV approach can be used to evaluate independent as well as mutually exclusive
projects.
A choice between mutually exclusive projects arises when
1. There is a need for only one project, and both projects can fulfill that need.
2. There is a scarce resource that both projects need, and by using it in one project, it is
not available for the second.
Because the NPV rule considers whether or not cash inflows that have been discounted
at the relevant cost of capital outweigh the cash outflows emanating from a project,
higher positive NPVs would be preferred to lower or negative NPVs, making the
decision clear-cut.
Example 4: Calculate NPV for choosing between mutually exclusive projects
The owner of Perfect Images Salon has a dilemma. She wants to start offering tanning
services and has to decide between purchasing a tanning bed and a tanning booth. In
either case, she figures that the cost of capital will be 10%. The relevant annual cash
flows with each option are listed below:
Year
Tanning
Bed
Tanning
Booth
0
–10,000
–12,500
1
4,000
4,400
2
4,500
4,800
3
10,000
11,000
4
8,000
9,500
Can you help her make the right decision?


272 Brooks ◼ Financial Management: Core Concepts, 4e
Thus, the less expensive tanning bed with the higher NPV (10,332.62 > 10,220.03) is
the better option.
Unequal Lives of Projects
Firms often have to decide between alternatives that are mutually exclusive, cost different
amounts, have different useful lives, and require replacement once their productive lives
run out.
In such cases, using the traditional NPV (single life analysis) as the evaluation criterion
can lead to incorrect decisions because the cash flows will change once replacement
occurs.
Under the NPV approach, such mutually exclusive projects with unequal lives can be
analyzed by using one of the following two modified approaches:
1. We find a common point (lowest common multiple) at which both projects will
require replacement at the same time. For example, if Project A lasts for three years,


Chapter 9 ◼ Capital Budgeting Decision Models 273
Example 5: Unequal lives
Let’s say that two tanning beds are available. One lasts for three years while the other for
four years. The owner realizes that she will have to replace either of these two beds with
new ones when they are at the end of their productive life because she plans on being in
the business for a long time. Using the cash flows listed below, and a cost of capital is
10%, help the owner decide which of the two tanning beds she should choose.
Year
Tanning
Bed A
Tanning
Bed B
0
–10,000
–5,750
1
4,000
4,000
2
4,500
4,500
3
10,000
9,000
4
8,000
——–
Using the Replacement Chain method:
1. Calculate the NPV of each tanning bed for a single life
2. Next, calculate the Total NPV of each bed using three repetitions for A and four
for B We assume that bed A will be replaced at the end of Years 4, and 8, lasting 12
years, while bed B will be replaced in Years 3, 6, and 9, also lasting for 12 years in
total.
Note: We will have an NPV in Years 0, 4, and 8 for bed A (with three replications),
and in Years 0, 3, 6, and 9 for bed B (with four replications). We assume that the
annual cash flows are the same for each replication.

274 Brooks ◼ Financial Management: Core Concepts, 4e
© 2018 Pearson Education, Inc.
Decision: Bed B with its higher Total NPV should be chosen.
Net Present Value Example: Equation and Calculator Function
When solving for the NPV given a series of cash flows, we can use equation 9.1,
manually solve for the present values of the cash flows, and sum them up as shown in the
examples above; or we can use a financial calculator such as the TI Business Analyst II
or TI-83 and input the necessary values using either the CF key (BA-II) or the NPV
function (TI-83) as shown in the following example.
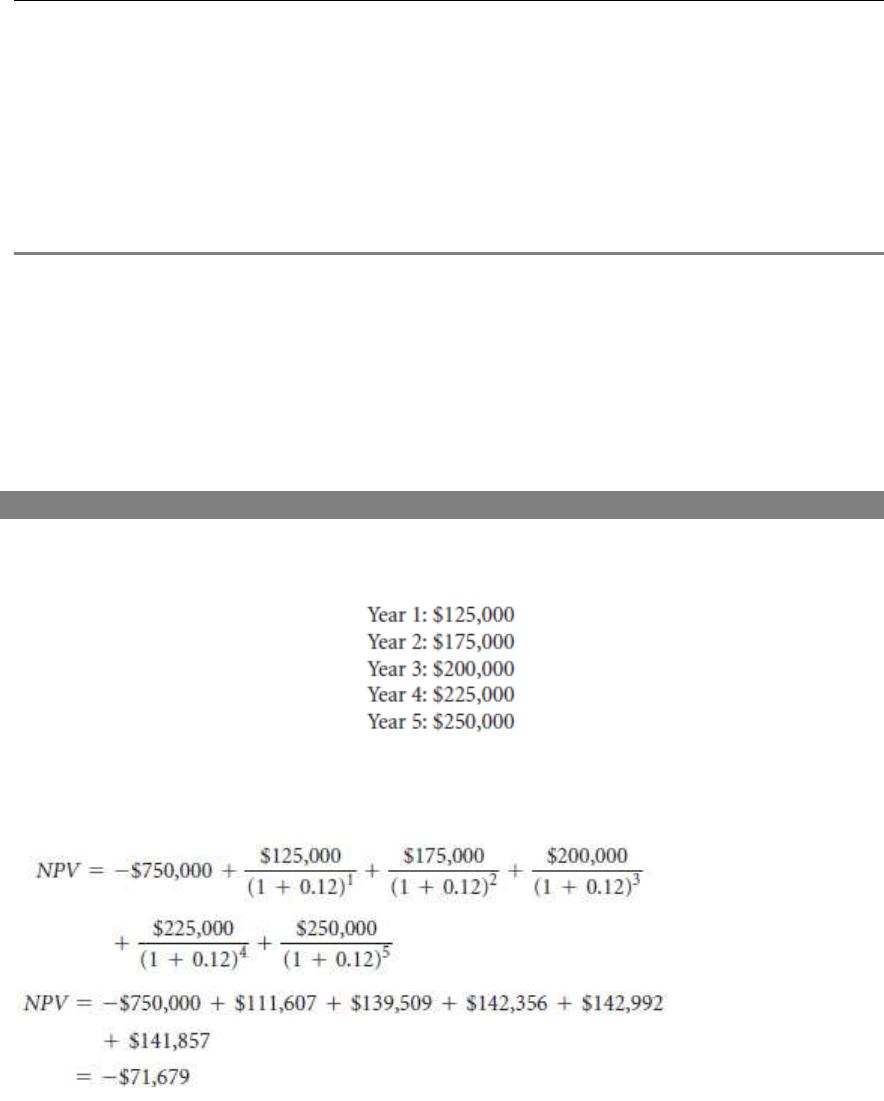
Example 6: Solving NPV using a calculator and the equation
A company is considering a project that costs $750,000 to start and is expected to
generate after-tax cash flows as follows:
If the cost of capital is 12%, calculate its NPV.
Equation method:

Chapter 9 ◼ Capital Budgeting Decision Models 275
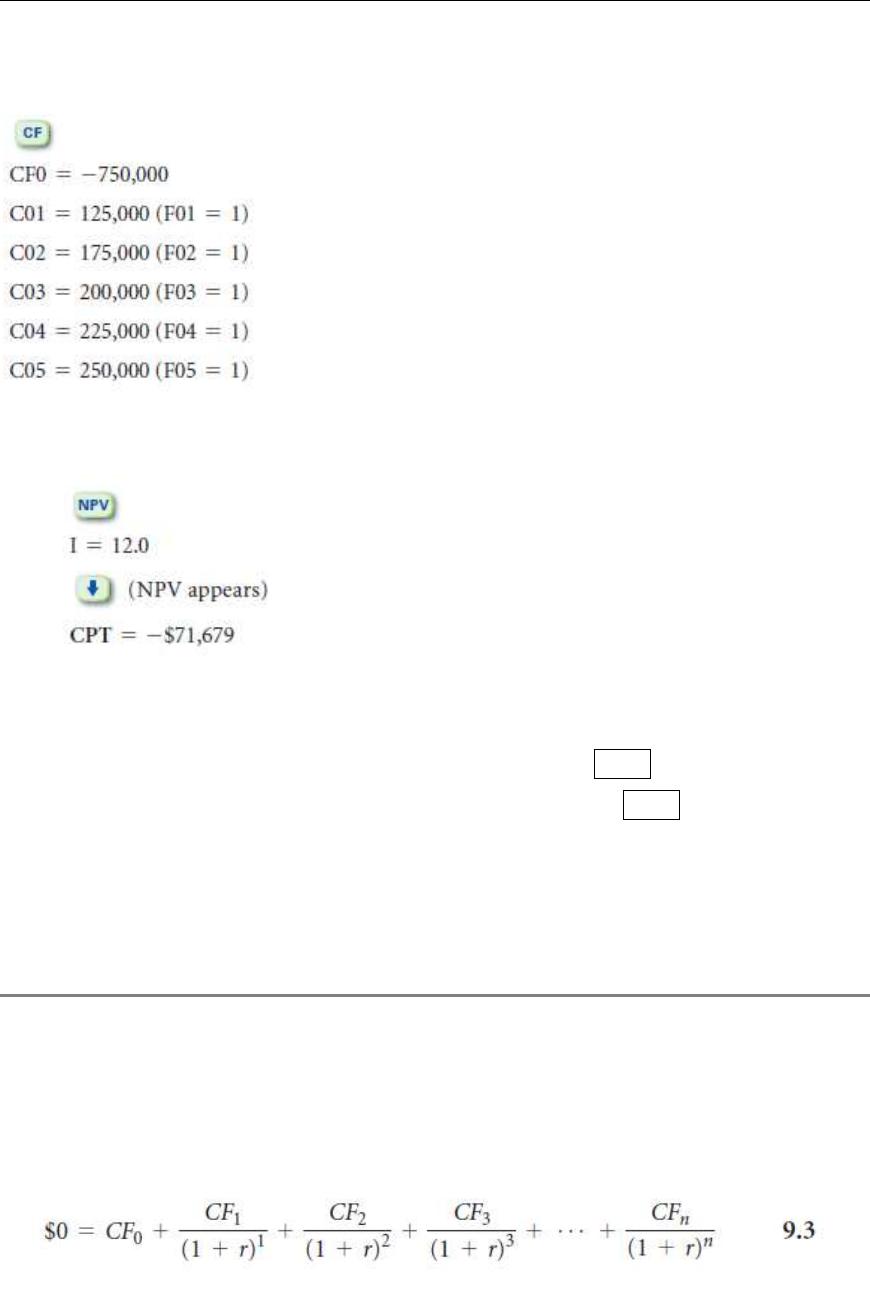
Calculator method:
TI-BAII Plus: We enter the respective cash flows sequentially using the CF key
Then we press the NPV key, enter the discount rate, I, and press the down arrow as
follows to get the following result:
TI-83 Method:
We use the NPV function (available under the FINANCE mode) as follows:
9.4 Internal Rate of Return and
Modified Internal Rate of Return (Slides 9-30 to 9-46)
Internal Rate of Return (IRR) is the discount rate that forces the sum of all the
discounted cash flows from a project to equal 0, as shown in equation 9.3 below:
276 Brooks ◼ Financial Management: Core Concepts, 4e
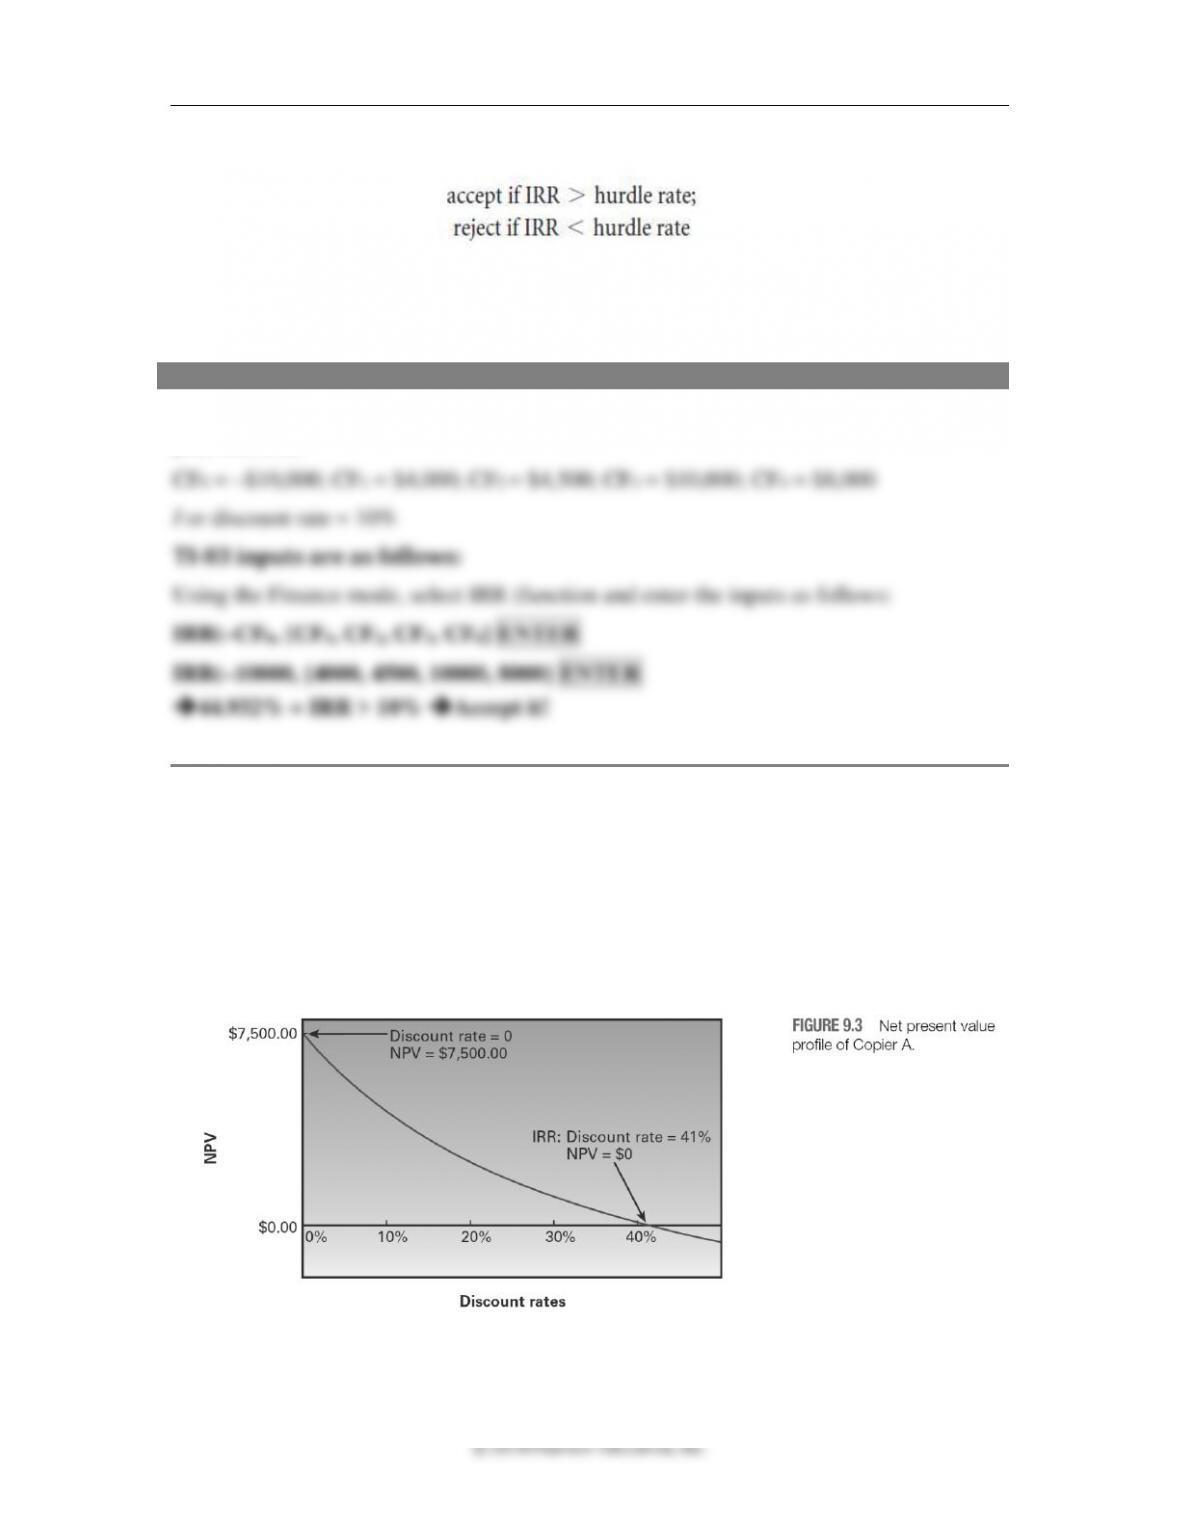
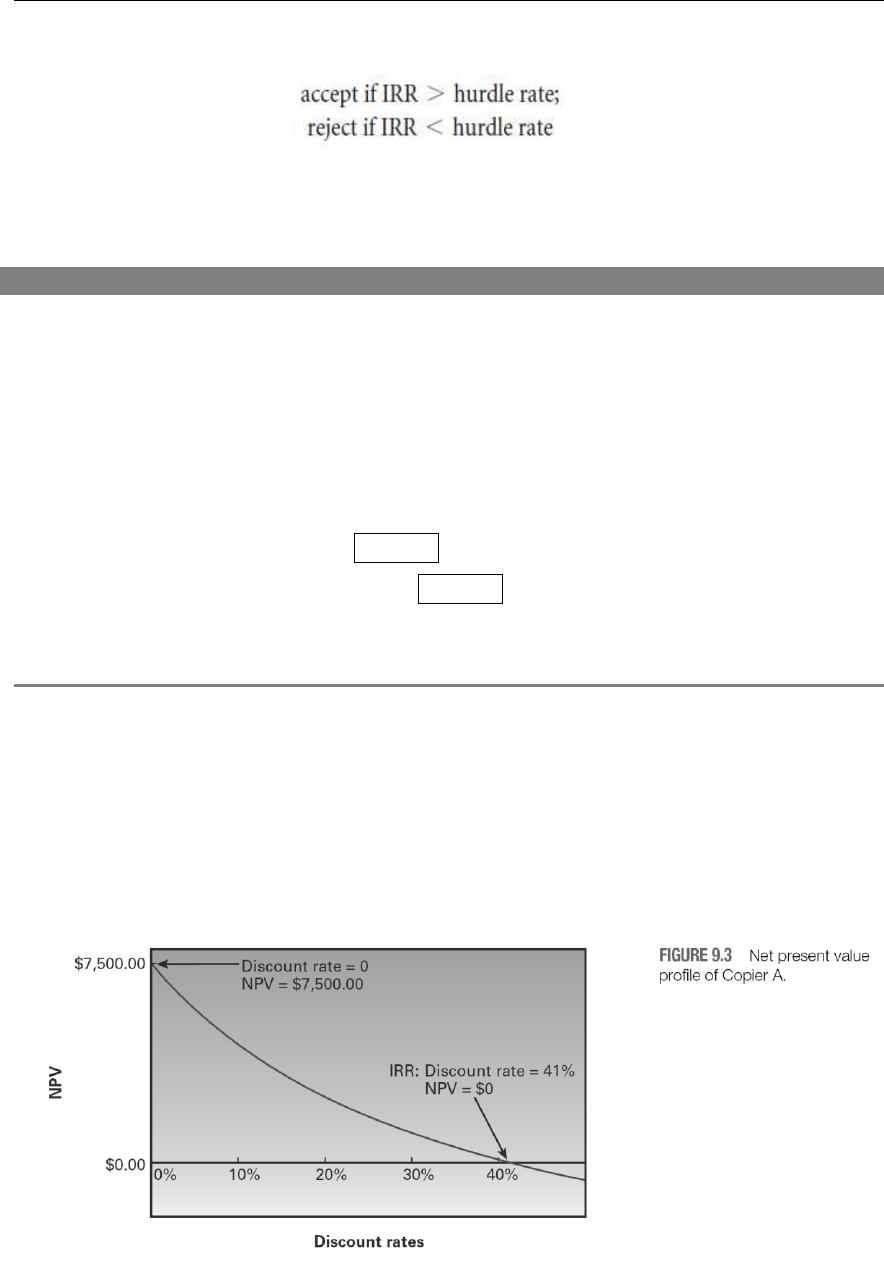
The decision rule that would be applied is as follows:
If the project’s IRR is higher than the discount or hurdle rate, it would essentially mean
that its NPV would be greater than zero as well. The IRR is measured as a percentage,
while the NPV is measured in dollars.
Example 7: Calculating IRR with a financial calculator
Using the cash flows for the tanning bed given in Example 1, calculate its IRR and state
your decision.
Appropriate Discount Rate or Hurdle Rate: A project’s discount rate or hurdle rate is the
minimum acceptable rate of return that an investor or firm should earn on a project given
its riskiness. For a firm, it would typically be its weighted average cost of capital
(covered in later chapters). Sometimes, it helps to draw an NPV profile as shown in
Fig. 9.3 below, which a graph is plotting various NPVs for a range of incremental
discount rates, showing at which discount rates the project would be acceptable and at
which rates it would not.

Chapter 9 ◼ Capital Budgeting Decision Models 277
The point where the NPV line cuts the x-axis is the IRR of the project, i.e., the discount
rate at which the NPV = 0. Thus, at rates below the IRR, the project would have a
positive NPV and would be acceptable and vice versa.
Problems with the Internal Rate of Return: In most cases, the NPV criterion and the IRR
approach lead to consistent decisions. That is, if a project has a positive NPV, its IRR
will exceed its hurdle rate, making it acceptable. Similarly, the highest NPV project will
also generally have the highest IRR.
However, there are some cases when the IRR method leads to ambiguous decisions or is
problematic.
In particular, we can have two problems with the IRR approach:
1. Multiple IRRs
2. An unrealistic reinvestment rate assumption
Multiple IRRs
Projects that have nonnormal cash flows (as shown below), i.e. multiple sign changes
during their lives, often end up with multiple IRRs.
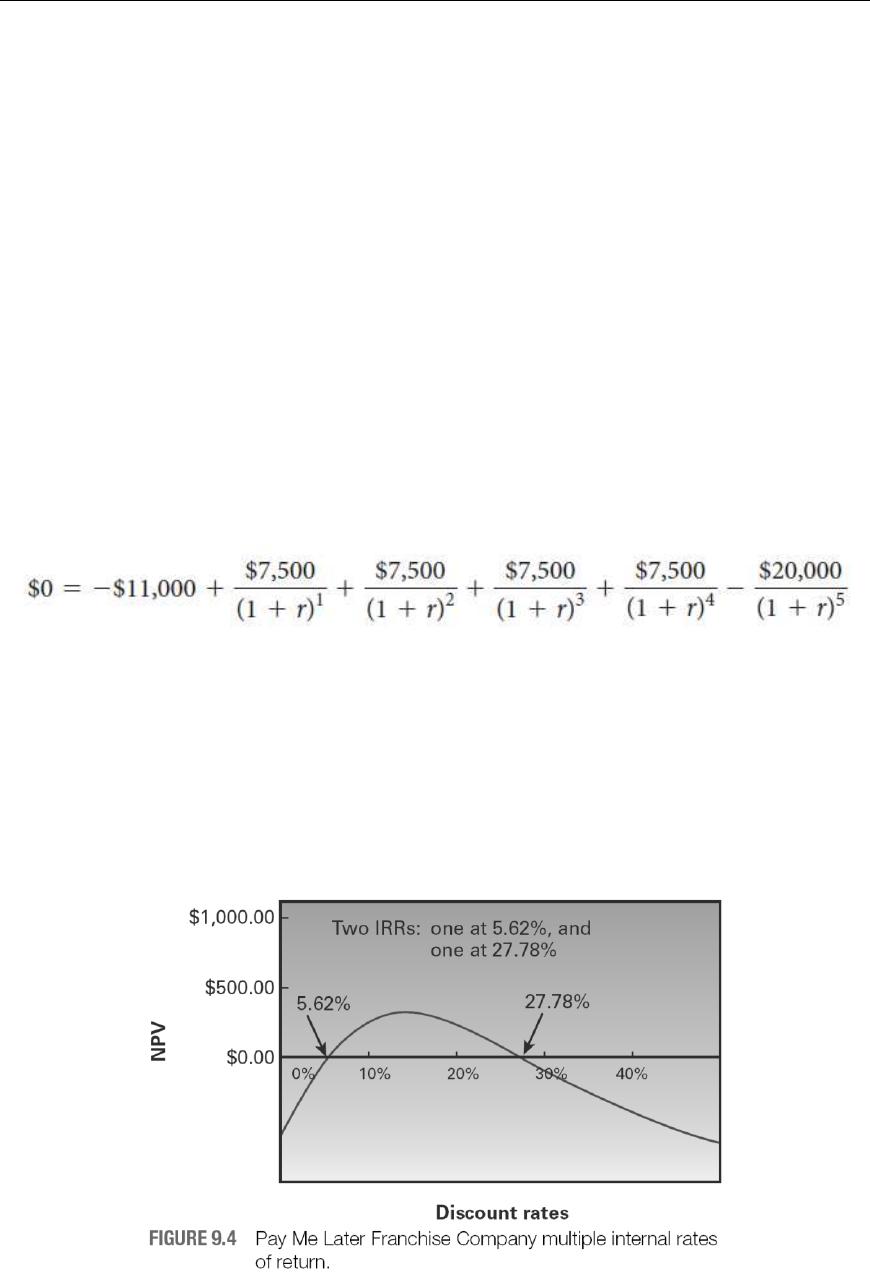
When solving for the IRR for this project using a financial calculator, we get only one of
the two IRRs, i.e., 5.6193%. If the cost of capital was higher than 5.62%, we would
reject the project because it would not satisfy the IRR decision rule.
But, as Figure 9.4 shows, the NPV profile of this project crosses the x-axis at two points
(5.6193% and 27.7778%), meaning it has two IRRs. In other words, if the cash flows in
Years 1 through 5 are discounted back at either 27.7778% or at 5.6193%, their sum
would exactly equal $11,000, i.e., the initial cash outflow resulting in an NPV of zero.
So, which is the true IRR?

278 Brooks ◼ Financial Management: Core Concepts, 4e
This typically happens when a project has nonnormal cash flows, i.e., the cash inflows
and outflows are not all clustered together or all negative cash flows in early years are
followed by all positive cash flows later, or vice versa.
If the cash flows have multiple sign changes during the project’s life, it leads to multiple
IRRs and therefore ambiguity as to which one is correct.
In such cases, the best thing to do is to draw an NPV profile and select the project if it has
a positive NPV at our required discount rate and vice versa.
Reinvestment and Crossover Rates: Another problem with the IRR approach is that it
inherently assumes that the cash flows are being reinvested at the IRR, which if unusually
high, can be highly unrealistic. In other words, if the IRR was calculated to be 40%, this
would mean that we are implying that the cash inflows from a project are being
reinvested at a rate of return of 40% for the IRR to materialize.
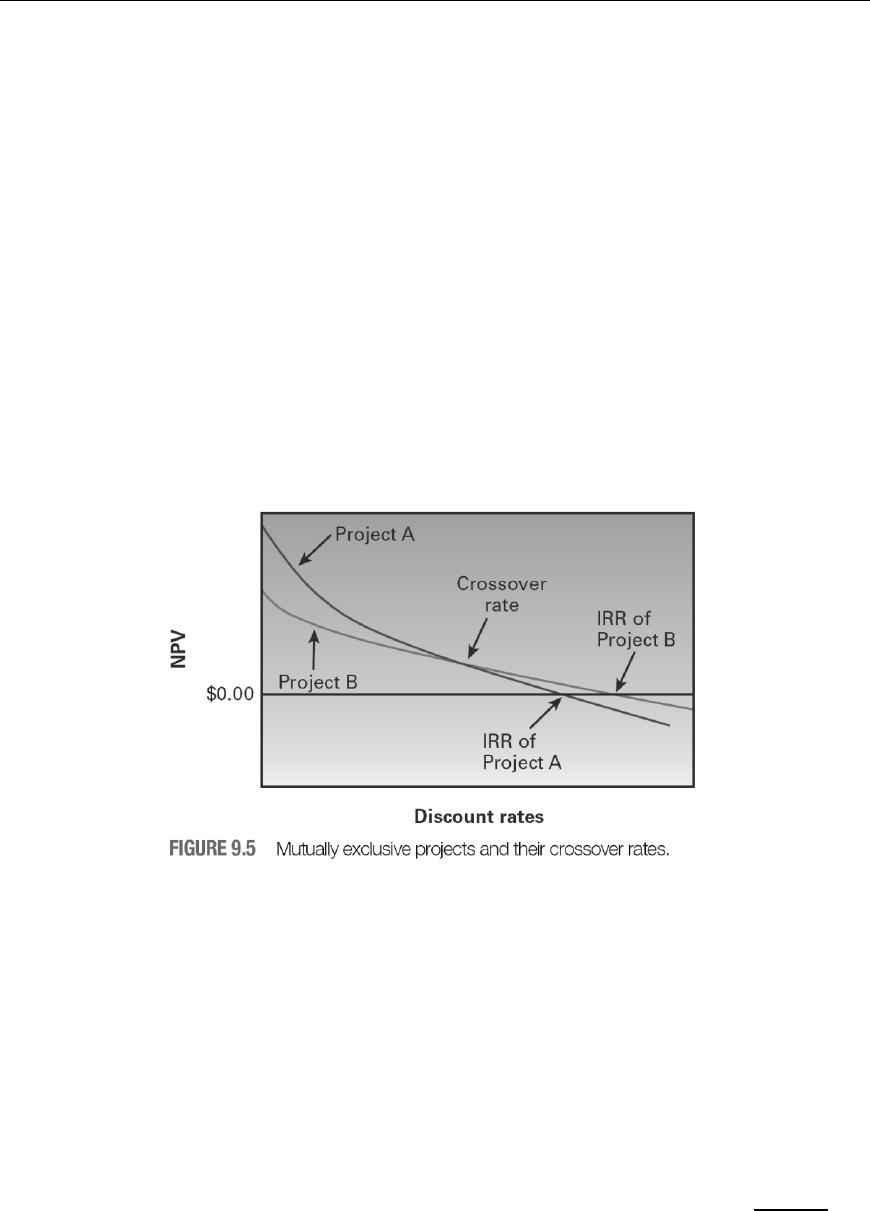
A related problem arises when in the case of mutually exclusive projects we have either
significant cost differences or significant timing differences, leading to the NPV profiles
crossing over as shown in Figure 9.5 below.
Notice that Project B’s IRR is higher than Project A’s IRR, making it the preferred choice
based on the IRR approach.
However, at discount rates lower than the crossover rate, Project A has a higher NPV
than Project B, making it more acceptable because it is adding more value.
If the discount rate is exactly equal to the crossover rate, both projects would have the
same NPV.
To the right of the crossover point, both methods would select Project B.
The fact that at certain discount rates we have conflicting decisions being provided by the
IRR method vis-à-vis the NPV method is the problem.
So, when in doubt go with the project with the highest NPV; it will always be correct.

Chapter 9 ◼ Capital Budgeting Decision Models 279
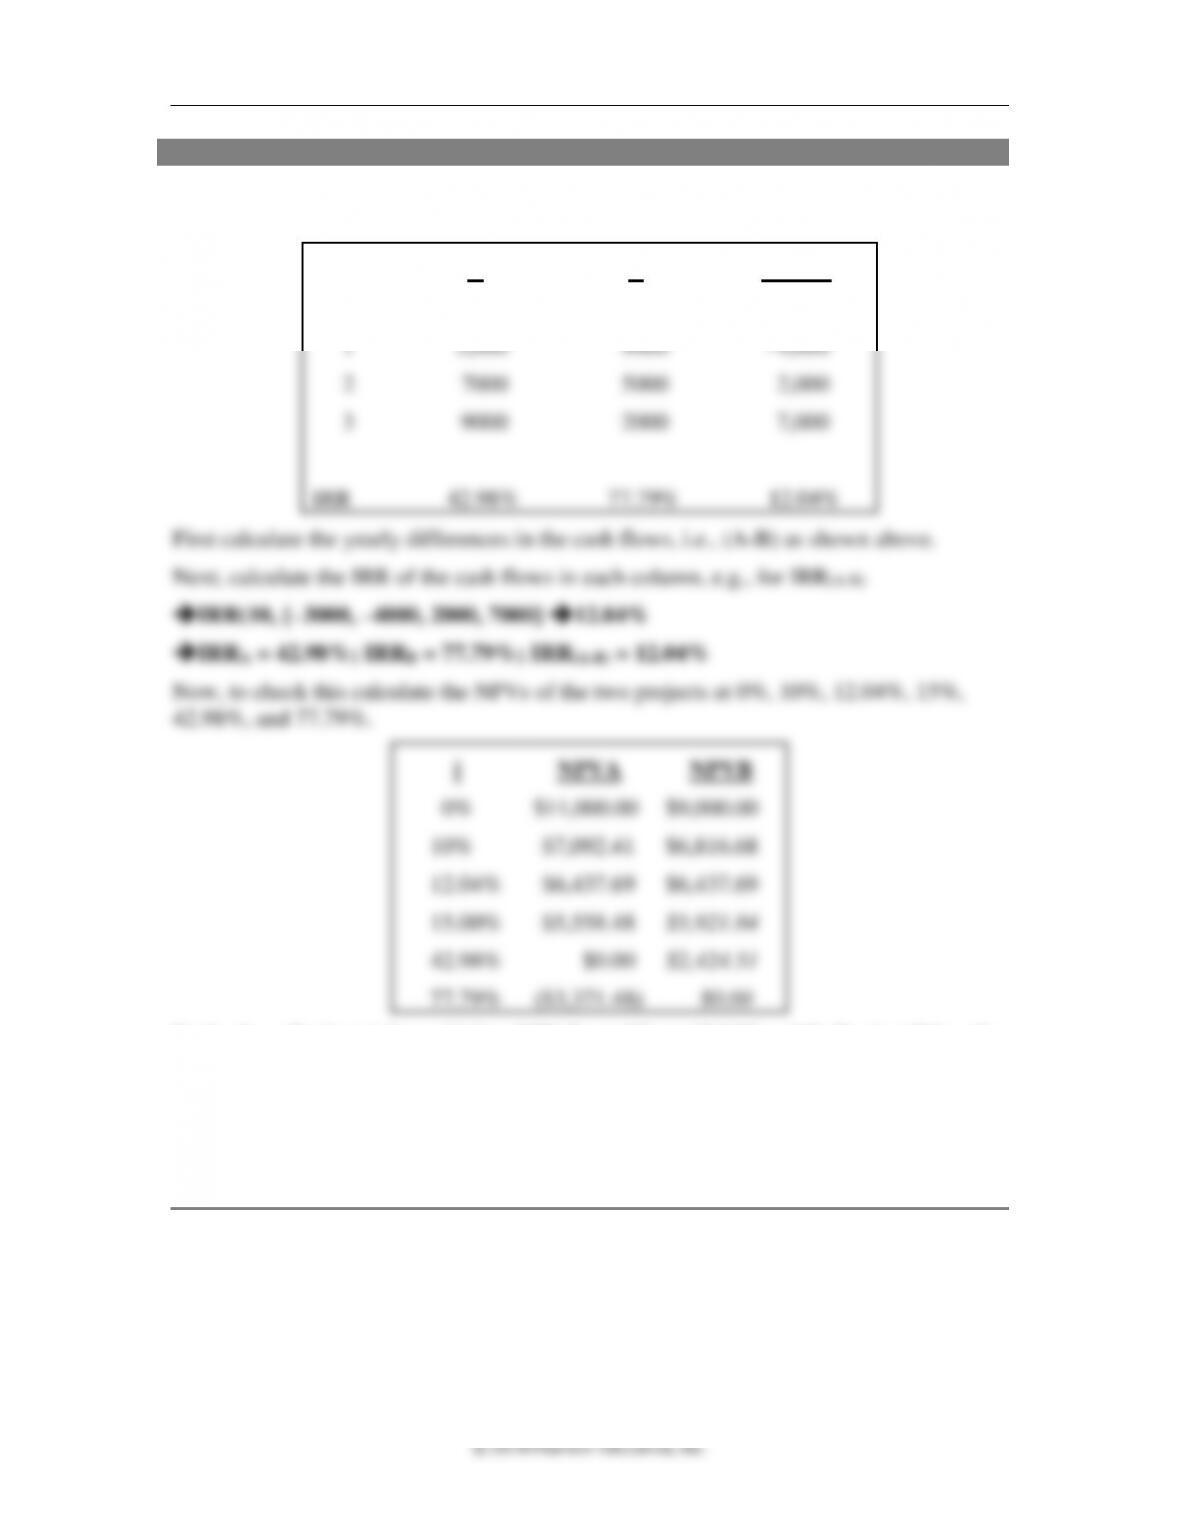
Example 8: Calculating the crossover rate of two projects
Listed below are the cash flows associated with two mutually exclusive projects, A and
B. Calculate their crossover rate.
Year
A
B
(A – B)
0
–10,000
–7,000
–3,000
1
–4,000
2
3
Notice how Project A has a higher NPV from 0% to 12.04%, while Project B has the
higher NPV at rates above 12.04%. So, the NPV profiles cross over at 12.04%, and
at that rate the two NPVs are equal ($6,437.69). Based on the IRRs only, Project B
should have been selected, but at discount rates below 12.04%, the decision would
have been suboptimal for the firm.


280 Brooks ◼ Financial Management: Core Concepts, 4e
Modified Internal Rate of Return
Despite all its shortcomings, as explained above, managers like to use the IRR as an
evaluation criterion because it is expressed as a percentage rather than in dollars.
To get around the criticism of the traditional IRR, regarding its unrealistic reinvestment
rate assumption, the modified IRR (MIRR) was developed.
Under the MIRR, all cash outflows are assumed to be reinvested at the firm’s cost of
capital or hurdle rate, which makes it more realistic.
We calculate the future value of all positive cash flows at the terminal year of the project,
the present value of the cash outflows at time 0, using the firm’s hurdle rate, and then
solve for the relevant rate of return that would be implied using the following equation:
1
1
n
FV
MIRR PV
=−
Example 9: Calculating MIRR
Using the cash flows given in Example 8 and a discount rate of 10%, calculate the
MIRRs for Projects A and B. Which project should be accepted? Why?
Project A:
Project B:

9.5 Profitability Index (Slides 9-47 to 9-48)
When faced with a capital rationing problem, i.e., a constrained budget, it would make
sense to choose the projects that give us the best “bang for our buck.”
The Profitability Index can be used to calculate the ratio of the PV of benefits (inflows) to
the PV of the cost of a project as follows:
cost
with standard cash flow cost
NPV
PI +
=
In essence, it tells us how many dollars we are getting per dollar invested.
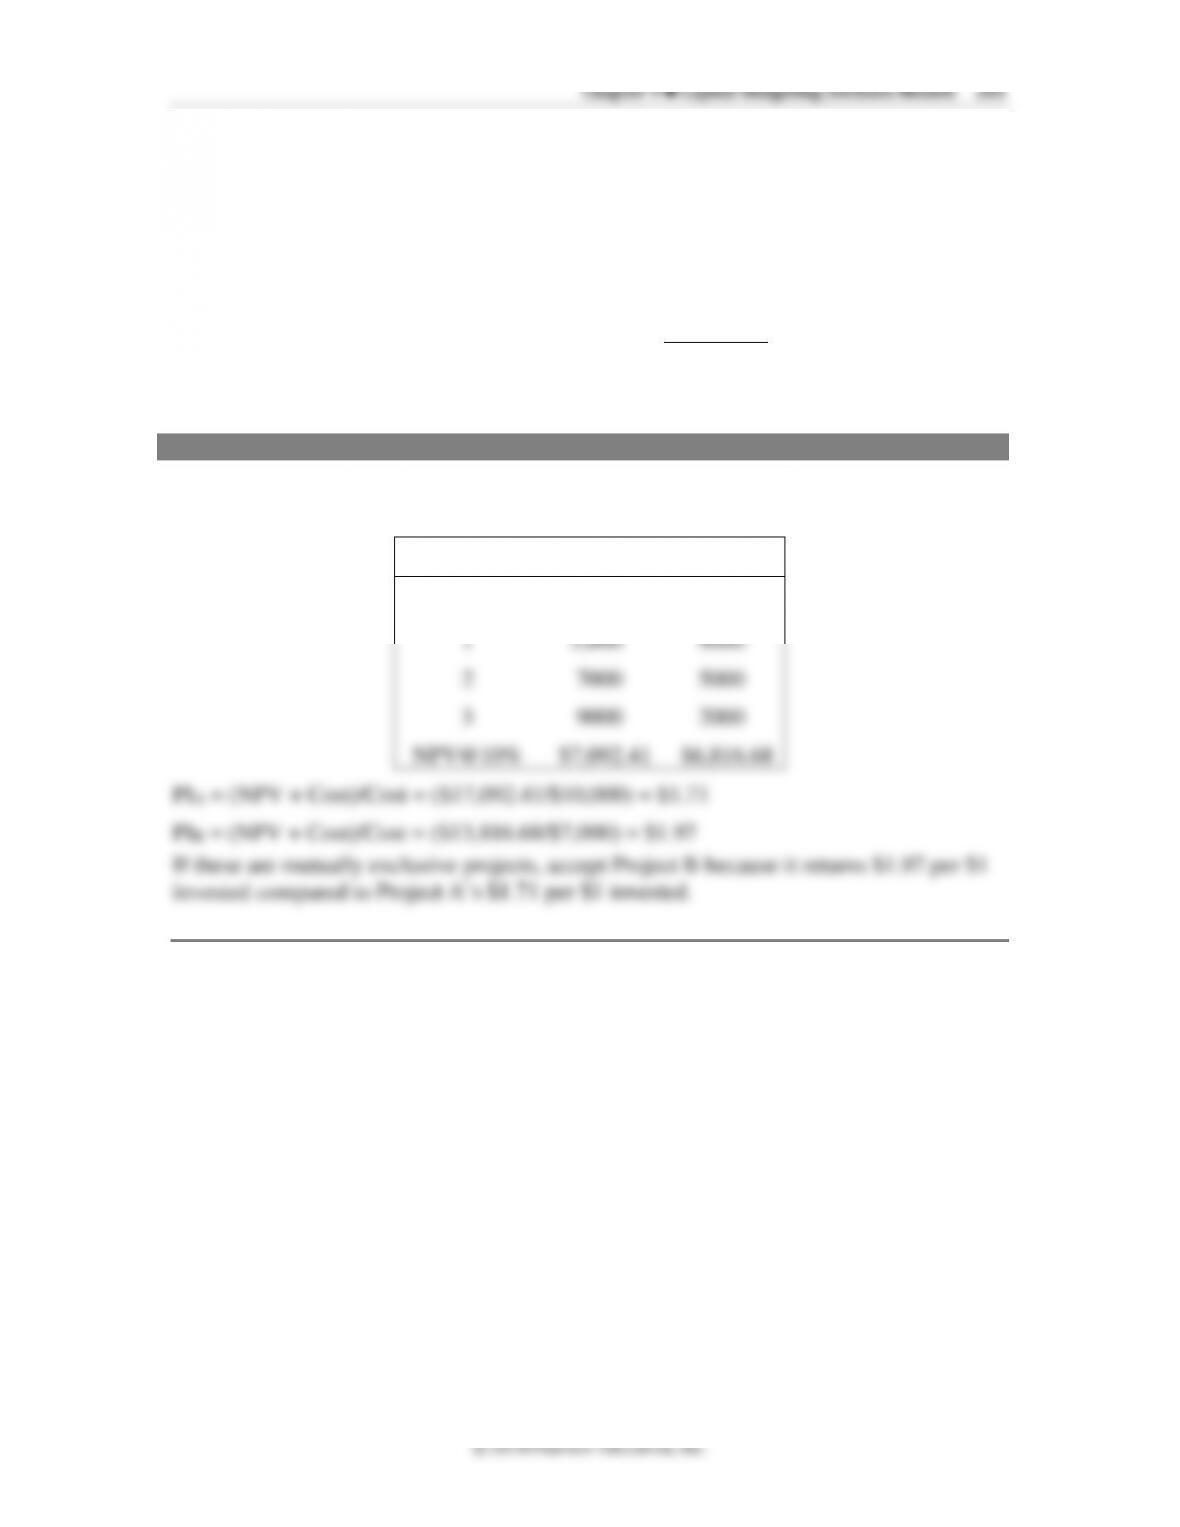
Example 10: PI calculation
Using the cash flows listed in Example 6, and a discount rate of 10%, calculate the PI of
each project. Which one should be accepted, if they are mutually exclusive? Why?
Year
A
B
0
–10,000
–7,000
1
2
3
9.6 Overview of Six Decision Models (Slides 9-49 to 9-54)
Based on the six models covered in this chapter, the following observations can be made
(as summarized in Table 9.4 shown below):
1. Payback period is simple and fast, but economically unsound. It ignores all cash flow
after the cutoff date, it ignores the time value of money, and it does not account for
risk.
2. Discounted payback period incorporates the time value of money but still ignores
cash flow after the cutoff date.
3. Net present value (NPV) is economically sound and properly ranks projects across
various sizes, time horizons, and levels of risk, without exception for all independent
projects.

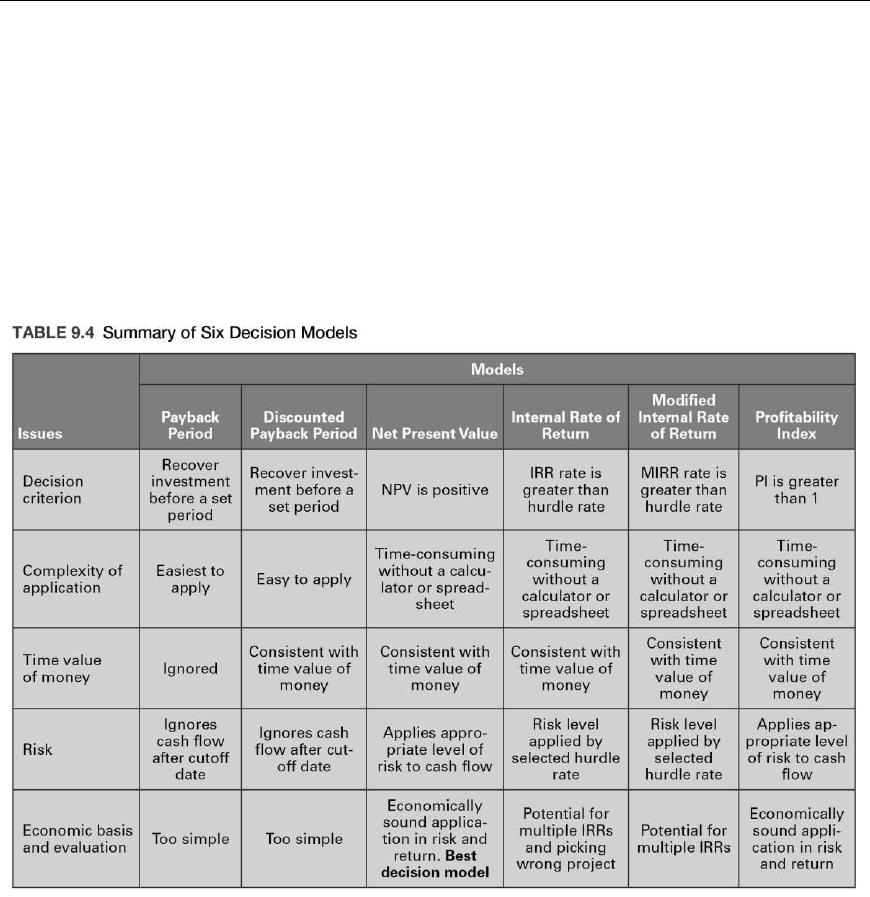
4. Internal rate of return (IRR) provides a single measure (return) but has the potential
for errors in ranking projects. It can also lead to an incorrect selection when there are
two mutually exclusive projects or incorrect acceptance or rejection of a project with
more than a single IRR.
5. Modified internal rate of return (MIRR) in general corrects for most of, but not all,
the problems of IRR and gives the solution in terms of a return. The reinvestment rate
may or may not be appropriate for the future cash flows, however.
6. Profitability index (PI) incorporates risk and return, but the benefits-to-cost ratio is
actually just another way of expressing the NPV.
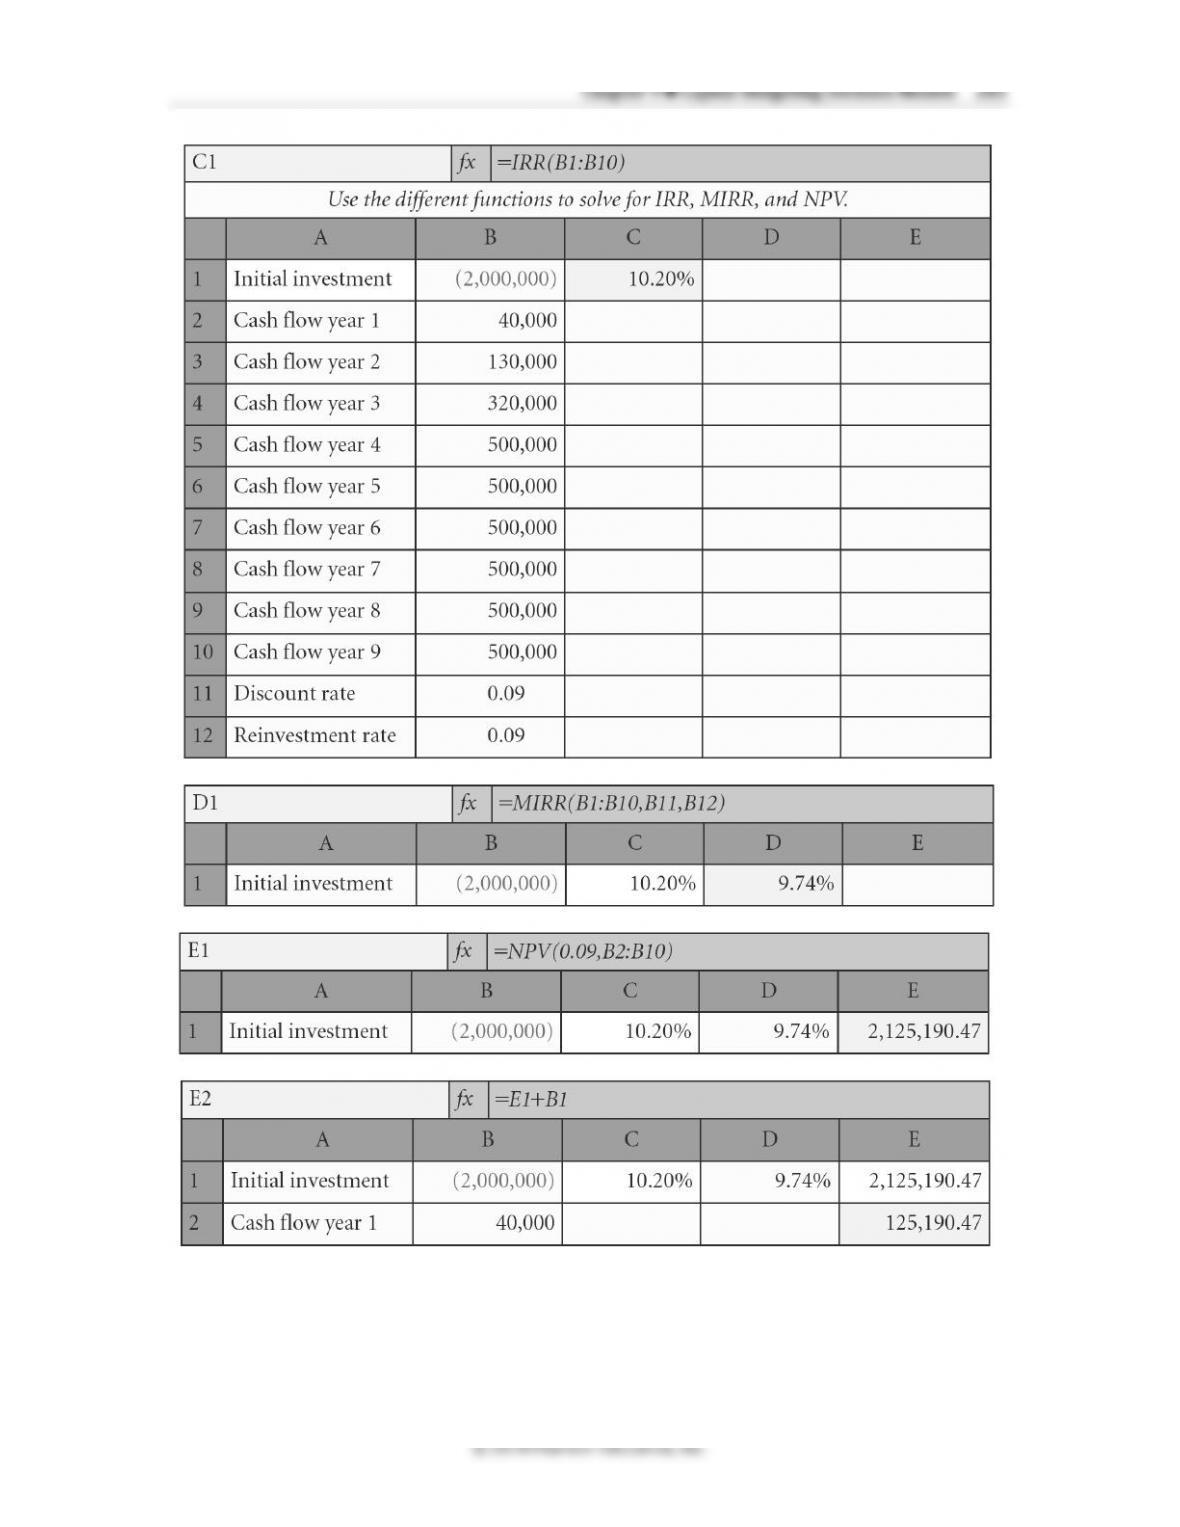
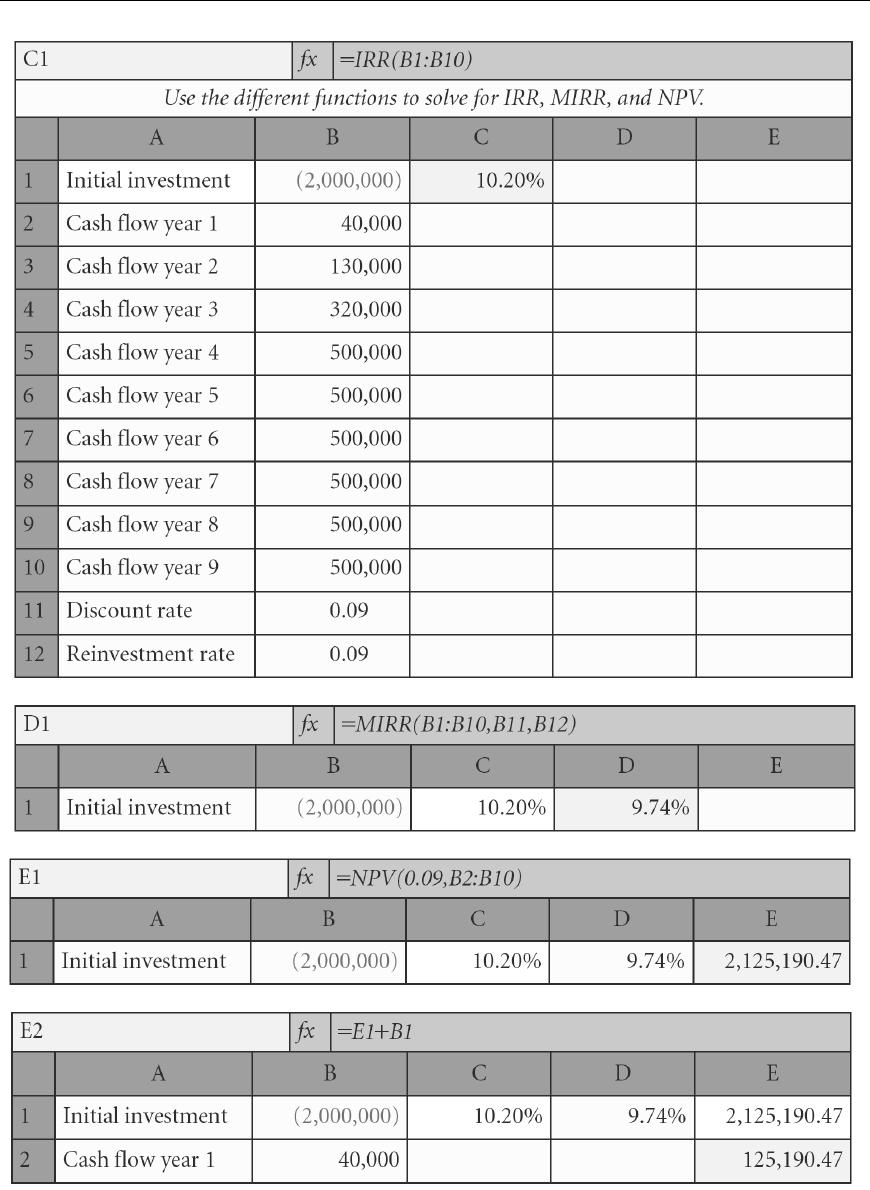
Capital Budgeting Using a Spreadsheet
NPV, MIRR, and IRR can be easily solved once data are entered into a spreadsheet as
shown in the exhibits that follow.
For NPV, we enter the following ➔ NPV(rate, CF1:CFn) + CF0 (Note: The following
exhibit uses 9% as the discount rate to calculate an NPV of $2,125,190.47)


284 Brooks ◼ Financial Management: Core Concepts, 4e
Questions
1. How does a business determine whether a project (new product or service) is
worthwhile?
2. What is the difference between a short-term decision and a long-term decision?
3. What question is the payback period model answering? What are the two major
drawbacks of the payback period? In what situations do businesses still use it?
4. If you switch to the discounted payback period from the payback period, what
assumption are your making about the timing of the cash flow?
5. What drawback of discounted payback period does the net present value
overcome?
6. Why is it straightforward to compare one project’s NPV with that of another
project’s NPV? Why does ranking projects based on the greatest to least NPV
make sound financial sense?
7. Why do different projects have different discount rates in the NPV model?
8. When does the internal rate of return model give an inappropriate decision
when comparing two mutually exclusive projects?
With two mutually exclusive projects, it is possible to select the one with the lowest

9. If you switch from the internal rate of return to the modified internal rate of
return model, what assumption changes with respect to the cash flow of the
project?
10. The profitability index produces a ratio between the present value of the benefits
and present value of the costs of a project. Is there a time when PI and NPV do
not agree on the ranking of projects? If so, under what circumstances would PI
and NPV have different project rankings?
The basic problem with PI is that you cannot scale projects up or down and when
Prepping for Exams
1. a. 6. d.
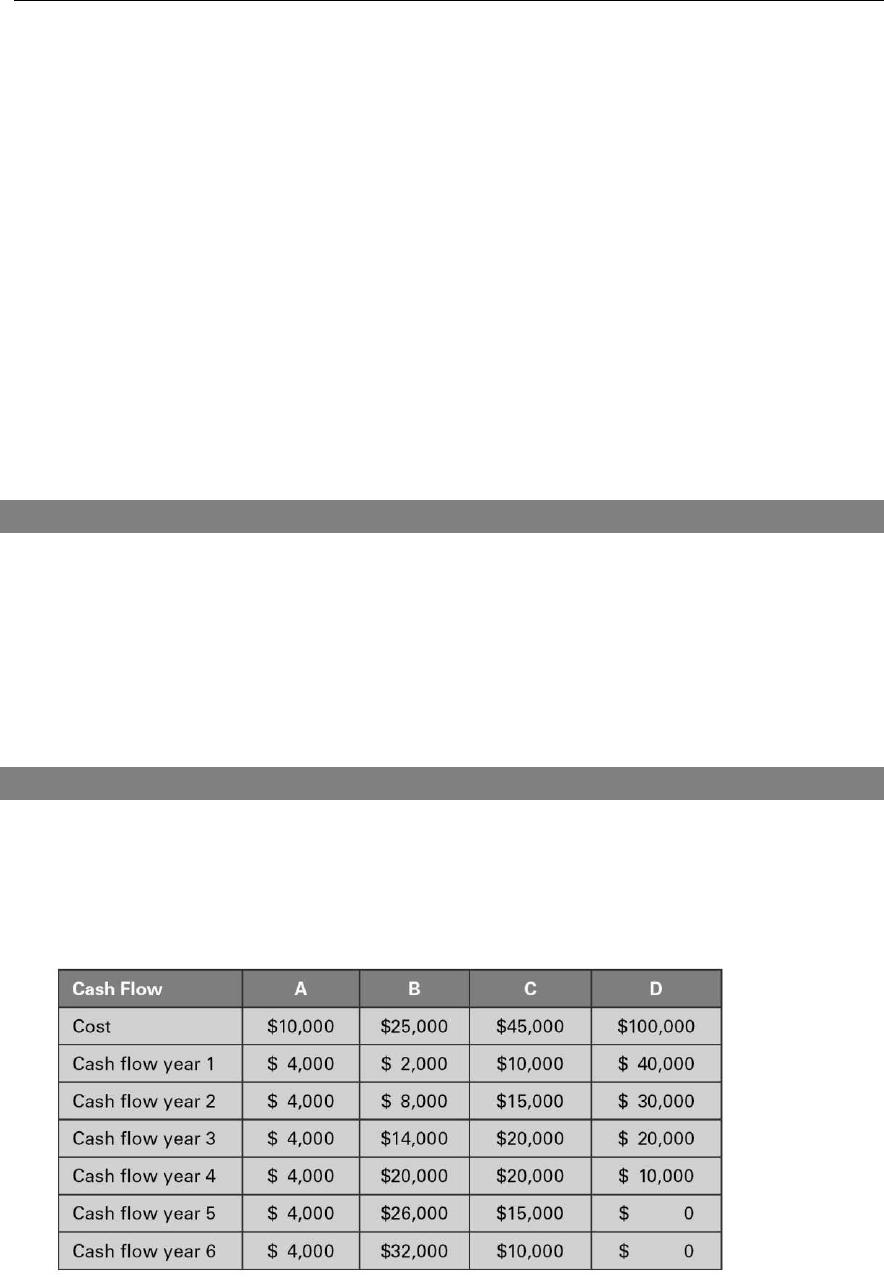
Problems
1. Payback period. Given the cash flows of the four projects—A, B, C, and D—and
using the payback period decision model, which projects do you accept and which
projects do you reject with a three-year cutoff period for recapturing the initial cash
outflow? For payback period calculations, assume that the cash flows are equally
distributed over the year.


286 Brooks ◼ Financial Management: Core Concepts, 4e
ANSWER
Project A:
Project B:
Project C:
Project D:
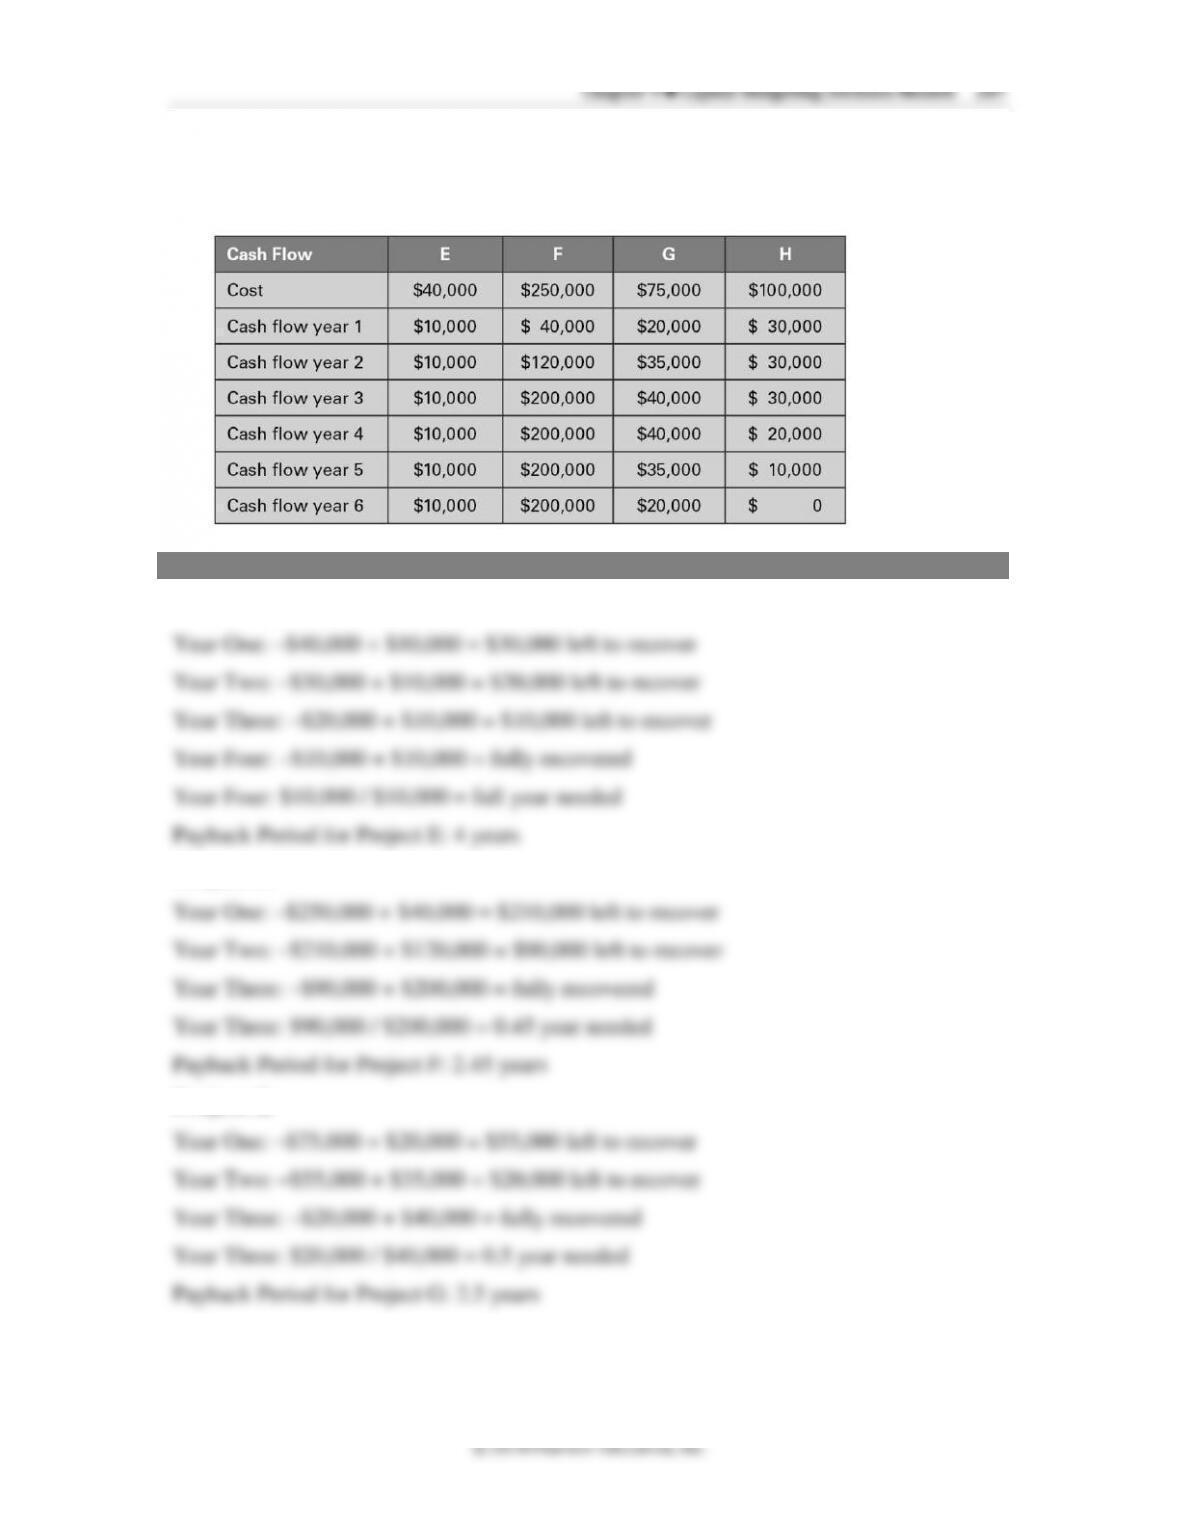
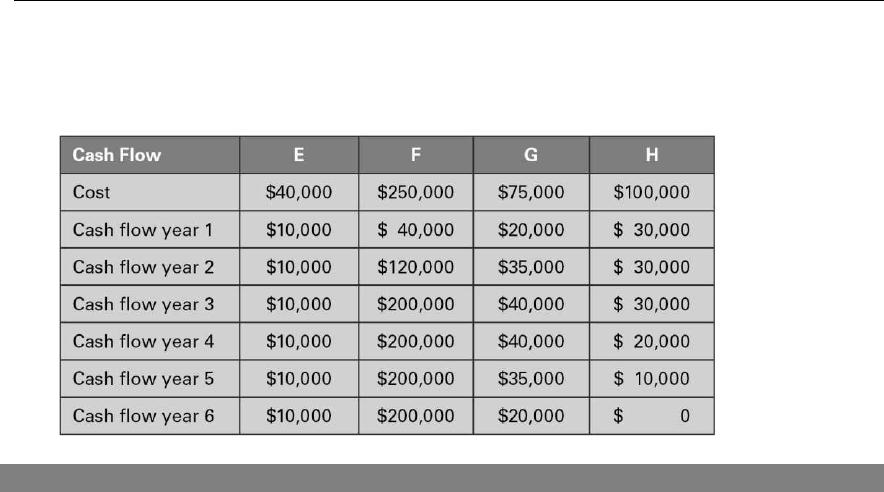
2. Payback period. What are the payback periods of projects E, F, G, and H? Assume all
the cash flows are evenly spread throughout the year. If the cutoff period is three
years, which projects do you accept?
ANSWER
Project E:
Project F:
Project G: