Unlock document.
This document is partially blurred.
Unlock all pages and 1 million more documents.
Get Access
278 Brooks ◼ Financial Management: Core Concepts, 4e
30. Changing risk level. Ms. Chambers wants to change the expected return of her portfolio.
Currently, she has all her money in U.S. Treasury Bills with a return of 3%. She can switch
some of her money into a risky portfolio with an expected return of 15%. What percentage
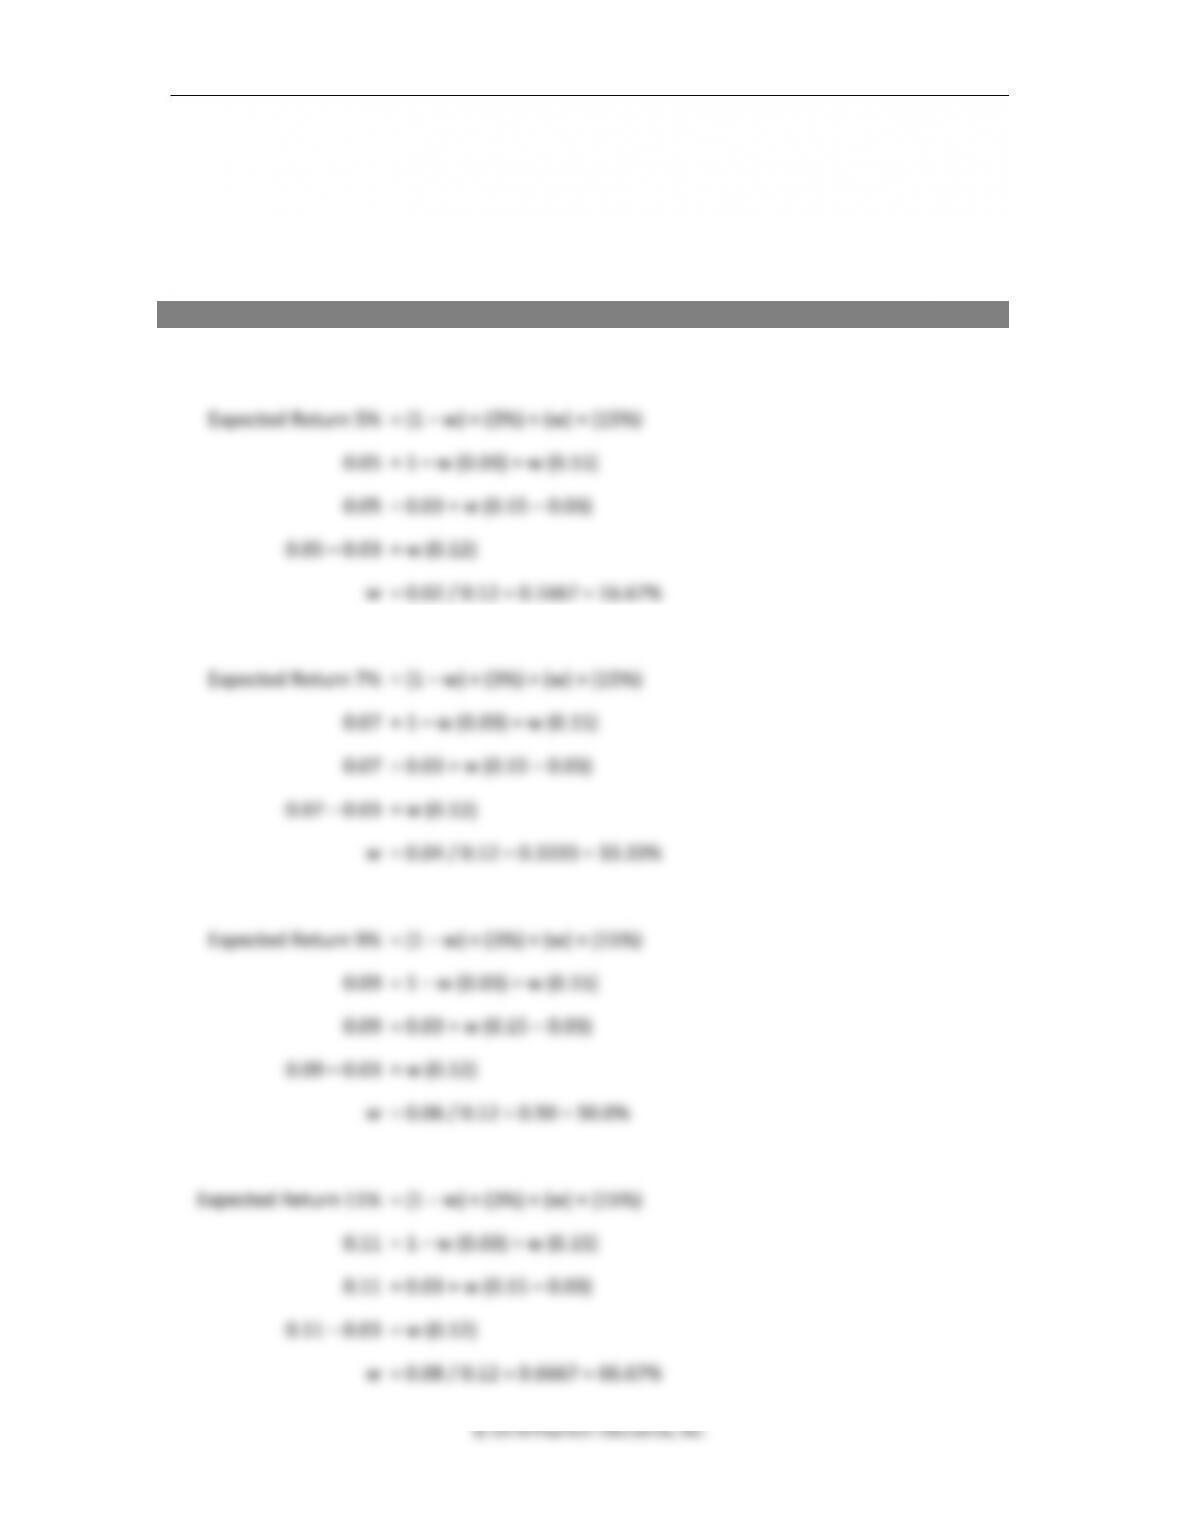
of her wealth will she need to invest in the risky portfolio to get an expected return of 5%?
Of 7%? Of 9%? Of 11%? Of 13%? Of 15%? Is there a pattern here?
ANSWER
The weight in the risk-free asset is 1 – w, and the weight in the risky portfolio is w and the total
of the two reflects 1 or 100% of his wealth.
Thus 1/6 (16.67%) of the wealth is invested in the risky portfolio and 5/6 in the risk-free asset.
Thus 1/3 (33.33%) of the wealth is invested in the risky portfolio and 2/3 in the risk-free asset.
Thus 1/2 (50.0%) of the wealth is invested in the risky portfolio and 1/2 in the risk-free asset.
Chapter 8 ◼ Risk and Return 279
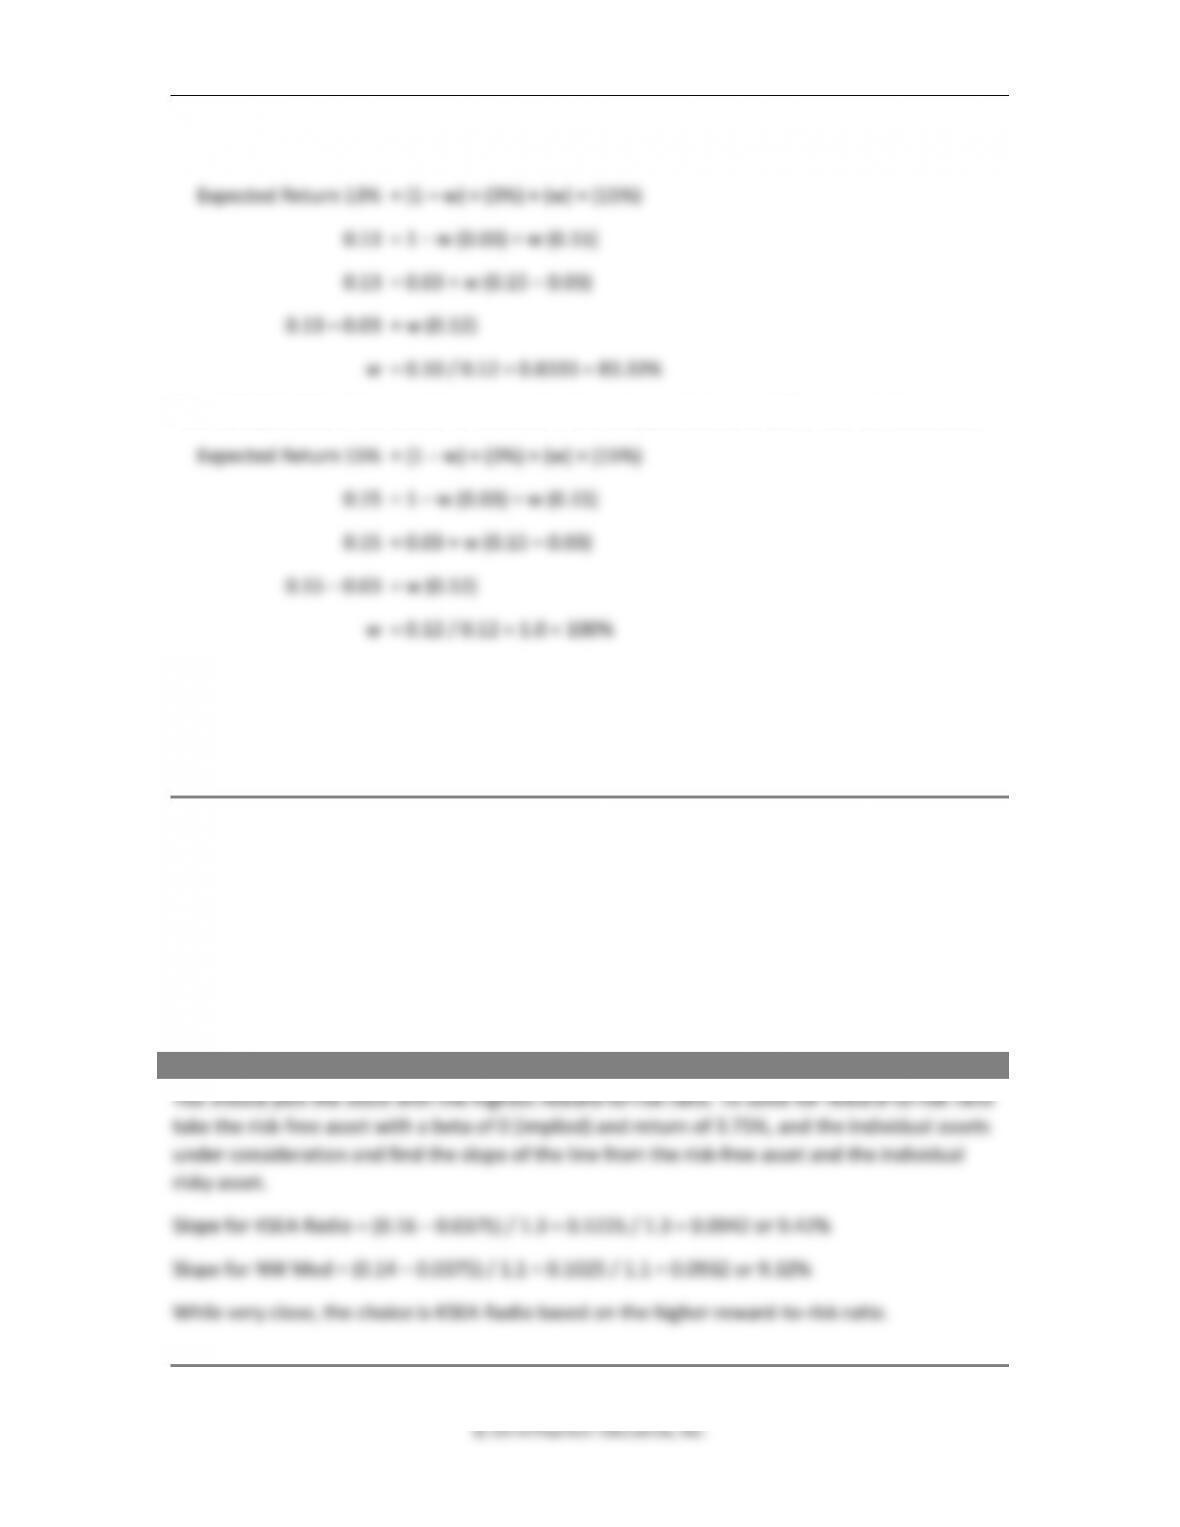
Thus 2/3 (66.67%) of the wealth is invested in the risky portfolio and 1/3 in the risk-free asset.
Thus 5/6 (83.33%) of the wealth is invested in the risky portfolio and 1/6 in the risk-free asset.
Thus all (100%) of the wealth is invested in the risky portfolio and none in the risk-free asset.
The pattern is linear in the change in expected return and the percent invested in the risky
portfolio.
31. Reward-to-risk ratio. The Royal Seattle Investment Club has $100,000 to invest in the equity
market. Frasier advocates investing the funds in KSEA Radio with a beta of 1.3 and an
expected return of 16%. Niles advocates investing the funds in Northwest Medical with a
beta of 1.1 and an expected return of 14%. The club is split 50/50 on the two stocks. You are
the deciding vote, and you cannot pick a split of $50,000 for each stock. Before you vote,
you look up the current risk-free rate (the one-year U.S. Treasury bill with a yield of 3.75%).
Which stock do you select?
ANSWER
Chapter 8 ◼ Risk and Return 283
Solutions to Advanced Problems for Spreadsheet Application
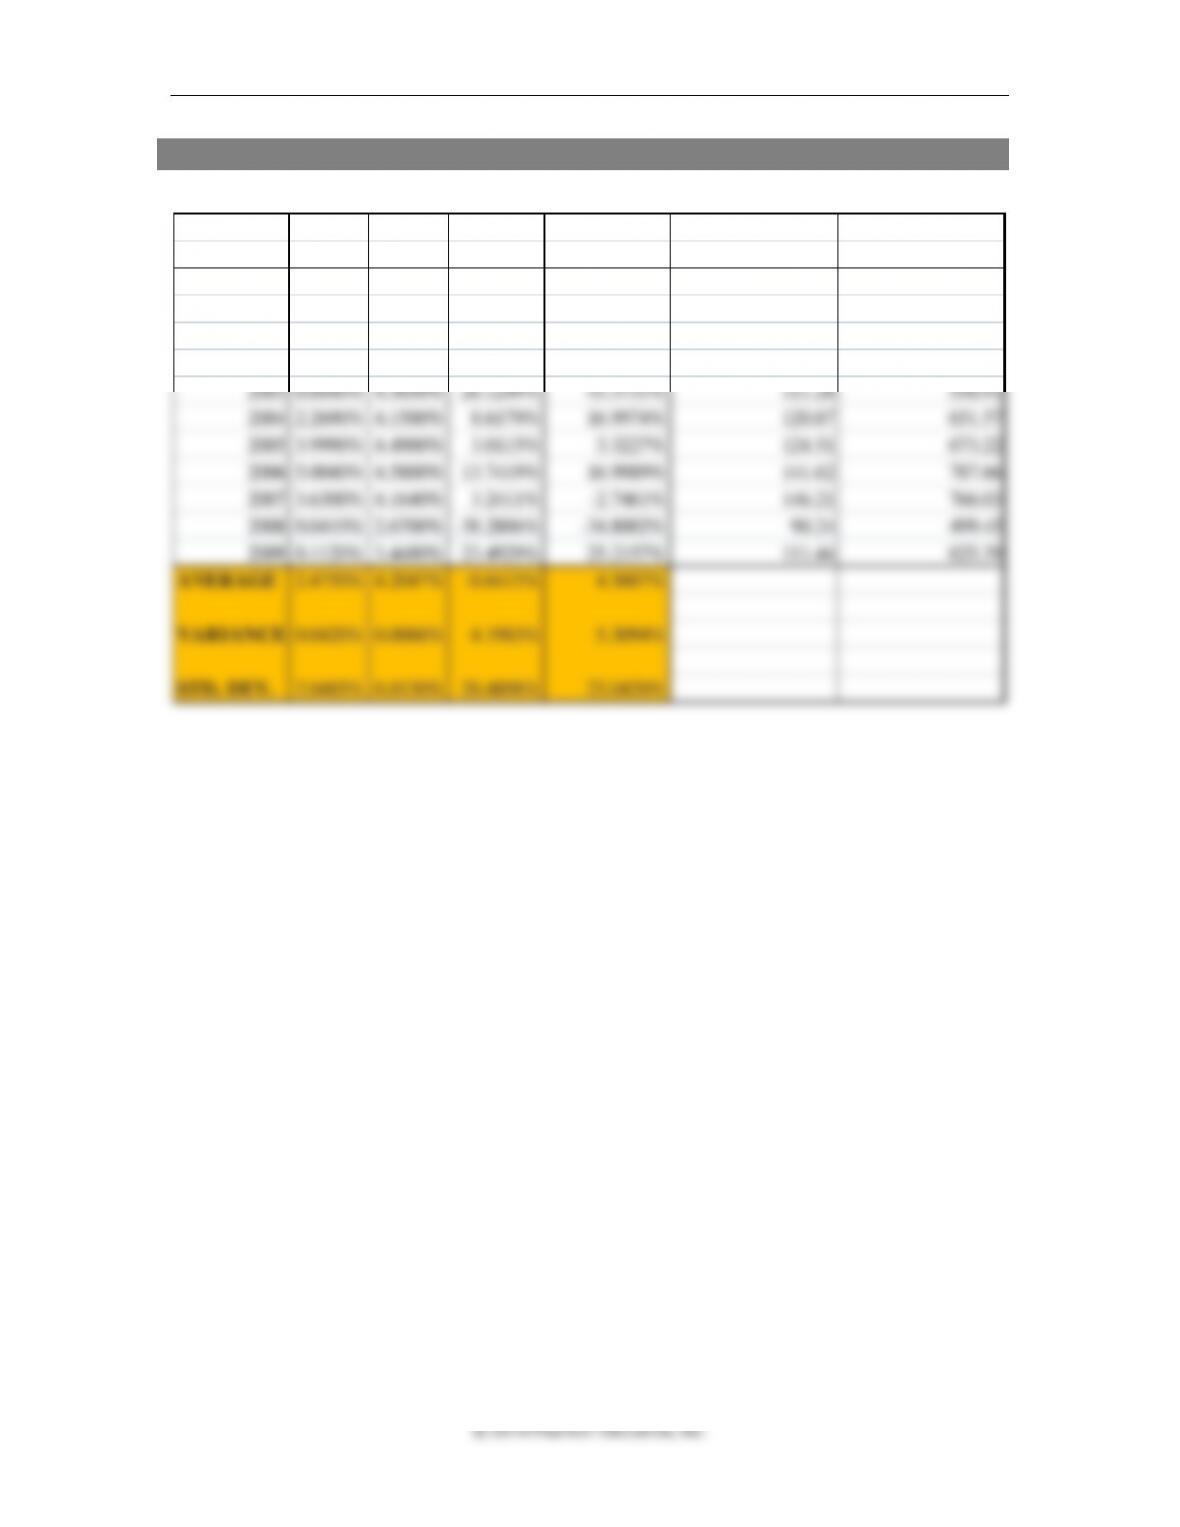
1. Returns and variances in the period 2000-2009
T-Bill T-Note S&P 500 Russe ll 2000 S&P 500 Russe ll 2000
Year Re turn Re turn Re turn Re turn End of Ye ar Price End of Ye ar Price
1999 146.88 504.75
2000 5.8640% 5.8650% -10.6822% -4.2041% 131.19 483.53
2001 1.7400% 4.2200% -12.8745% 1.0279% 114.3 488.5
2002 1.2070% 4.0950% -22.8084% -21.5783% 88.23 383.09
2003 0.8840% 4.3650% 26.1249% 45.3731% 111.28 556.91
2004 2.2690% 4.1500% 8.6179% 16.9974% 120.87 651.57
2005 3.9990% 4.4900% 3.0115% 3.3227% 124.51 673.22
2006 5.0040% 4.5800% 13.7419% 16.9989% 141.62 787.66
2007 3.6300% 4.1640% 3.2411% -2.7461% 146.21 766.03
2008 0.0410% 2.6700% -38.2806% -34.8002% 90.24 499.45
2009 0.1120% 3.4480% 23.4929% 25.2157% 111.44 625.39
AVERAGE 2.4750% 4.2047% -0.6415% 4.5607%
VARIANCE 0.0420% 0.0066% 4.1983% 5.3094%
STD. DEV. 2.0485% 0.8130% 20.4898% 23.0420%
Chapter 8 ◼ Risk and Return 285
© 2016 Pearson Education, Inc.
Given the purpose of the portfolio, to fund annual grants, it is convenient to think in terms
of a one-year holding period return, which includes both distributions and capital gains or
losses. If the portfolio gains $100,000, the dollar HPR is $130,000, the percentage HPR is
($30,000 + $100,000)/$1,000,000 = 13%.
286 Brooks ◼ Financial Management: Core Concepts, 4e
© 2018 Pearson Education, Inc.
If it loses $100,000, the dollar HPR is (–$100,000 + $30,000) = $(70,000), the percentage HPR
is:
$(70,000)/$1,000,000 = –7%.
With a one-year holding period, HPR, APR, and EAR are all the same.
The amount of the grants will be either $1,130,000 × 0.05 = $56,500, leaving $1,073,500 or
$930,000 × 0.05 = $46,500, leaving $883,500.
To illustrate how to compute annualized returns (EAR) over a longer period, we can look at
how Lawrence did on his investment in Google.
2. How can we assess the risk of an individual stock?
In financial terms, an investment is risky if the outcome is uncertain and some possible
outcomes are unfavorable. We can understand this better by looking at some examples.
a. Kraska will first address this question by looking at recent returns on Amazon.com and
on Coca-Cola. Compute the mean and standard deviation for each and explain what
they mean. He has collected the following data:
Year
AMAZON
COKE
2007
134.77%
33.35%
2006
–16.31%
26.35%
2005
6.46%
2.24%
2004
–15.83%
13.93%
2003
178.56%
21.94%
The average return is the sum of the returns shown above divided by 5.
Chapter 8 ◼ Risk and Return 287
It is obvious that the average return on Amazon.com has been much higher, but that
288 Brooks ◼ Financial Management: Core Concepts, 4e
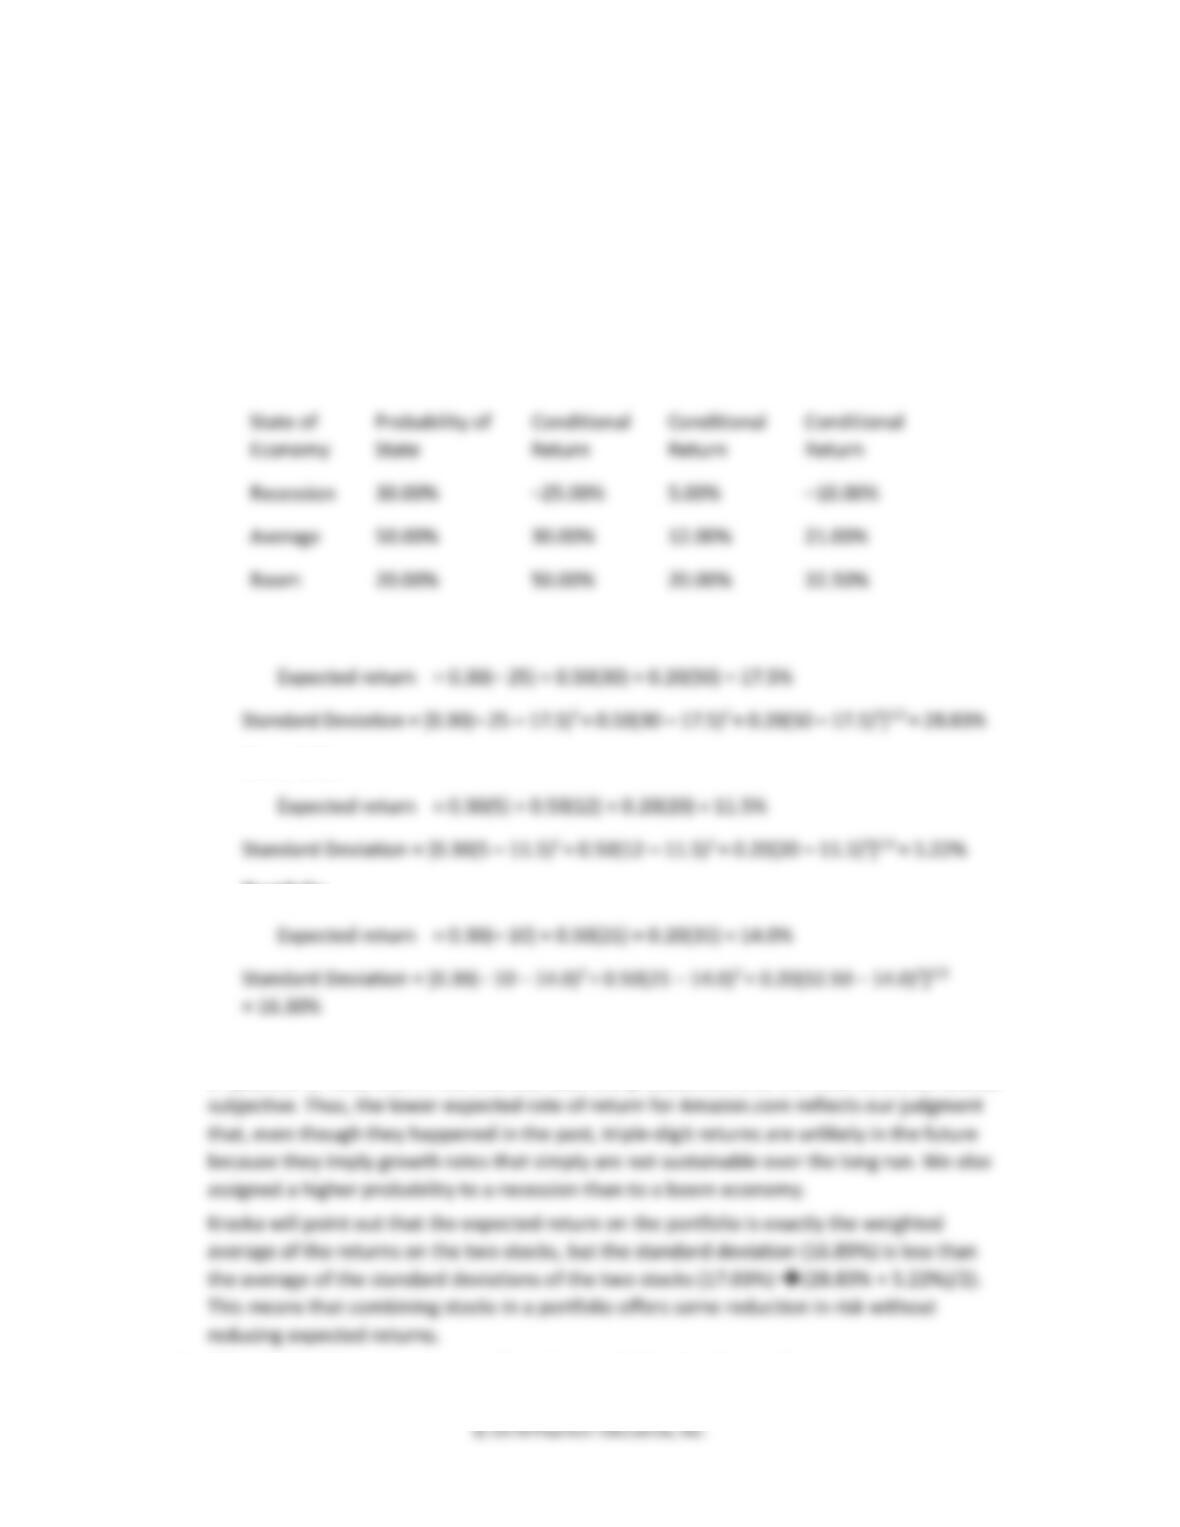
b. Kraska will also suggest that is good to assess risk by looking forward to how we
expect stocks to react to a particular set of circumstances or states of nature. Use the
following set of assumptions for the coming year to compute the expected rate of
return and standard deviation for Amazon.com, Coca-Cola, and a portfolio with equal
dollar amounts invested in Amazon.com and Coca-Cola. Explain briefly what they
mean.
Amazon.com
Coca-Cola
50/50
Portfolio
State of
Economy
Probability of
State
Conditional
Return
Conditional
Return
Conditional
Return
Recession
30.00%
–25.00%
5.00%
–10.00%
Average
50.00%
30.00%
12.00%
21.00%
Boom
20.00%
50.00%
20.00%
32.50%
Amazon.com
Coca-Cola
Portfolio
The mean and standard deviation can be interpreted in the same way as for the sample data
in question a. Note that in this exercise both the probabilities and the returns are somewhat
3. What kinds of investments are safe and earn a high rate of return?
Chapter 8 ◼ Risk and Return 289
© 2016 Pearson Education, Inc.
Kraska responds that unfortunately there is no such thing. If there were, everyone would
want to buy it, demand would drive the price up, and returns would soon drop to expected
rates.
4. Google seems to be a great company. Why did Lawrence require the town to sell the
Google stocks and reinvest the money in a diversified portfolio?
Lawrence was reluctant to sell Google because taxes on his profits would have reduced the
Chapter 8 ◼ Risk and Return 291
© 2016 Pearson Education, Inc.
The beta of a portfolio is just the weighted average of the betas of the stocks in the
portfolio, so
Stock
Weight
Beta
Weight × Beta
Amazon.com
20/105
3.02
0.58
Coca-Cola
50/105
0.62
0.30
Merck Pharmaceuticals
35/105
1.11
0.37
Portfolio beta
1.24
Kraska would attempt to keep the portfolio beta close to 1.
Additional Problems with Solutions
1. Comparing HPRs, APRs and EARs. Two years ago, Jim bought 100 shares of IBM stock at $50
per share and just sold them for $65 per share after receiving dividends worth $3 per share
over the two-year holding period. Mary, bought 5 ounces of gold at $800 per ounce, three
months ago and just sold it for $1,000 per ounce. Calculate each investor’s HPR, APR, and
EAR and comment on your findings.
ANSWER (Slides 8-61 to 8-63)
Jim’s holding period (n) = 2 years
Chapter 8 ◼ Risk and Return 293
© 2016 Pearson Education, Inc.
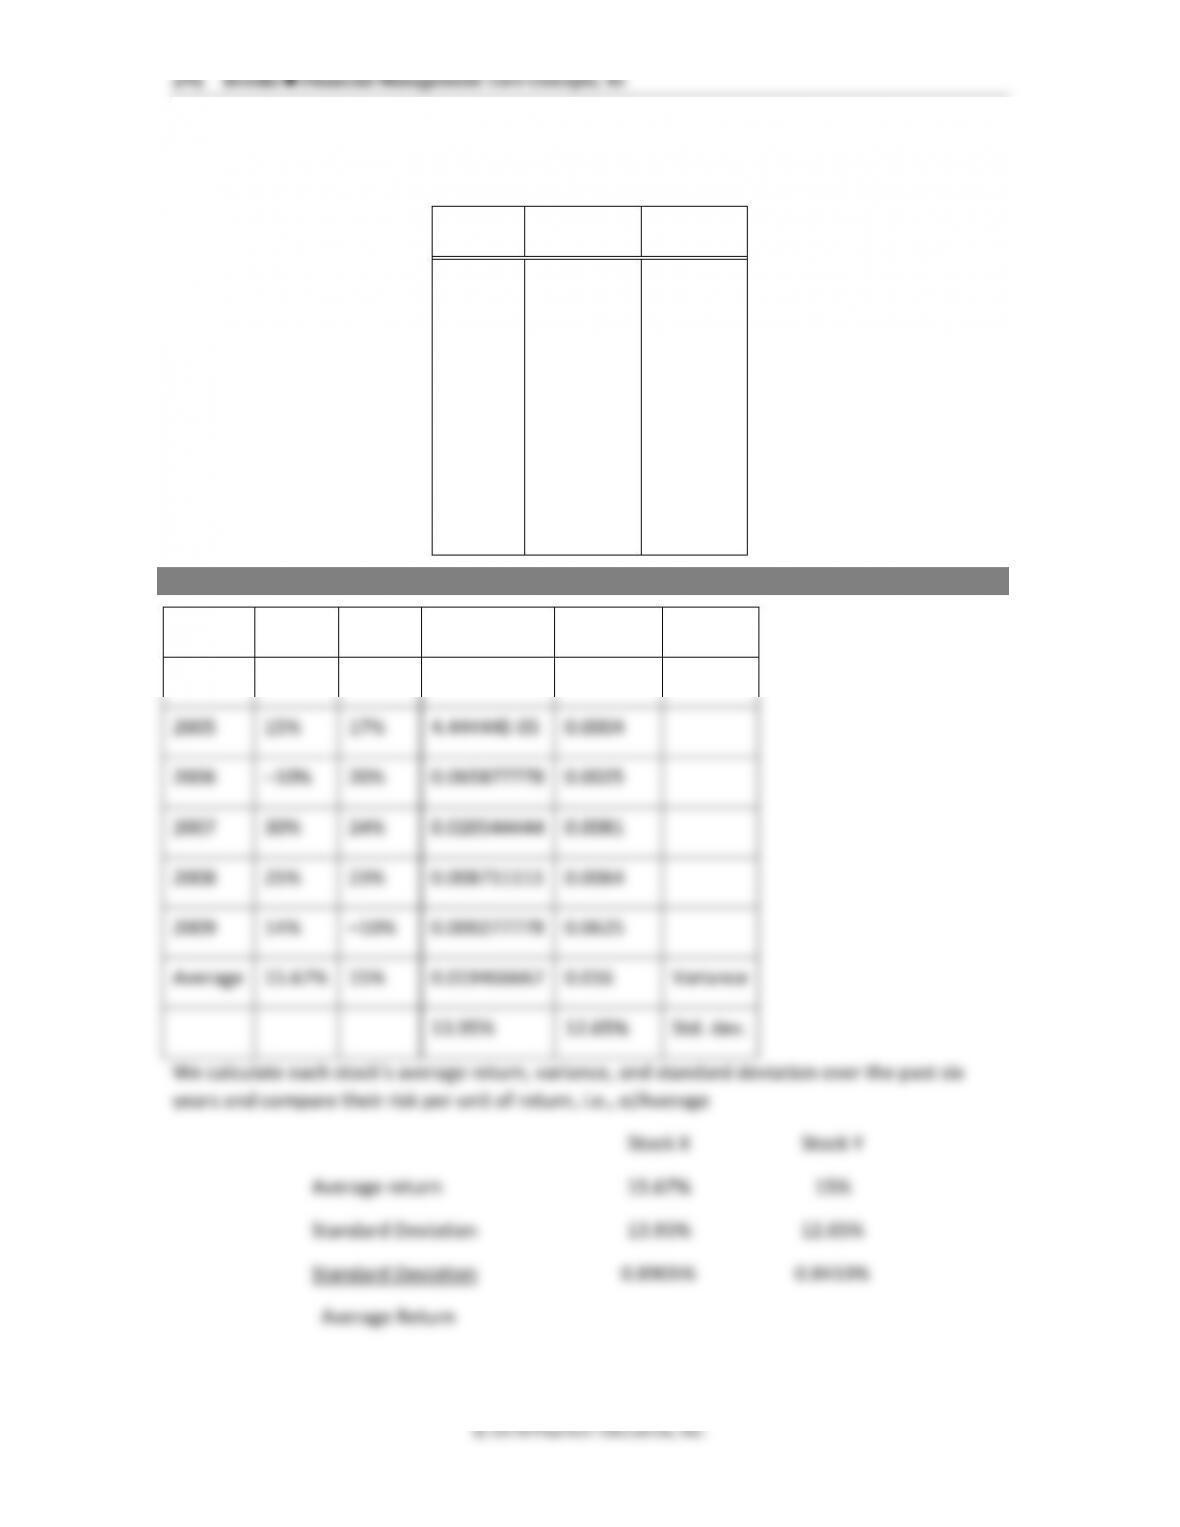
Stock X was riskier than stock Y because it had the higher standard deviation of the two, and its
average return was not much higher than Stock Y’s average return resulting in 0.8905% risk per
unit of return versus Stock Y’s 0.843% risk per unit of return.
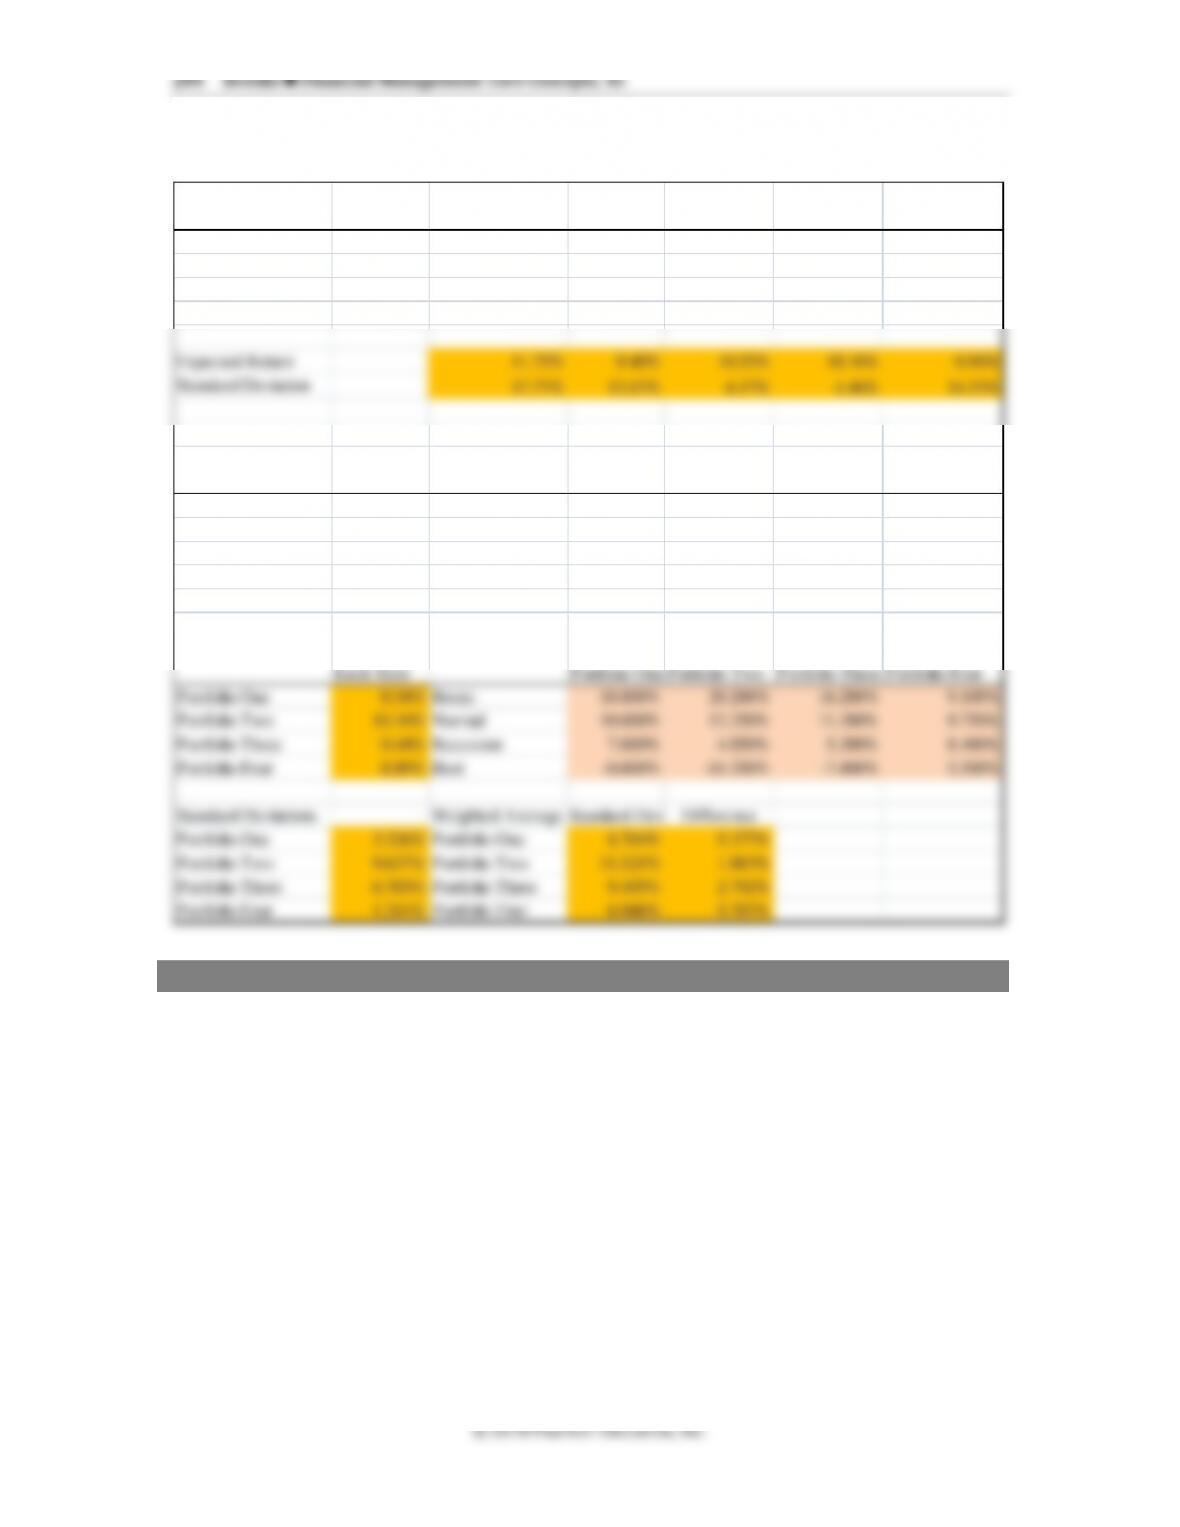
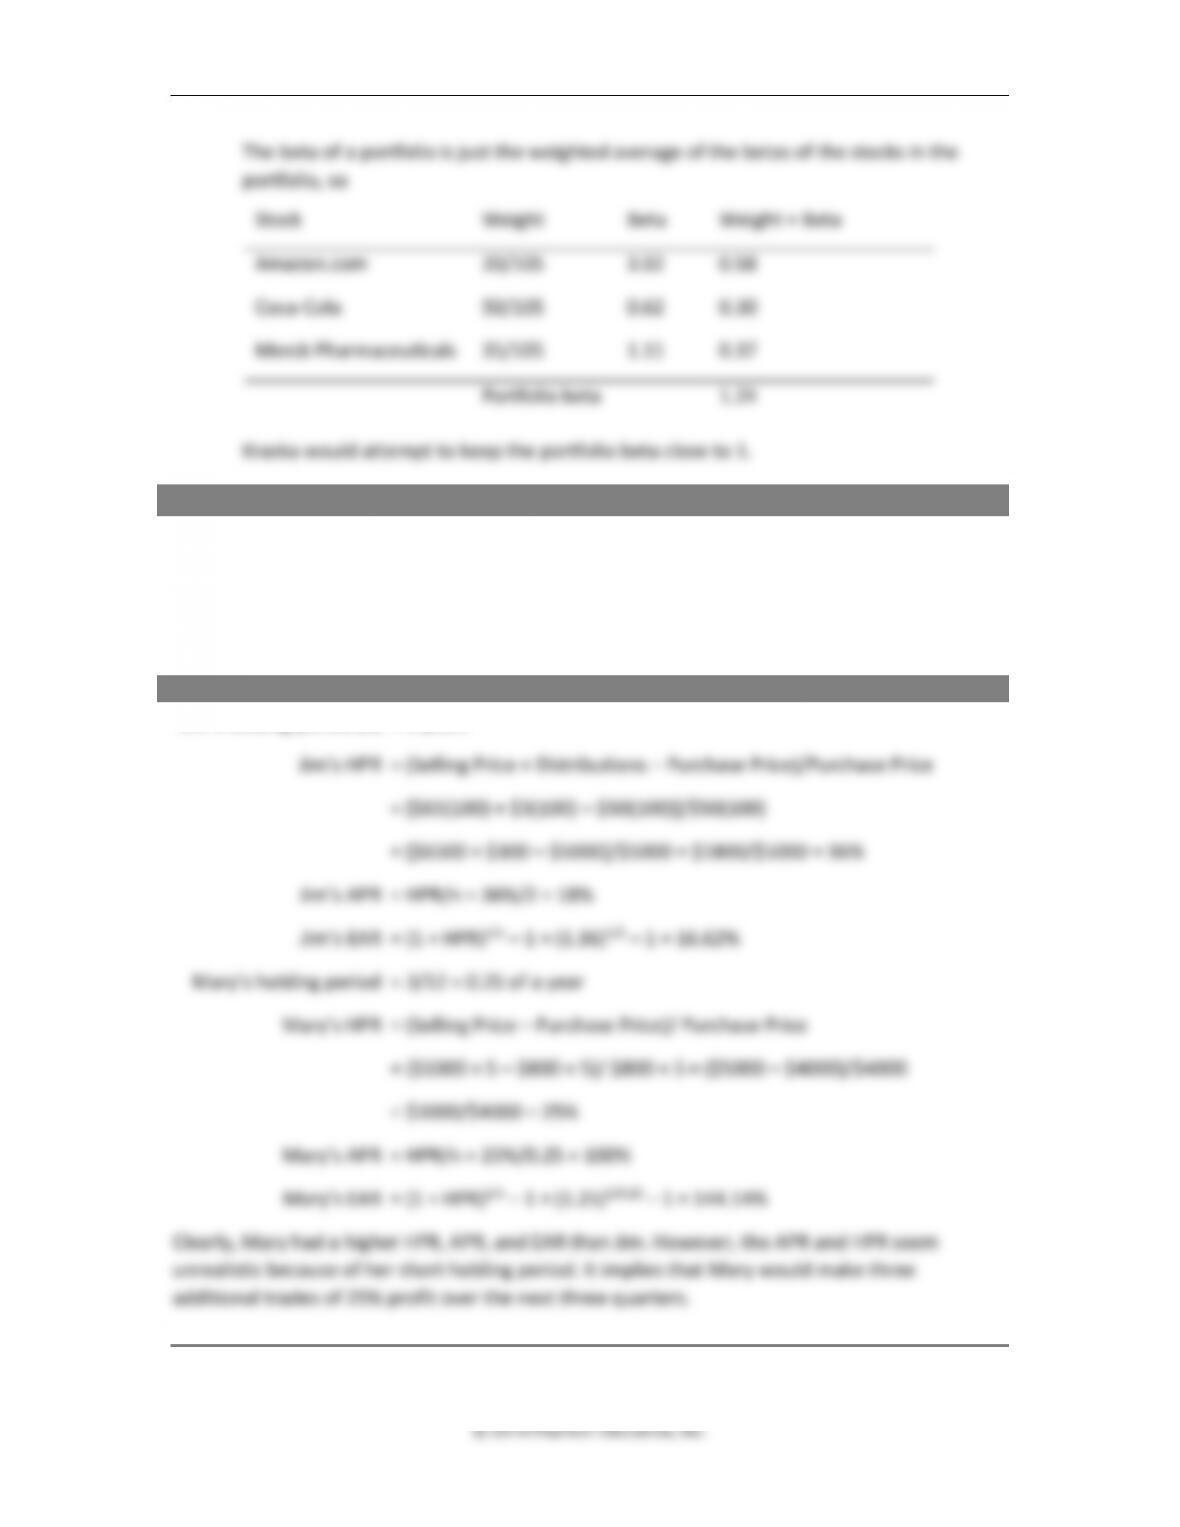
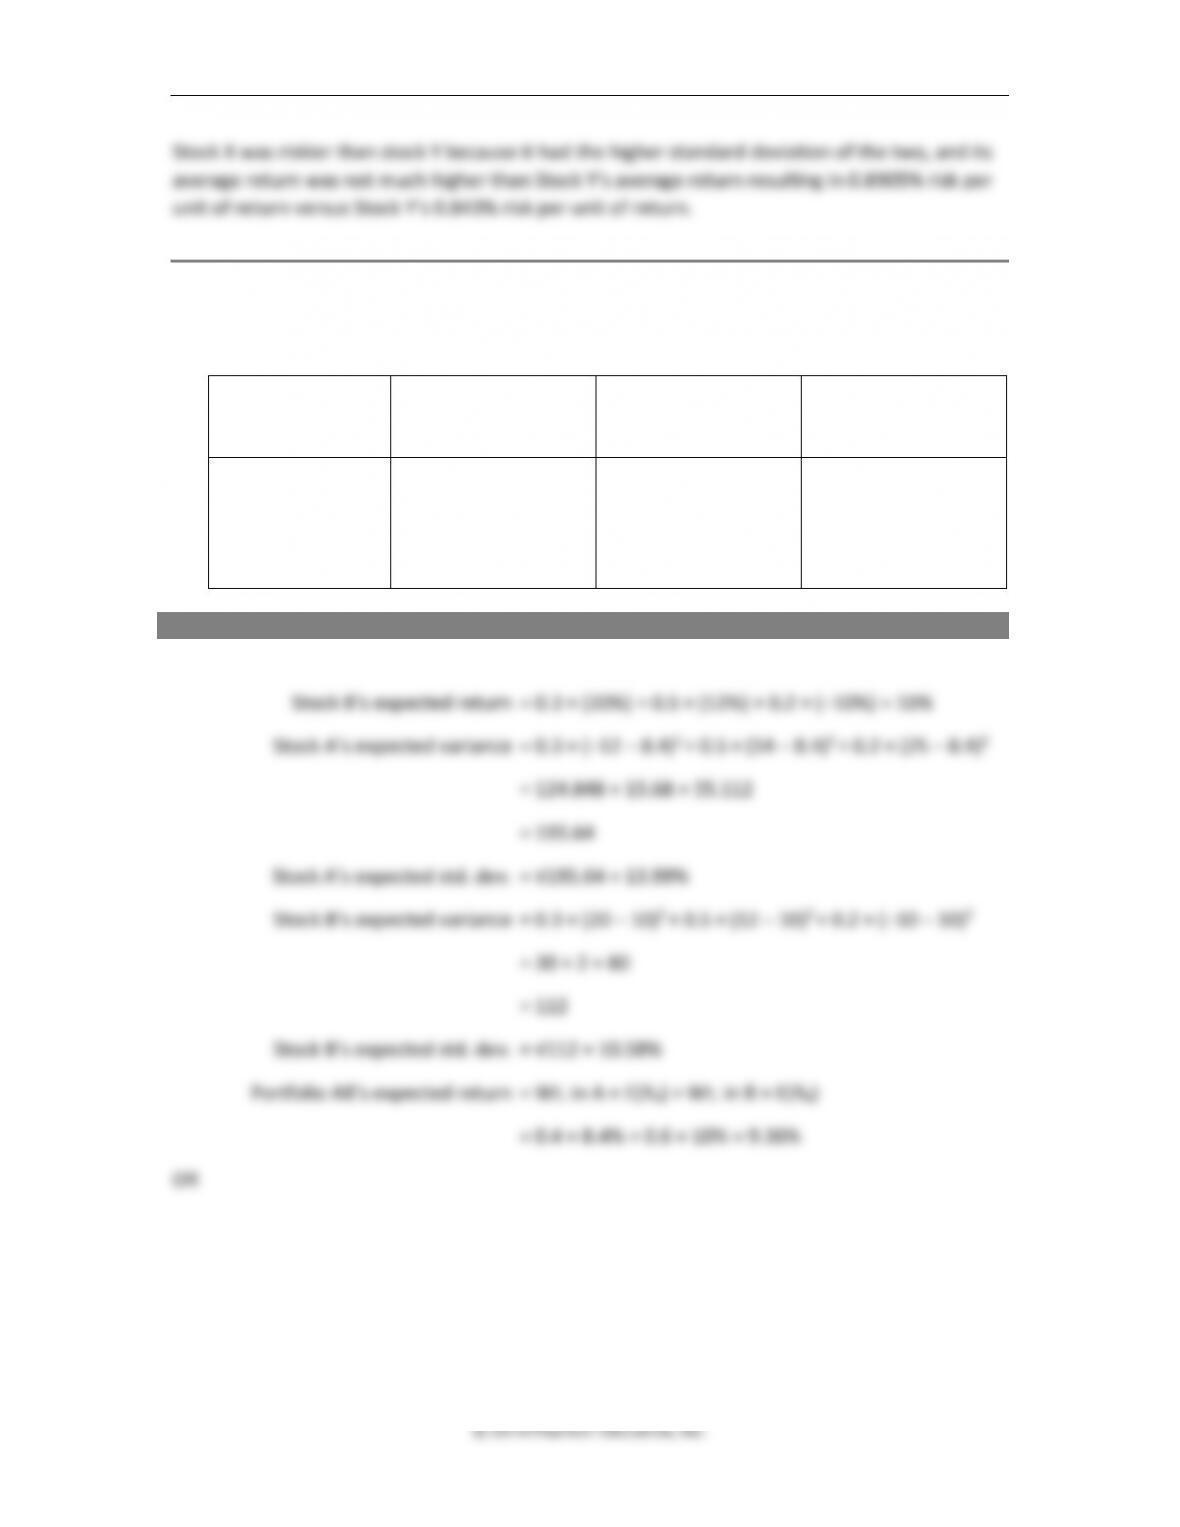
3. Calculating ex-ante risk and return measures. Using the probability distribution shown
below, calculate the expected risk and return estimates of each stock and of a portfolio
comprised of 40% of stock A and 60% of stock B.
State of Economy
Probability of State
occurring
Stock A's Conditional
return
Stock B's Conditional
return
Recession
0.3
–12%
20%
Normal
0.5
14%
12%
Boom
0.2
25%
–10%
ANSWER (Slides 8-67 to 8-69)
Stock A’s expected return = 0.3 × (–12%) + 0.5 × (14%) + 0.2 × (25%) = 8.4%
294 Brooks ◼ Financial Management: Core Concepts, 4e
© 2018 Pearson Education, Inc.
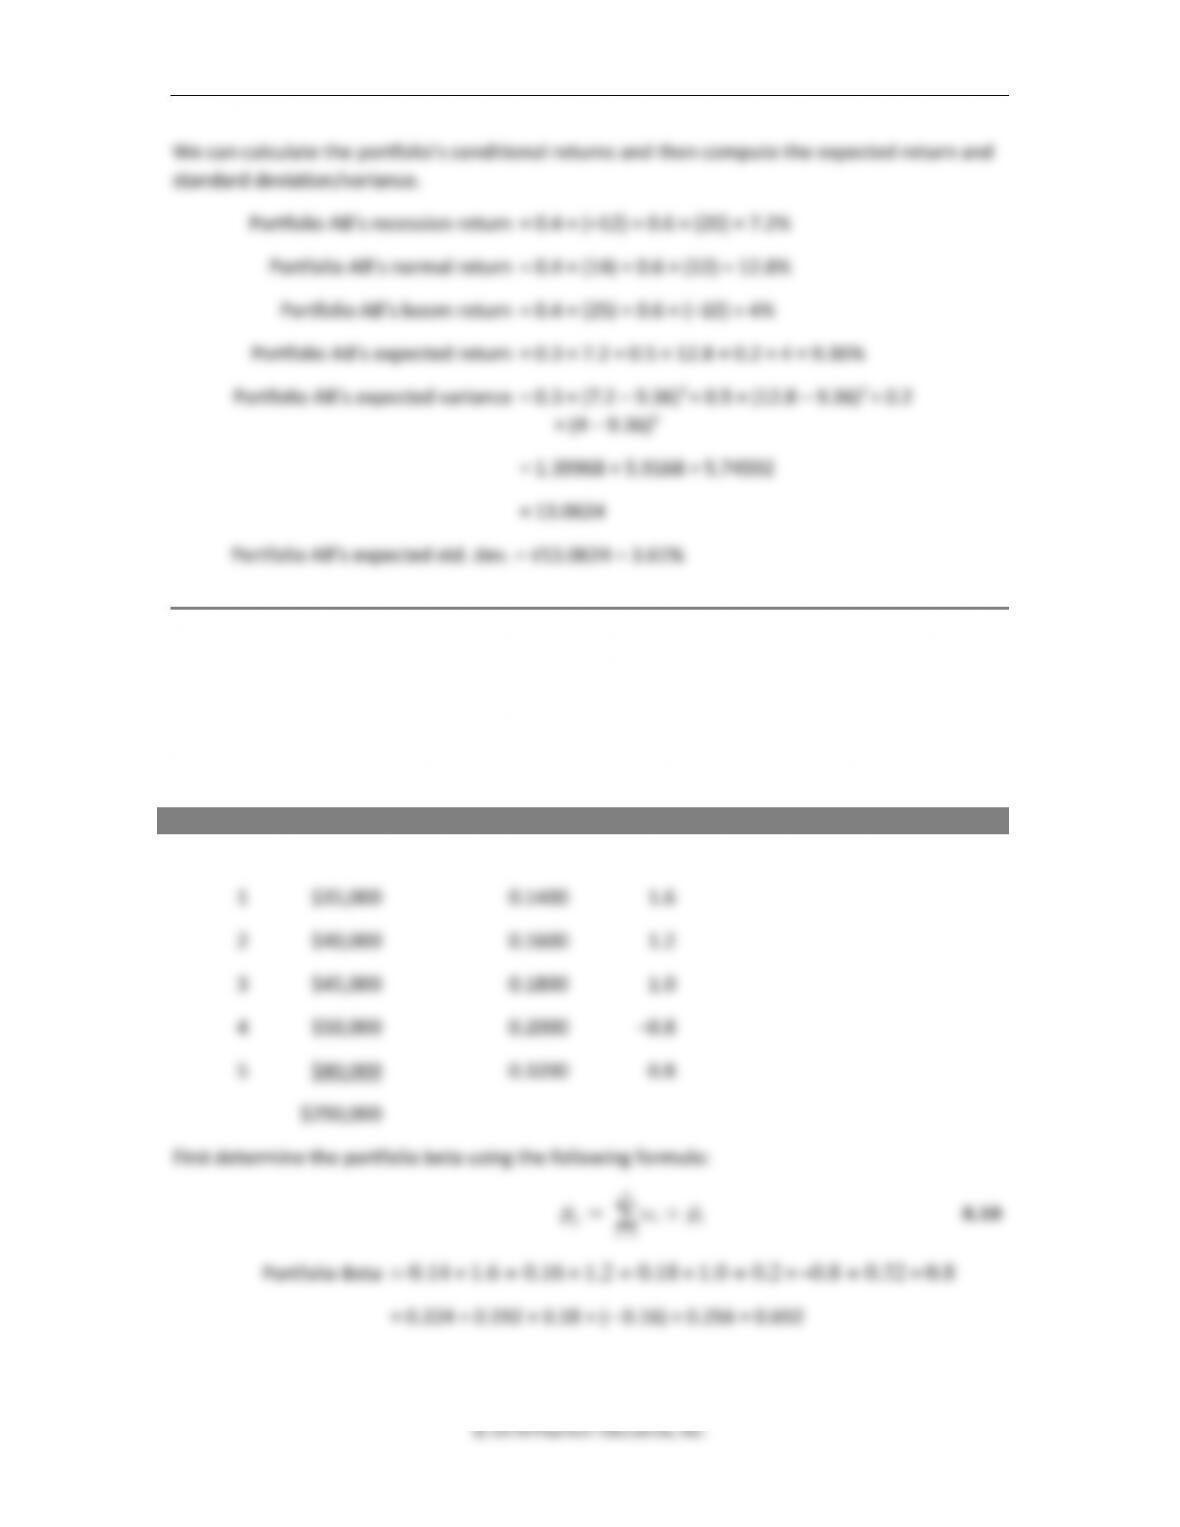
We can calculate the portfolio’s conditional returns and then compute the expected return and
standard deviation/variance.
Portfolio AB’s recession return = 0.4 × (–12) + 0.6 × (20) = 7.2%
Portfolio AB’s normal return = 0.4 × (14) + 0.6 × (12) = 12.8%
Portfolio AB’s boom return = 0.4 × (25) + 0.6 × (–10) = 4%
Portfolio AB’s expected return = 0.3 × 7.2 + 0.5 × 12.8 + 0.2 × 4 = 9.36%
Portfolio AB’s expected variance = 0.3 × (7.2 – 9.36)2 + 0.5 × (12.8 – 9.36)2 + 0.2
× (4 – 9.36)2
= 1.39968 + 5.9168 + 5.74592
= 13.0624
Portfolio AB’s expected std. dev. = √13.0624 = 3.61%
4. Calculate a portfolio’s expected rate of return using the CAPM. Annie is curious to know
what her portfolio’s CAPM-based expected rate of return should be. After doing some
research she figures out the market values and betas of each of her five stocks (shown
below) and is told by her consultant that the risk-free rate is 3% and the market risk
premium is 8%. Help Annie calculate her portfolio’s expected rate of return.
ANSWER (Slides 8-70 to 8-72)
Stock Value Weight Beta
Chapter 8 ◼ Risk and Return 295
© 2016 Pearson Education, Inc.
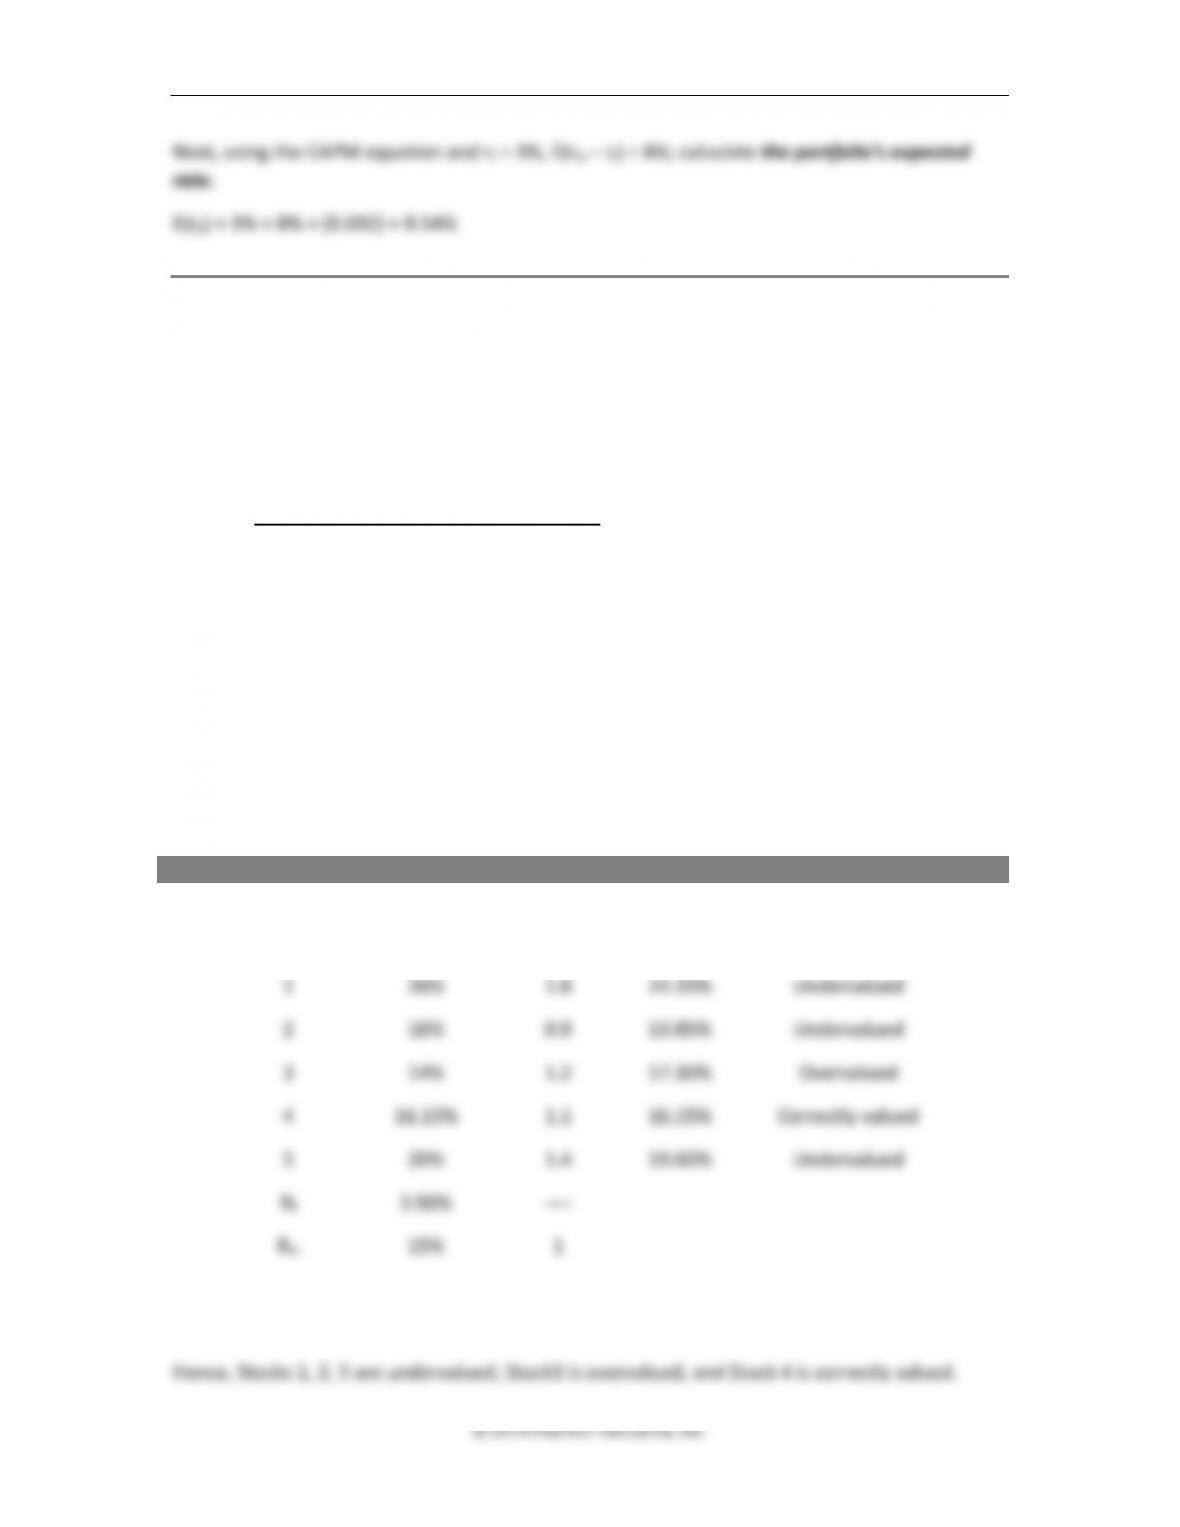
Next, using the CAPM equation and rf = 3%, E(rm – rf) = 8%; calculate the portfolio’s expected
rate.
E(rp) = 3% + 8% × (0.692) = 8.54%
5. Applying the CAPM to determine market attractiveness.
a. Annie is curious to know whether the following five stocks are appropriately valued in
the market. Accordingly, she creates a table (shown below) listing the betas of each
stock along with their ex-ante expected return values that have been calculated using a
probability distribution. She also lists the current risk-free rate and the expected rate of
return on the broad market index. Help her out and state your steps.
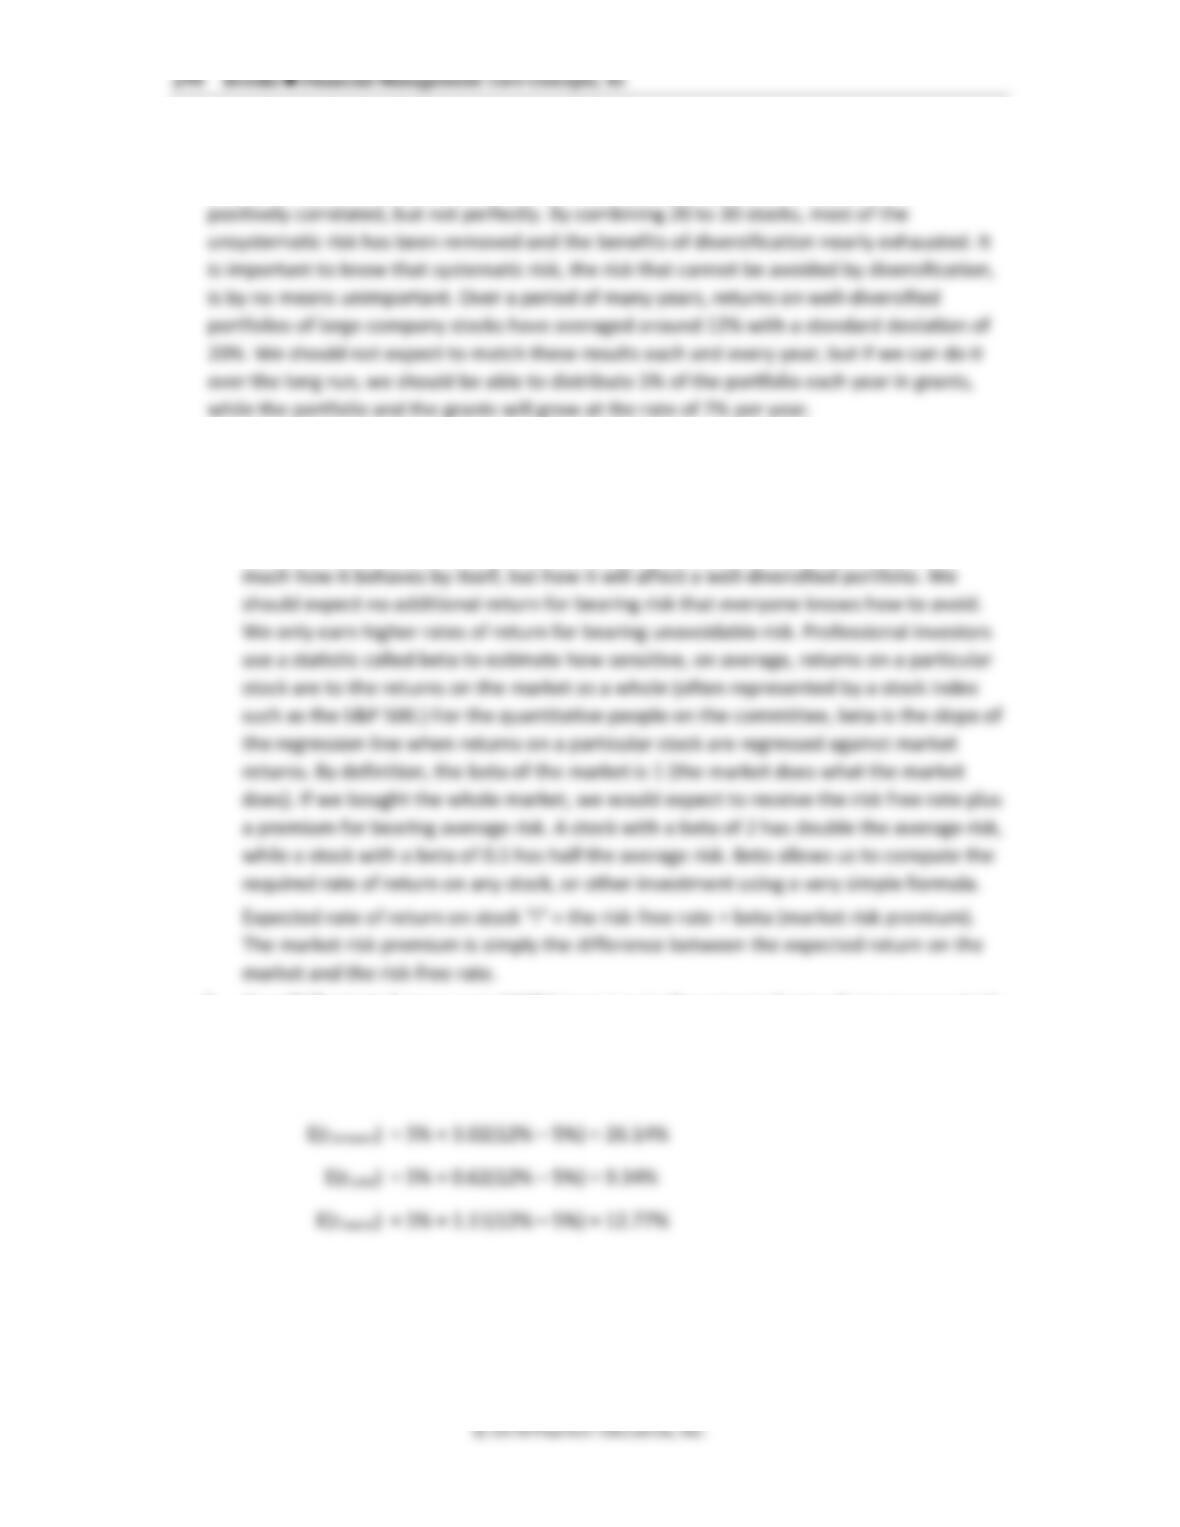
Stock Expected Return Beta
1 26.00% 1.8
2 16.00% 0.9
3 14.00% 1.2
4 16.15% 1.1
5 20.00% 1.4
Rf 3.50% ----
Rm 15.00% 1.0
ANSWER (a) (Slides 8-73 to 8-76)
Step 1. Using the CAPM equation, calculate the risk-based return of each stock.
Stock
Expected Return
Beta
CAPM E(Ri)
Comment
1
26%
1.8
24.20%
Undervalued
2
16%
0.9
13.85%
Undervalued
3
14%
1.2
17.30%
Overvalued
4
16.15%
1.1
16.15%
Correctly valued
5
20%
1.4
19.60%
Undervalued
Rf
3.50%
----
Rm
15%
1
Step 2. If CAPM-based E(R) is less than the ex-ante return listed, the stock is undervalued, i.e., it
is expected to earn a higher rate than it should, based on its beta.
296 Brooks ◼ Financial Management: Core Concepts, 4e
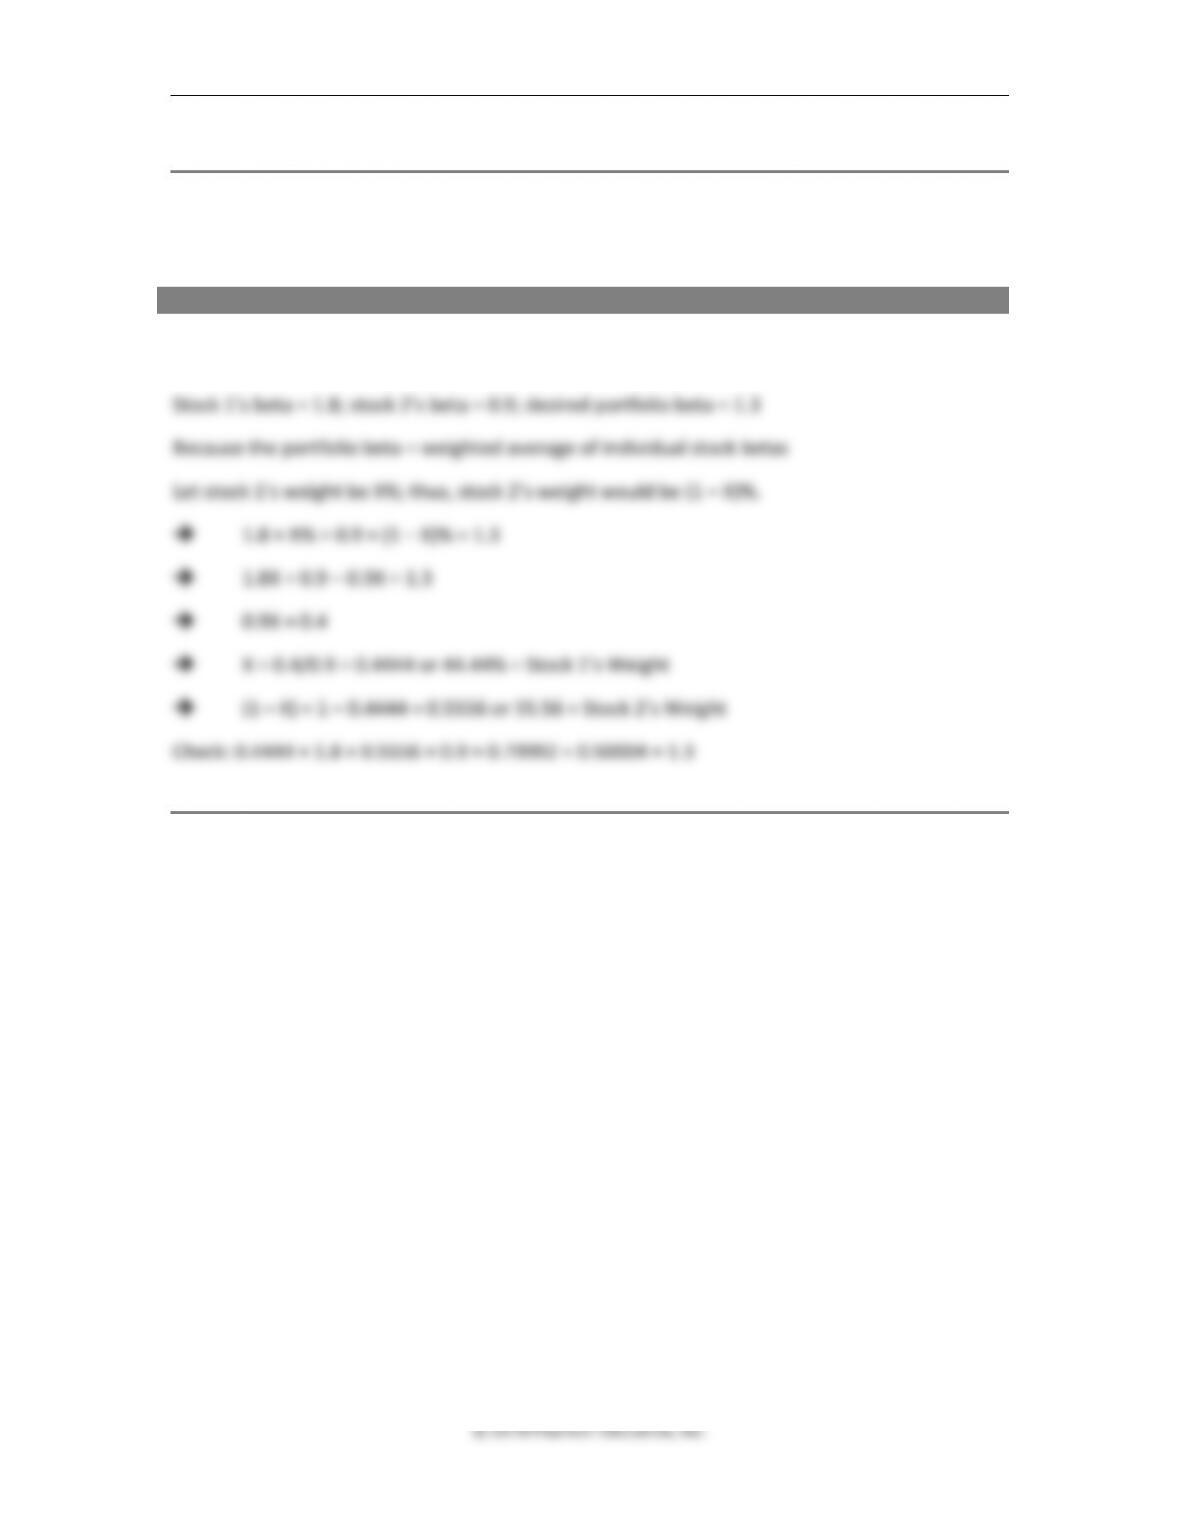
b. If Annie wants to form a two-stock portfolio of the most undervalued stocks with a beta
of 1.3, how much will she have to weight each of the stocks by?
ANSWER (b)
Based on the results in (a), stocks 1 and 2 are most undervalued and would be chosen by Annie
to form the two-stock portfolio with a beta = 1.3.


