Unlock document.
This document is partially blurred.
Unlock all pages and 1 million more documents.
Get Access
Chapter 8 ◼ Risk and Return 259
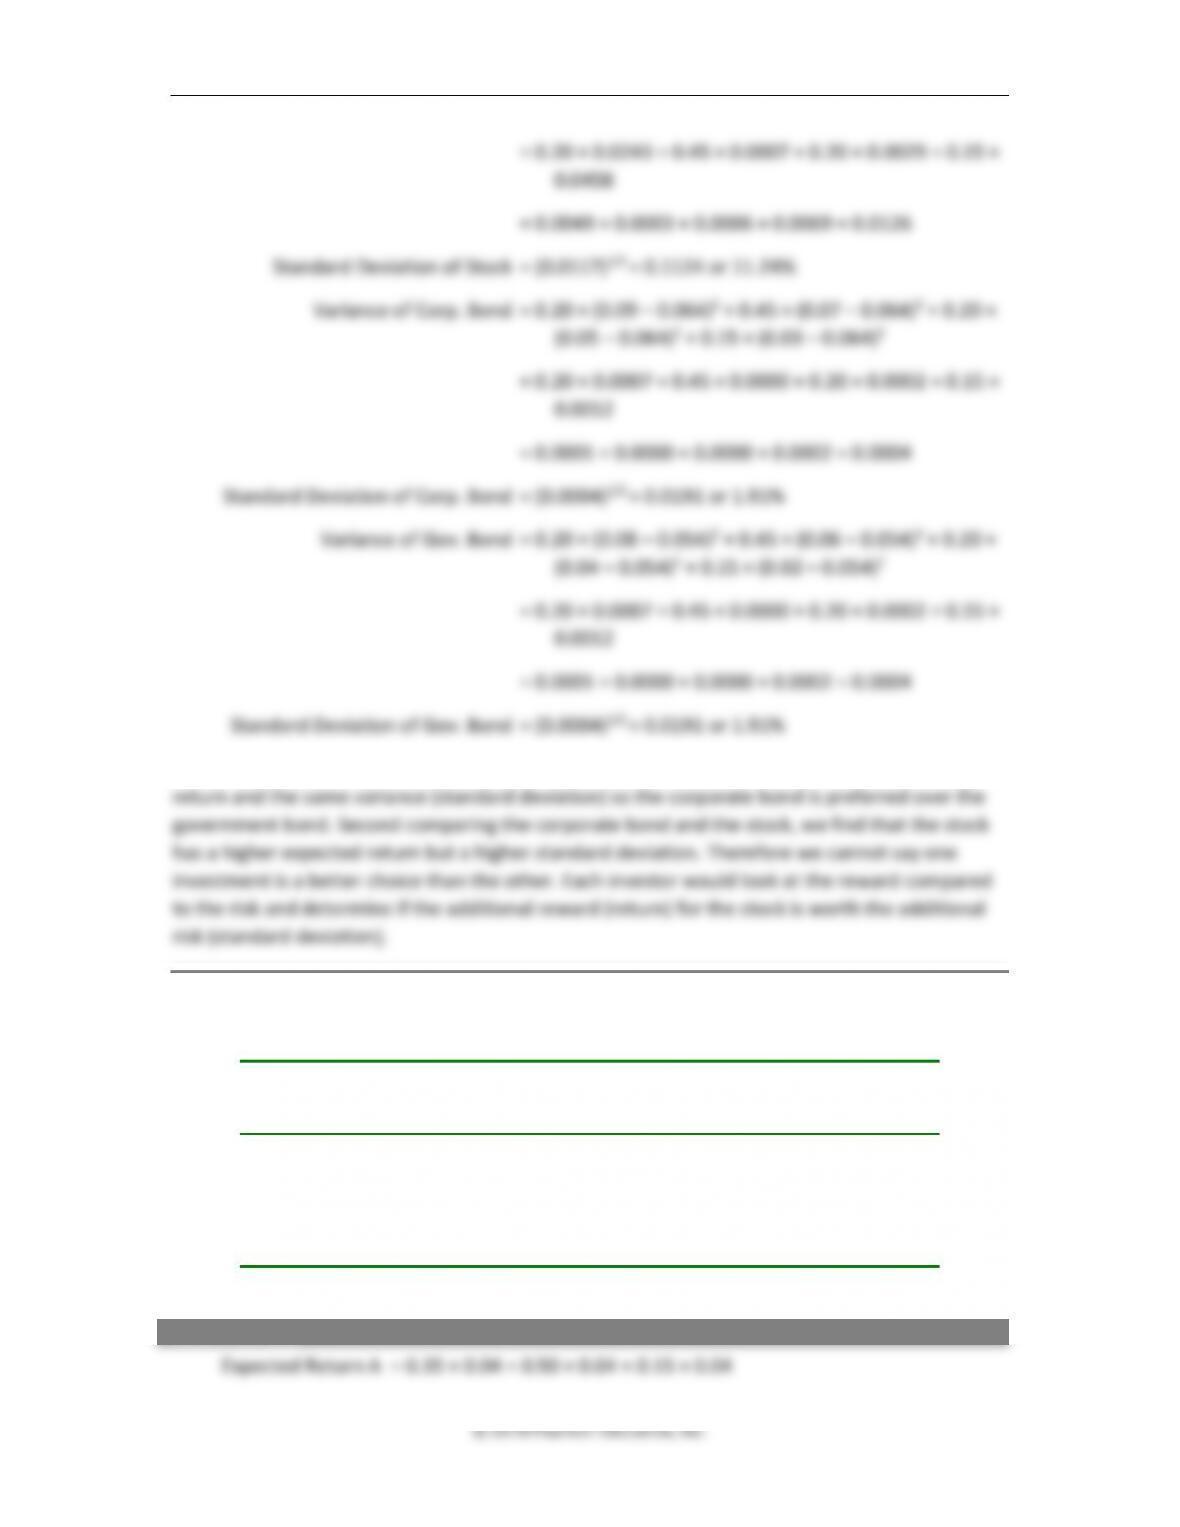
The best choice is the corporate bond. First, comparing the corporate bond and the stock, the
corporate bond has a higher expected return and a lower variance (standard deviation). Second
comparing the corporate bond and the government bond the corporate bond has a higher
return and the same variance (standard deviation). This result is due to the low probabilities of
“good” economic states where the stock performs best.
17. Expected return. Bacon and Associates, a famous Northwest think tank, has provided
probability estimates for the four potential economic states for the coming year. The
probability of a boom economy is 20%, the probability of a stable growth economy is 45%,
the probability of a stagnant economy is 20%, and the probability of a recession is 15%.
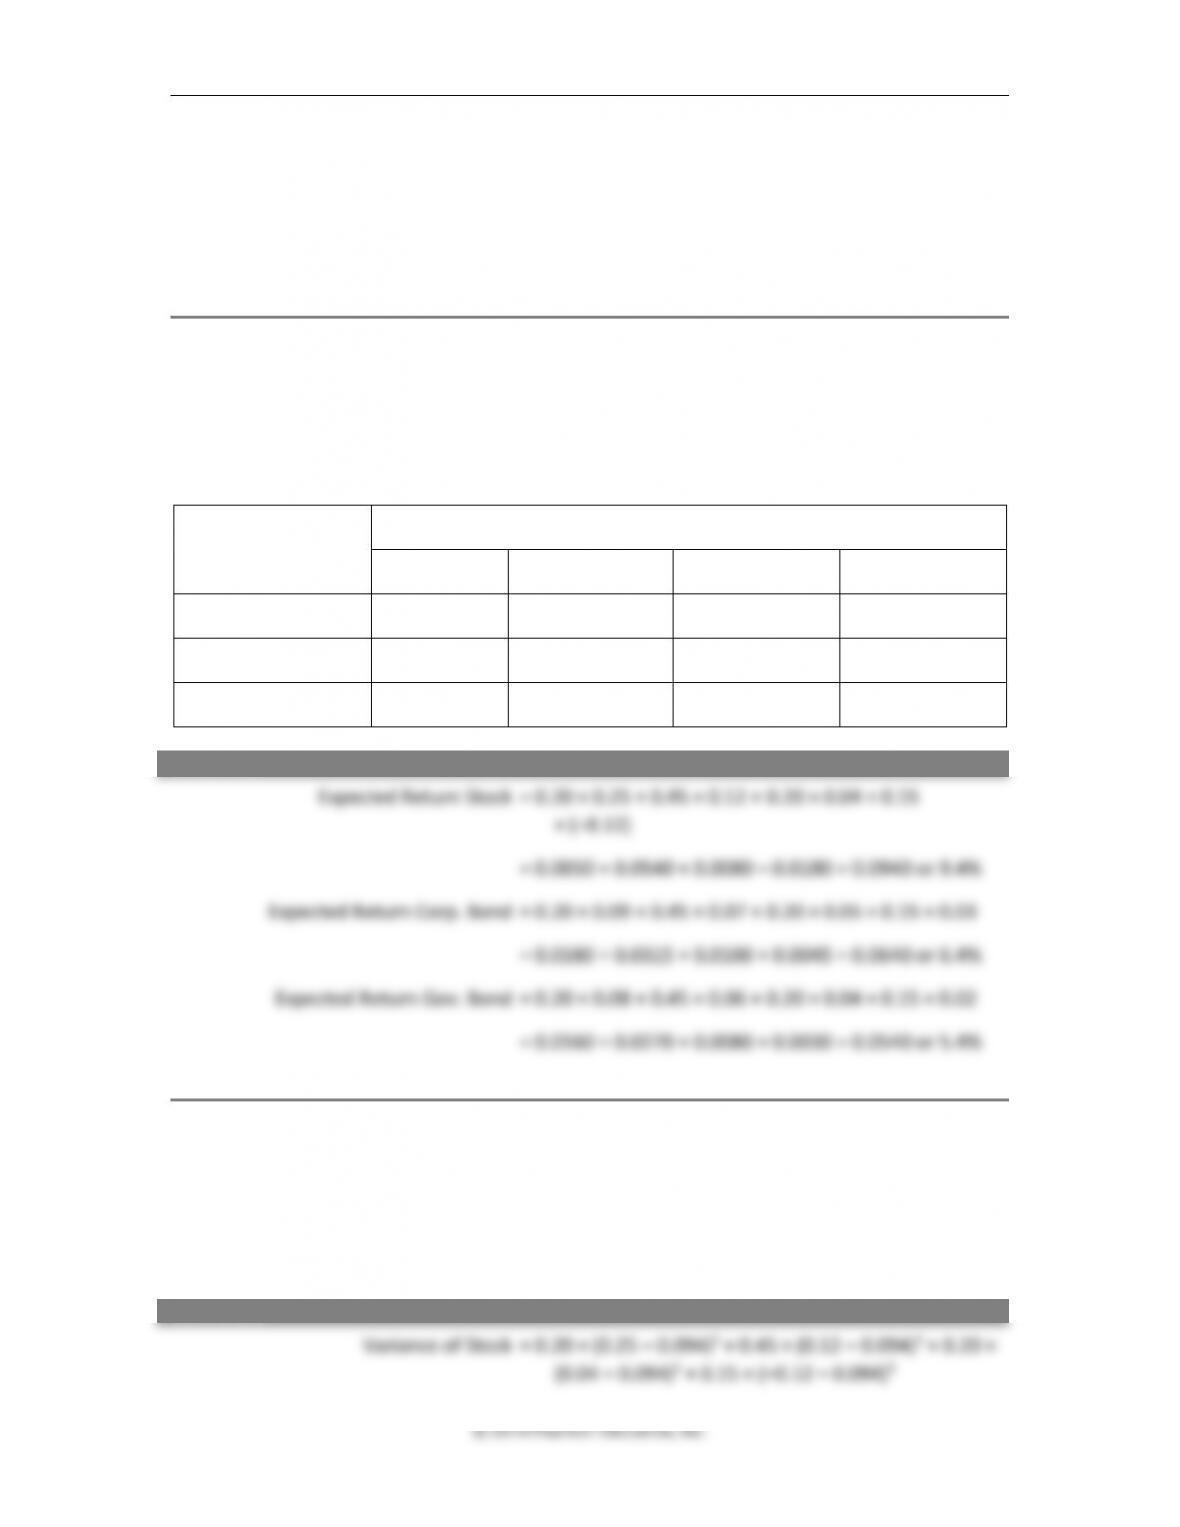
Estimate the expected return on the following individual investments for the coming year.
INVESTMENT
Forecasted Returns for Each Economy
Boom
Stable Growth
Stagnant
Recession
Stock
25%
12%
4%
–12%
Corporate Bond
9%
7%
5%
3%
Government Bond
8%
6%
4%
2%
ANSWER
18. Variance and standard deviation (expected). Using the data from Problem 17, calculate the
variance and standard deviation of the three investments: stock, corporate bond, and
government bond. If the estimates for both the probabilities of the economy and the
returns in each state of the economy are correct, which investment would you choose,
considering both risk and return? Why?
ANSWER
260 Brooks ◼ Financial Management: Core Concepts, 4e
© 2018 Pearson Education, Inc.
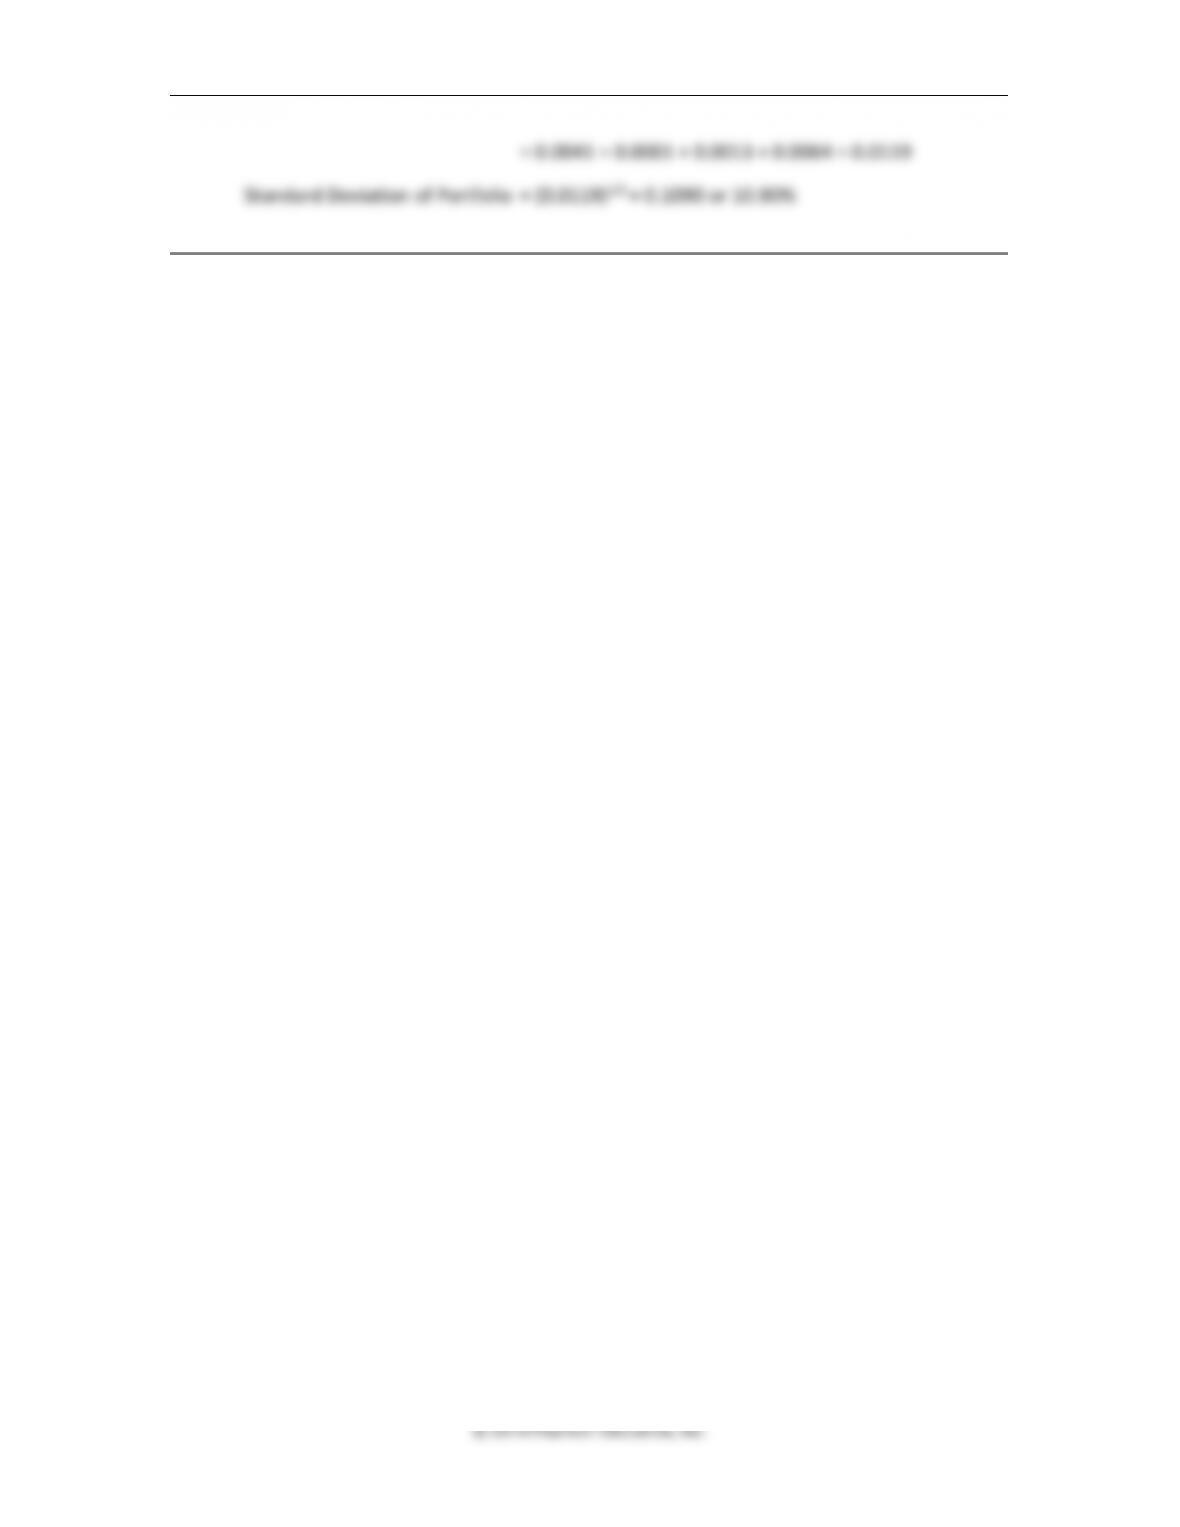
= 0.20 × 0.0243 + 0.45 × 0.0007 + 0.20 × 0.0029 + 0.15 ×
0.0458
= 0.0049 + 0.0003 + 0.0006 + 0.0069 = 0.0126
Standard Deviation of Stock = (0.0117)1/2 = 0.1124 or 11.24%
Variance of Corp. Bond = 0.20 × (0.09 – 0.064)2 + 0.45 × (0.07 – 0.064)2 + 0.20 ×
(0.05 – 0.064)2 + 0.15 × (0.03 – 0.064)2
= 0.20 × 0.0007 + 0.45 × 0.0000 + 0.20 × 0.0002 + 0.15 ×
0.0012
= 0.0001 + 0.0000 + 0.0000 + 0.0002 = 0.0004
Standard Deviation of Corp. Bond = (0.0004)1/2 = 0.0191 or 1.91%
Variance of Gov. Bond = 0.20 × (0.08 – 0.054)2 + 0.45 × (0.06 – 0.054)2 + 0.20 ×
(0.04 – 0.054)2 + 0.15 × (0.02 – 0.054)2
= 0.20 × 0.0007 + 0.45 × 0.0000 + 0.20 × 0.0002 + 0.15 ×
0.0012
= 0.0001 + 0.0000 + 0.0000 + 0.0002 = 0.0004
Standard Deviation of Gov. Bond = (0.0004)1/2 = 0.0191 or 1.91%
First comparing the corporate bond and the government bond, the corporate bond has a higher
19. Expected return and standard deviation. Use the information in the following to answer the
questions below.
State of
Economy
Probability
of State
Return on A in
State
Return on B in
State
Return on C in
State
Boom
0.35
0.040
0.210
0.300
Normal
0.50
0.040
0.080
0.200
Recession
0.15
0.040
–0.010
–0.260
a. What is the expected return of each asset?
ANSWER (a)
Chapter 8 ◼ Risk and Return 261
© 2016 Pearson Education, Inc.
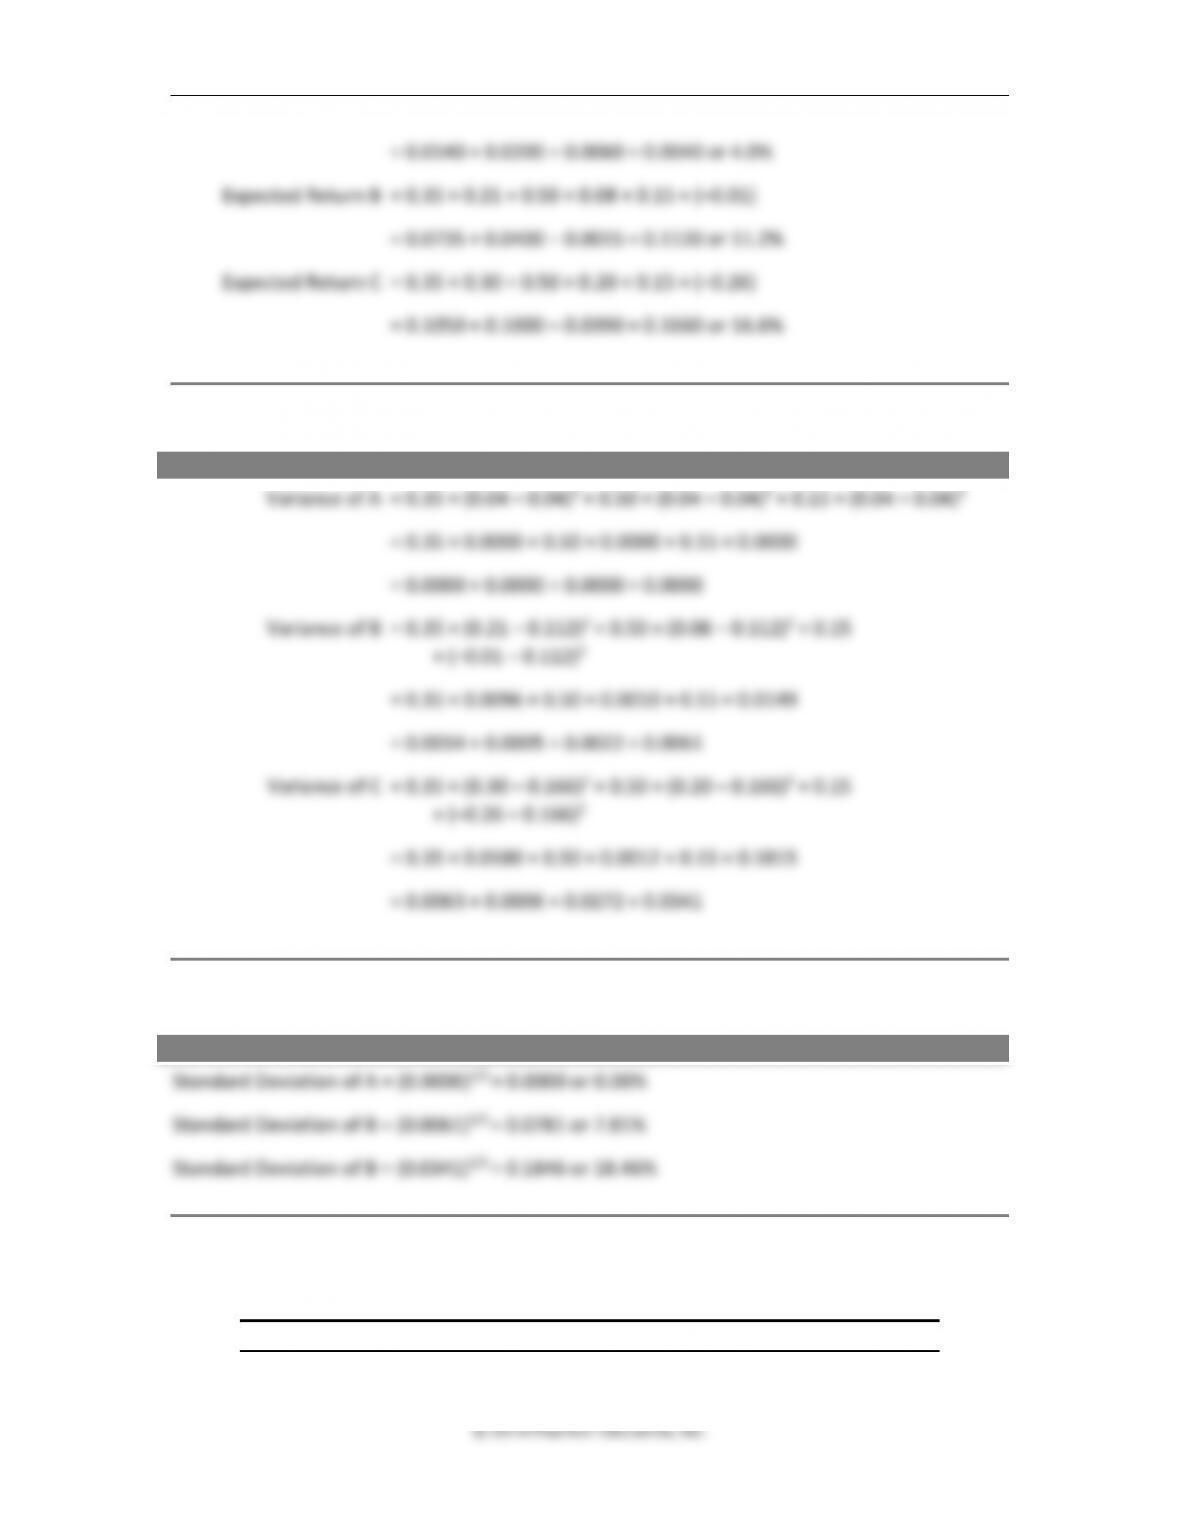
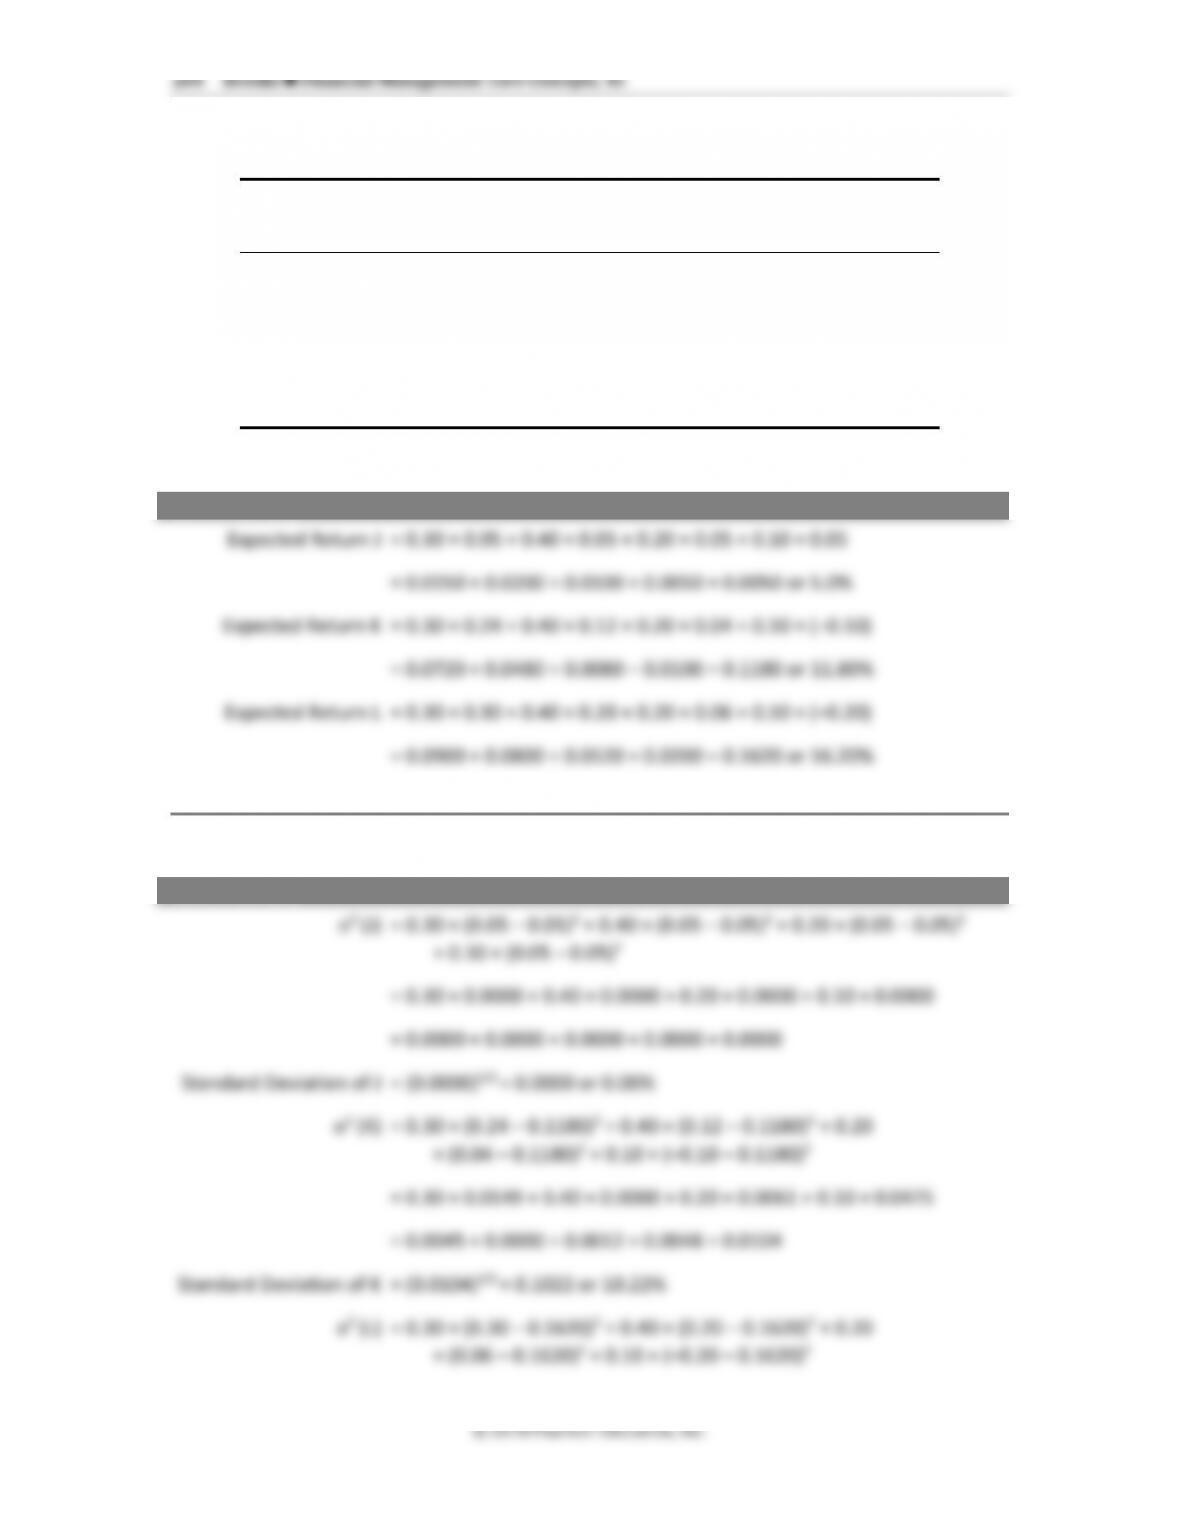
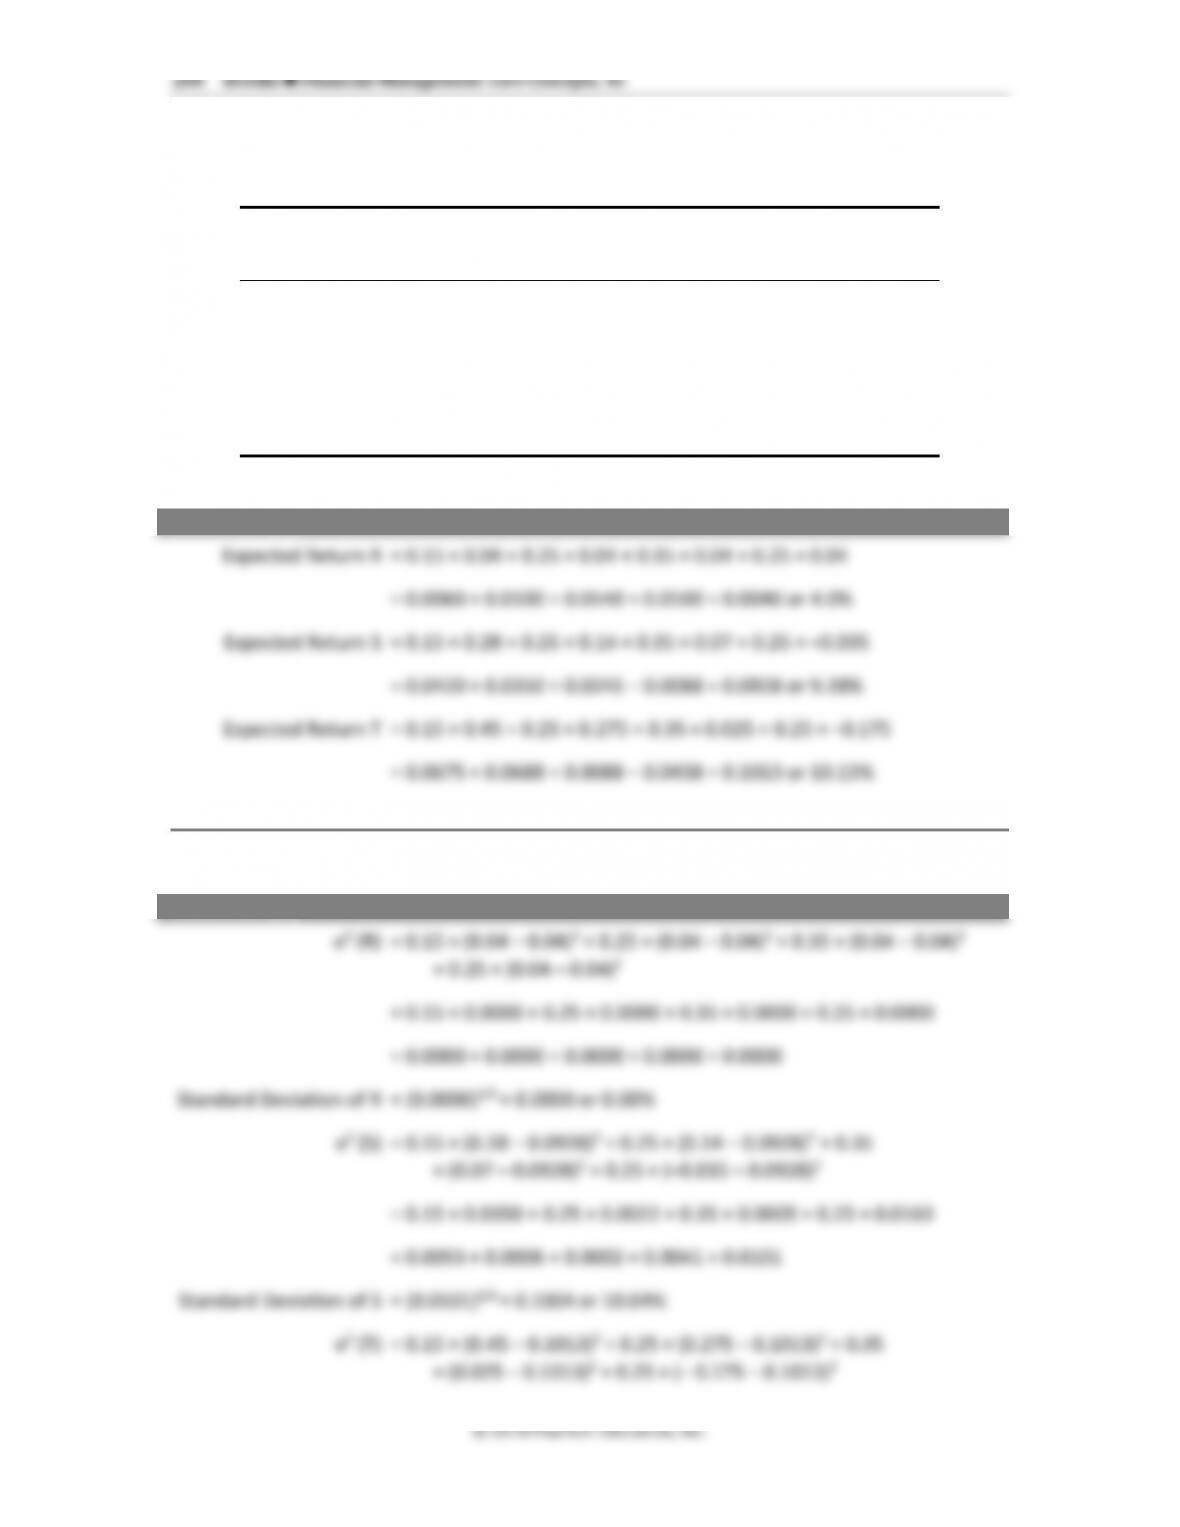
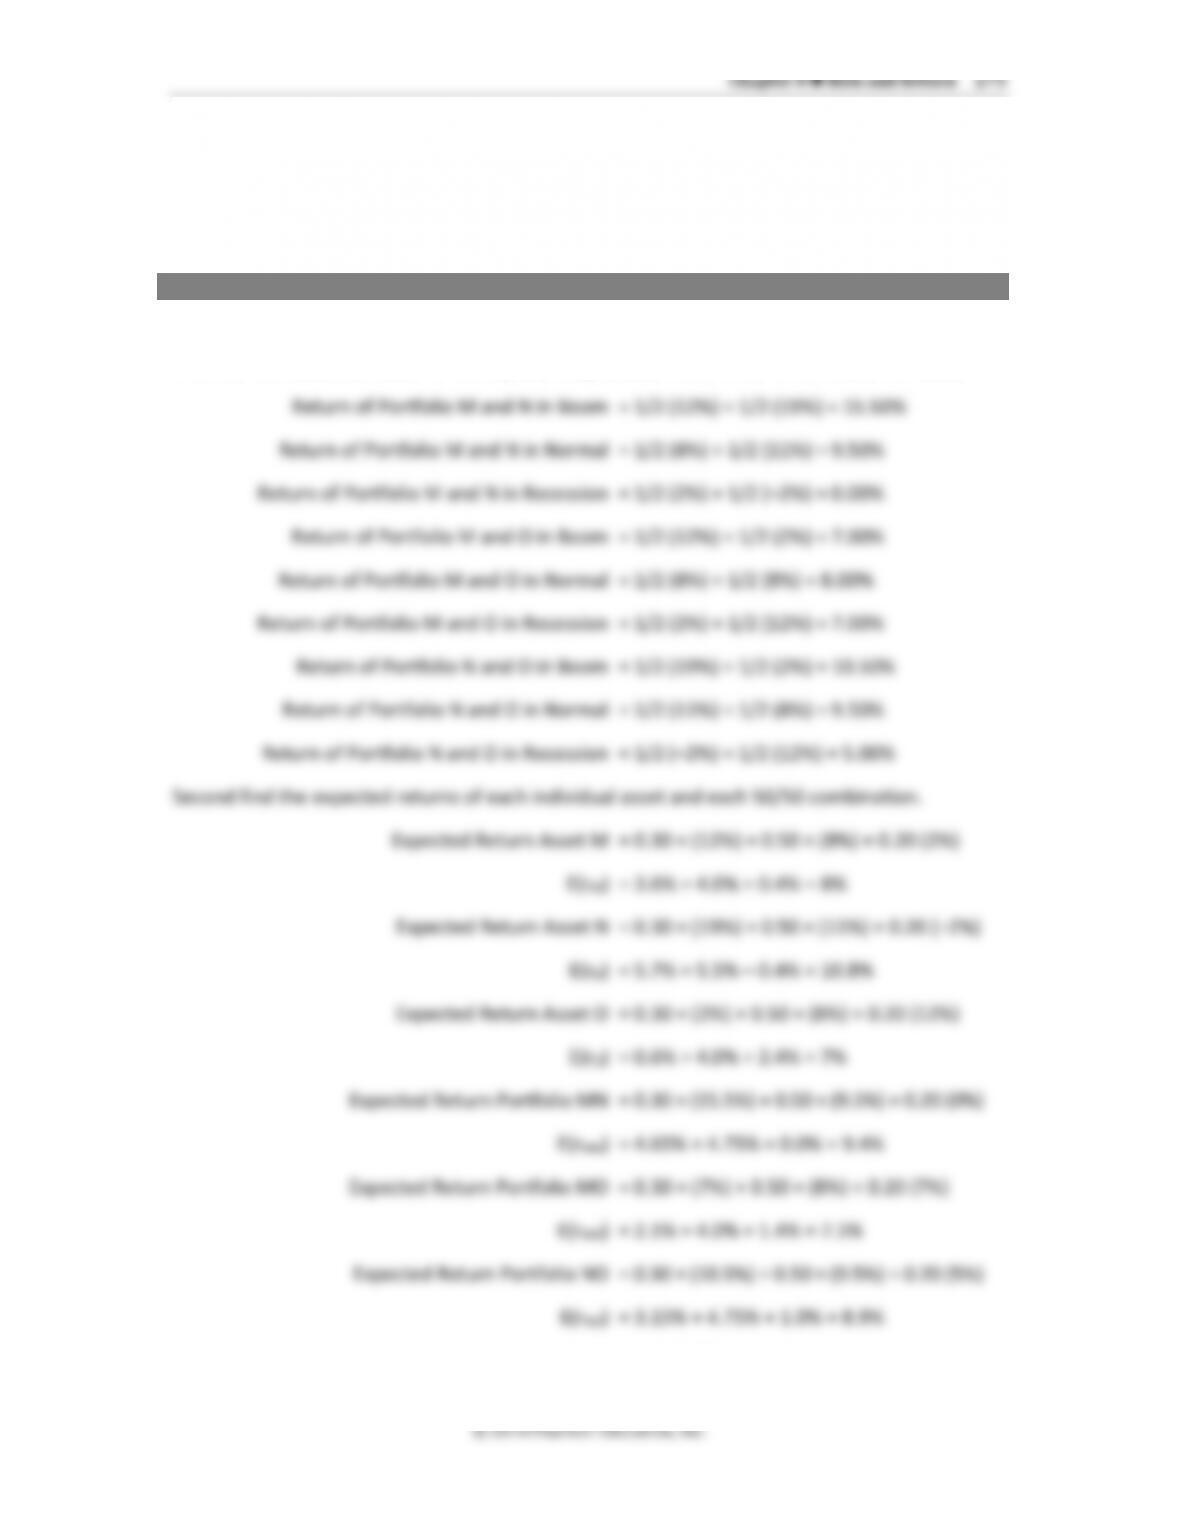
= 0.0140 + 0.0200 + 0.0060 = 0.0040 or 4.0%
Expected Return B = 0.35 × 0.21 + 0.50 × 0.08 + 0.15 × (–0.01)
= 0.0735 + 0.0400 – 0.0015 = 0.1120 or 11.2%
Expected Return C = 0.35 × 0.30 + 0.50 × 0.20 + 0.15 × (–0.26)
= 0.1050 + 0.1000 – 0.0390 = 0.1660 or 16.6%
b. What is the variance of each asset?
ANSWER (b)
c. What is the standard deviation of each asset?
ANSWER (c)
20. Expected return and standard deviation. Use the following information to answer the
questions.
State of
Probability
Return on D in
Return on E in
Return on F in
262 Brooks ◼ Financial Management: Core Concepts, 4e
Economy
of State
State
State
State
Boom
0.35
0.060
0.310
0.150
Normal
0.50
0.060
0.180
0.120
Recession
0.15
0.060
–0.210
–0.060
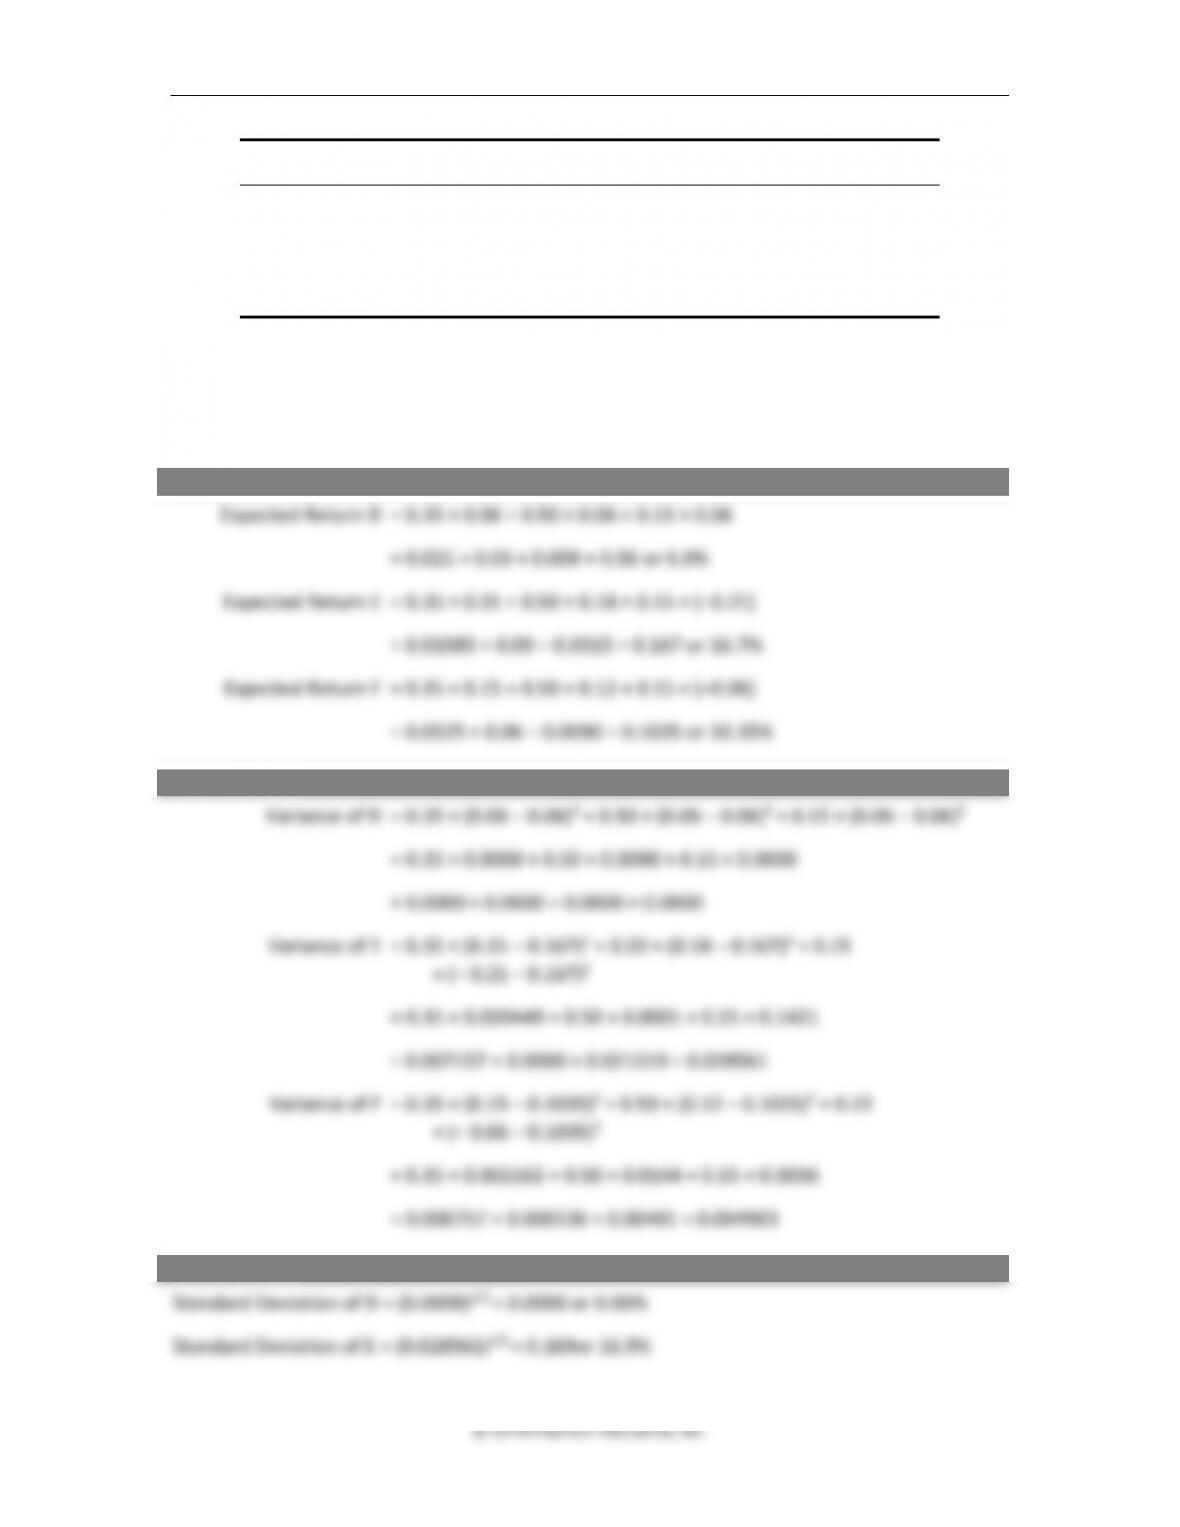
a. What is the expected returns of each asset?
b. What is the variance of each asset?
c. What is the standard deviation of each asset?
ANSWER (a)
ANSWER (b)
ANSWER (c)
Chapter 8 ◼ Risk and Return 263
© 2016 Pearson Education, Inc.
Standard Deviation of F = (0.004903)1/2 = 0.0700 or 7%
Chapter 8 ◼ Risk and Return 265
© 2016 Pearson Education, Inc.
= 0.30 × 0.0190 + 0.40 × 0.0014 + 0.20 × 0.0104 + 0.10 × 0.1310
= 0.0057 + 0.0006 + 0.0021 + 0.0131 = 0.0215
Standard Deviation of L = (0.0215)1/2 = 0.1465 or 14.65%
0.0215 0.1465
L
==
266 Brooks ◼ Financial Management: Core Concepts, 4e
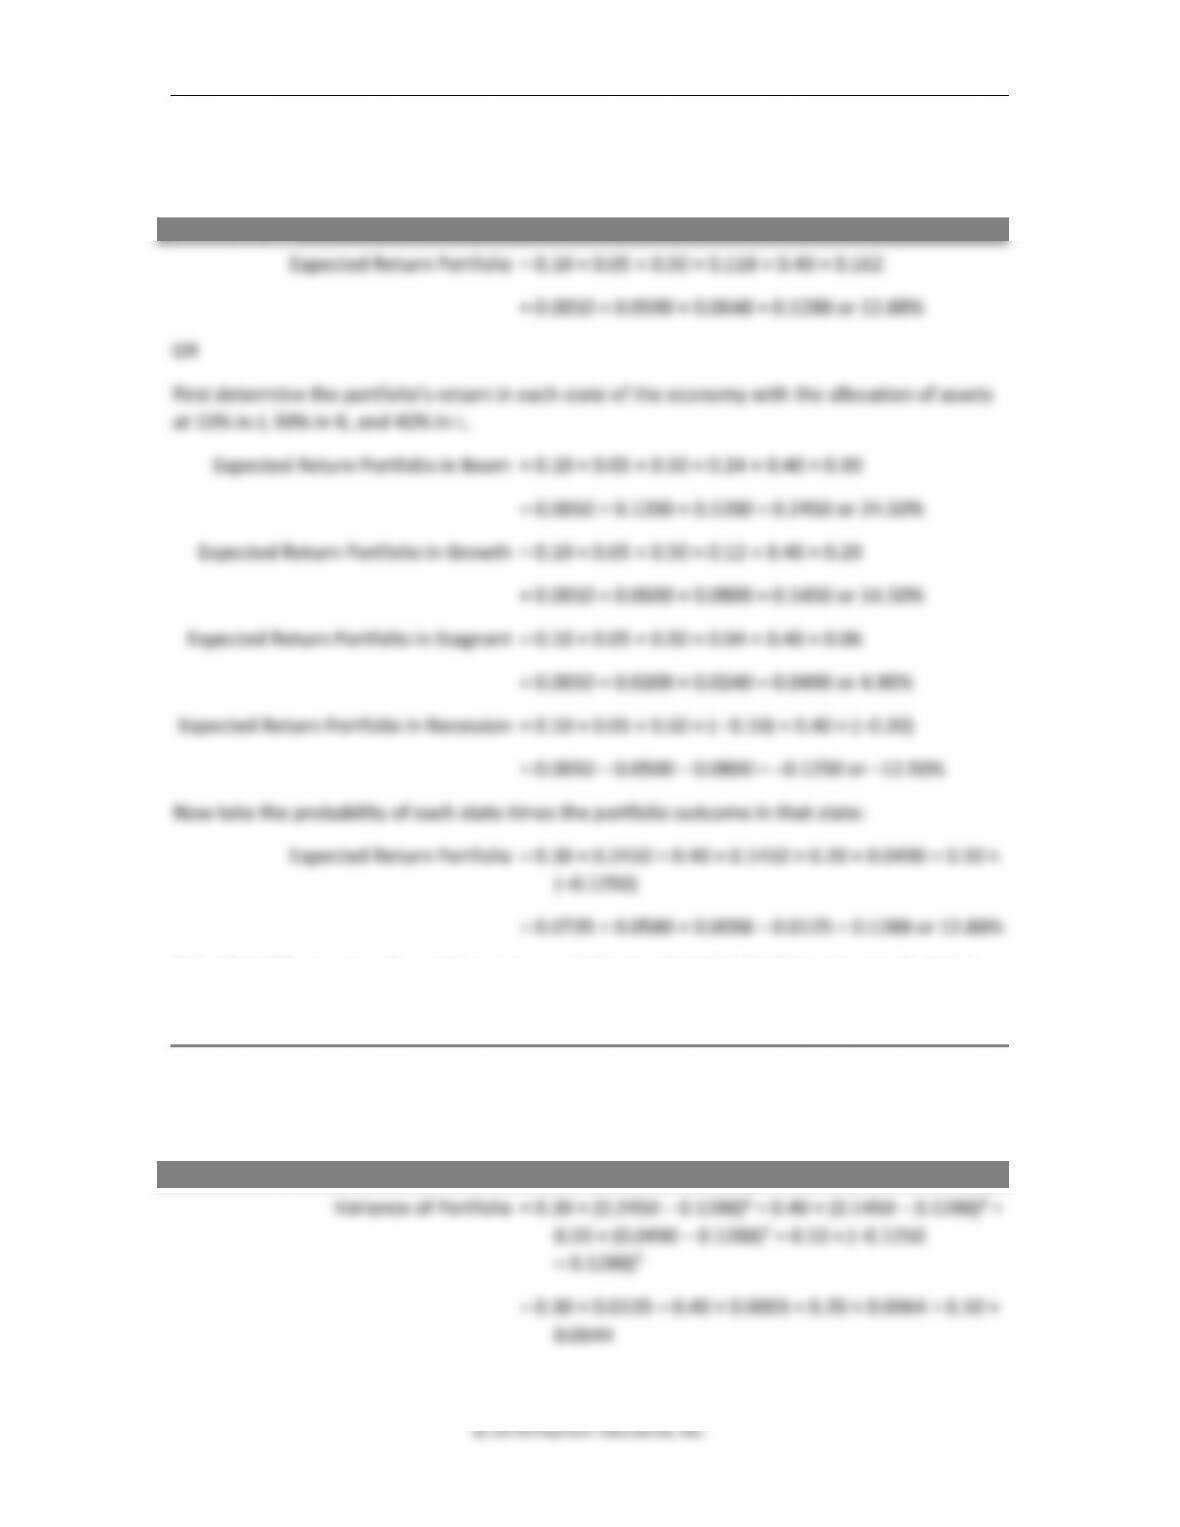
c. What is the expected return of a portfolio with 10% in Asset J, 50% in Asset K, and 40%
in Asset L?
ANSWER (c)
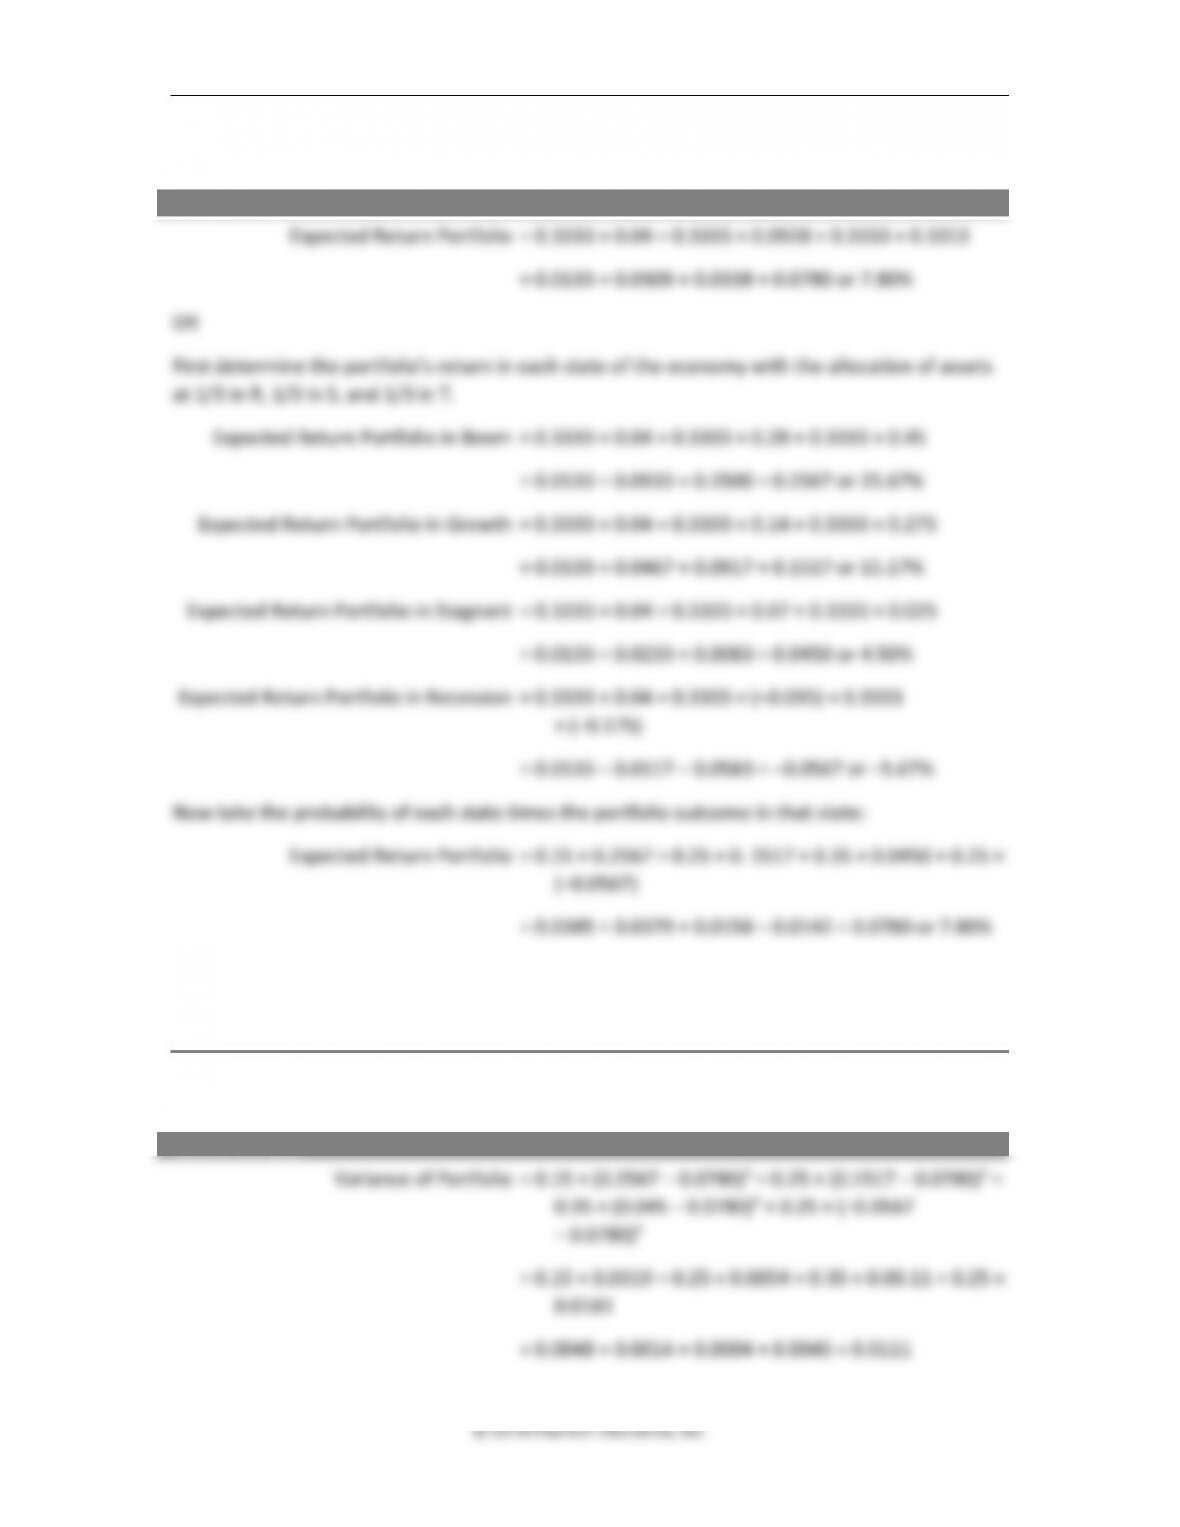
Note that either way produces the same expected return but that for the variance calculation
the portfolio returns in the three economic states are needed.
d. What are the portfolio’s variance and standard deviation using the same asset weights
from part (c)?
ANSWER (d)
Chapter 8 ◼ Risk and Return 267
© 2016 Pearson Education, Inc.
= 0.0041 + 0.0001 + 0.0013 + 0.0064 = 0.0119
Standard Deviation of Portfolio = (0.0119)1/2 = 0.1090 or 10.90%
Chapter 8 ◼ Risk and Return 269
© 2016 Pearson Education, Inc.
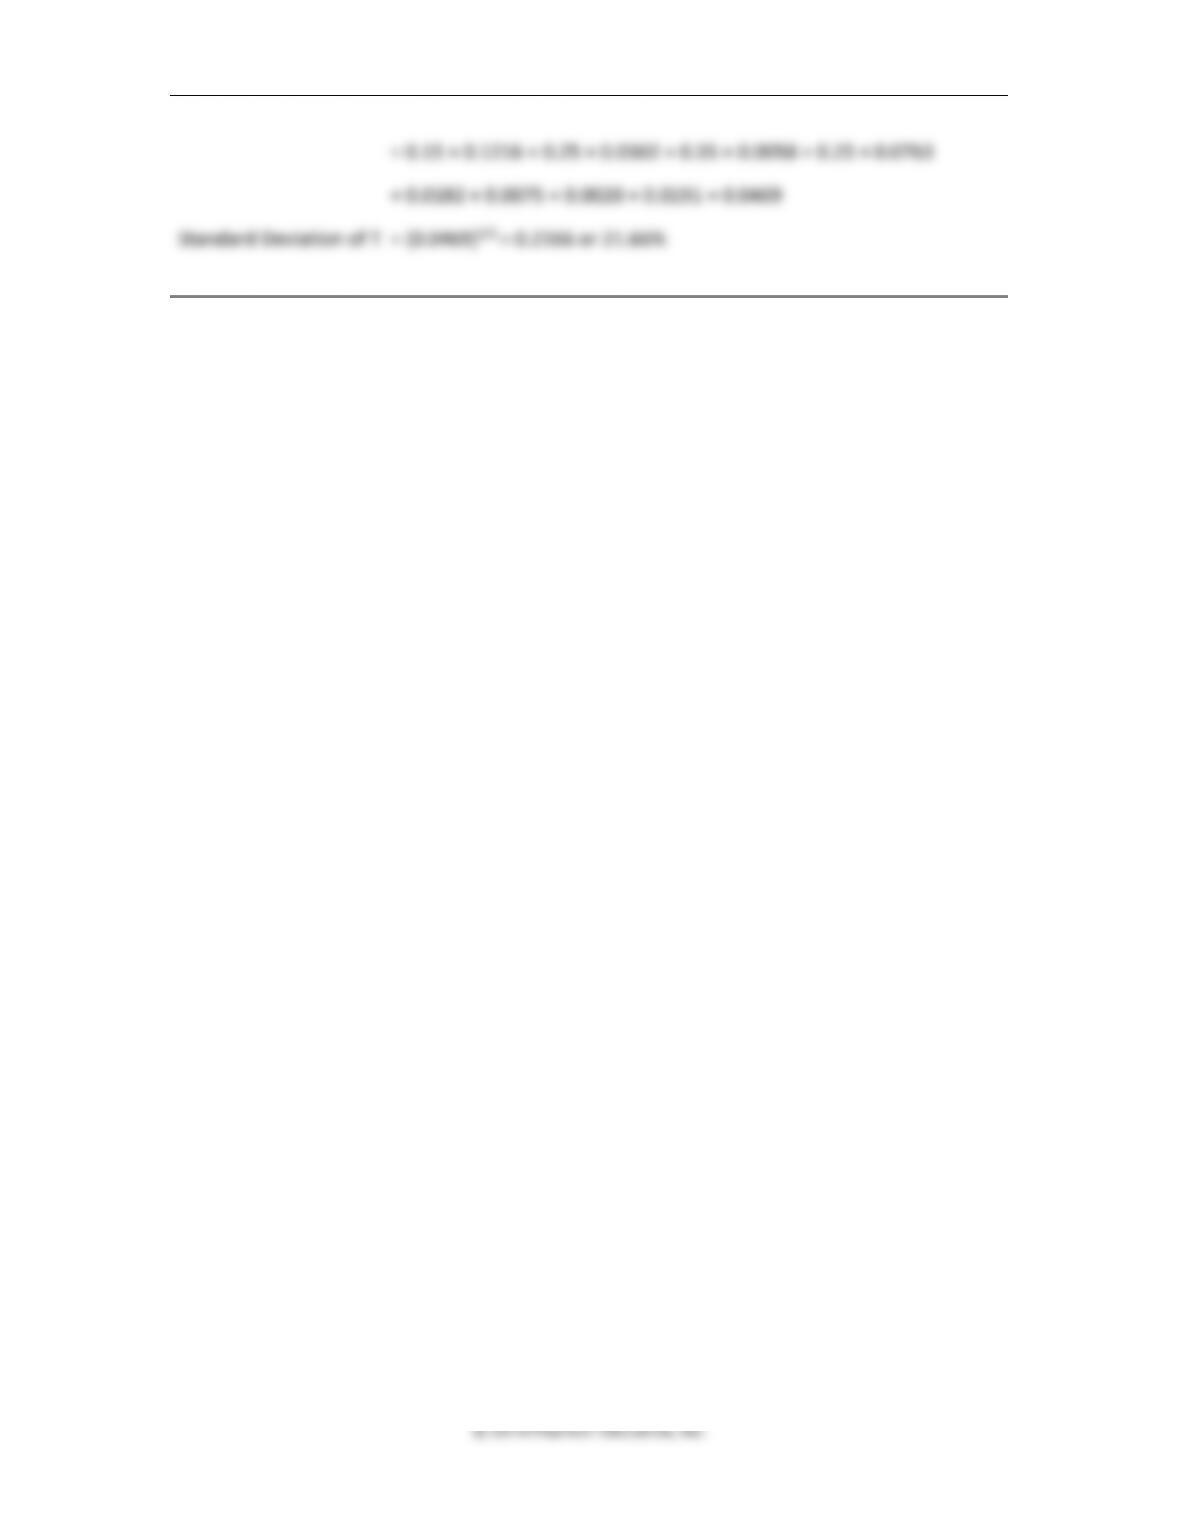
= 0.15 × 0.1216 + 0.25 × 0.0302 + 0.35 × 0.0058 + 0.25 × 0.0763
= 0.0182 + 0.0075 + 0.0020 + 0.0191 = 0.0469
Standard Deviation of T = (0.0469)1/2 = 0.2166 or 21.66%
270 Brooks ◼ Financial Management: Core Concepts, 4e
c. What is the expected return of a portfolio with equal investment in all three assets?
ANSWER (c)
Note that either way produces the same expected return, but that for the variance
calculation, the portfolio returns in the three economic states are needed.
d. What is the portfolio’s variance and standard deviation using the same asset weights in
part ©?
ANSWER (d)
Chapter 8 ◼ Risk and Return 271
© 2016 Pearson Education, Inc.
Standard Deviation of Portfolio = (0.0111)1/2 = 0.1052 or 10.52%
274 Brooks ◼ Financial Management: Core Concepts, 4e
© 2018 Pearson Education, Inc.
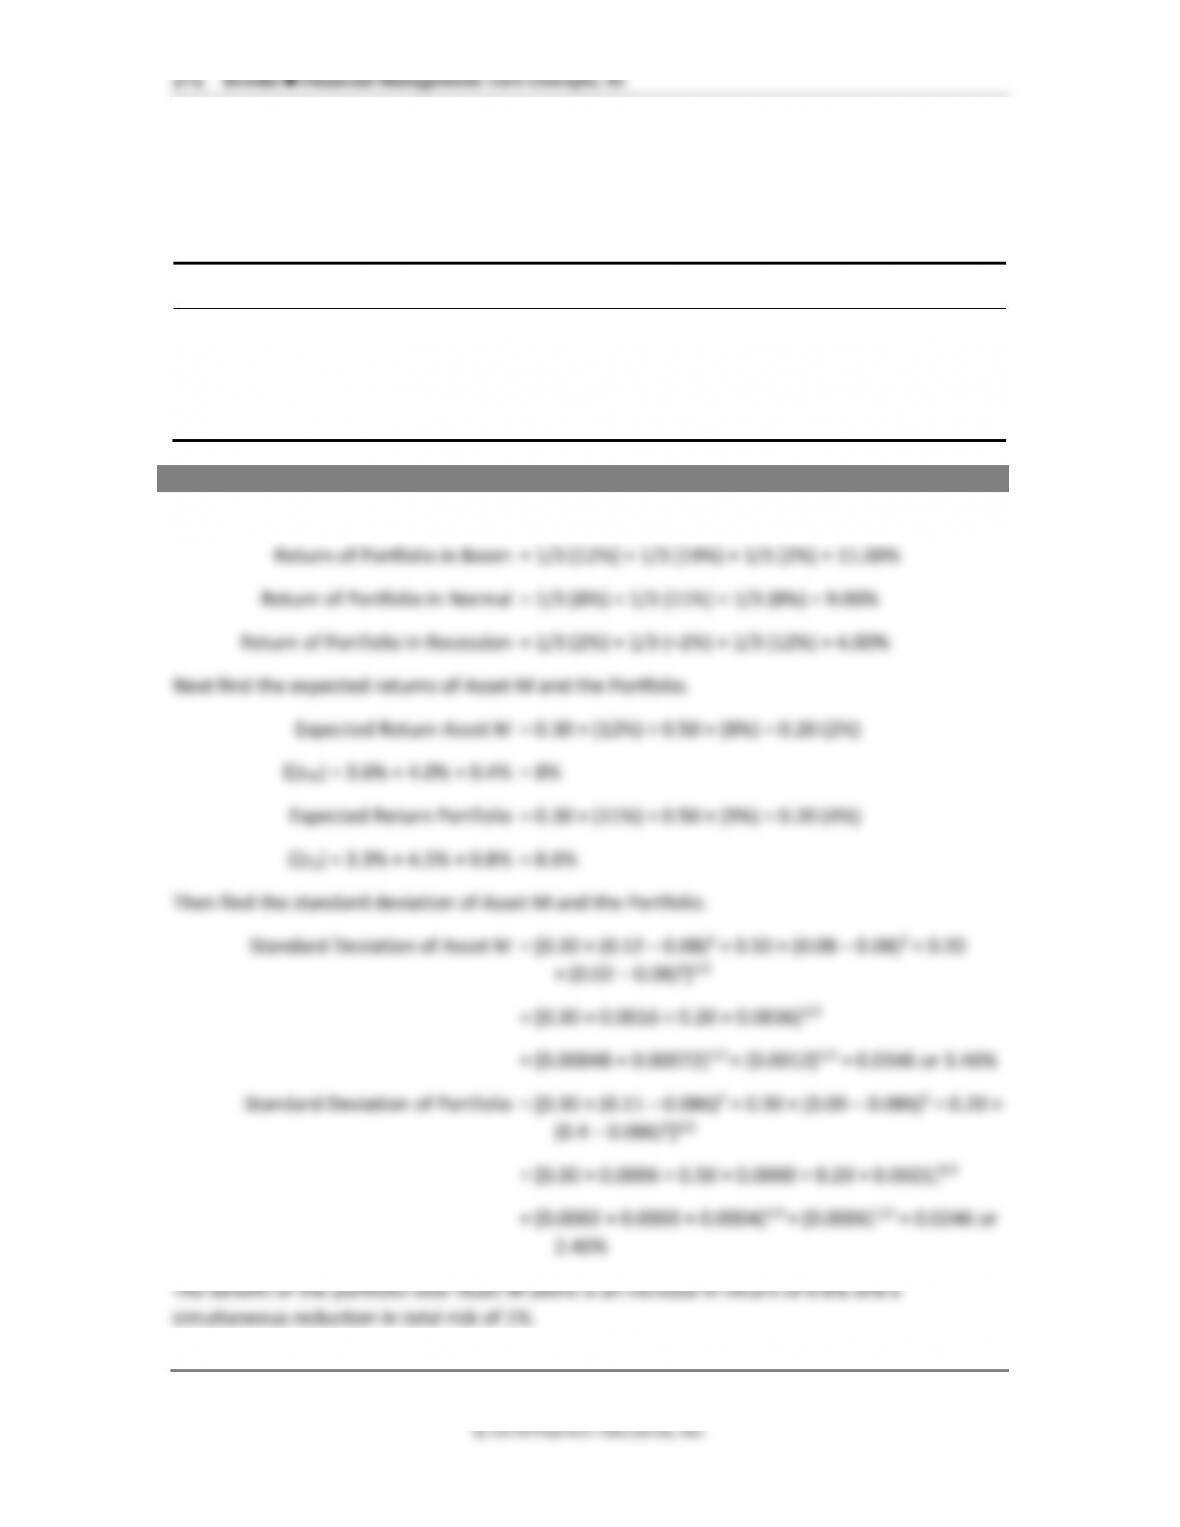
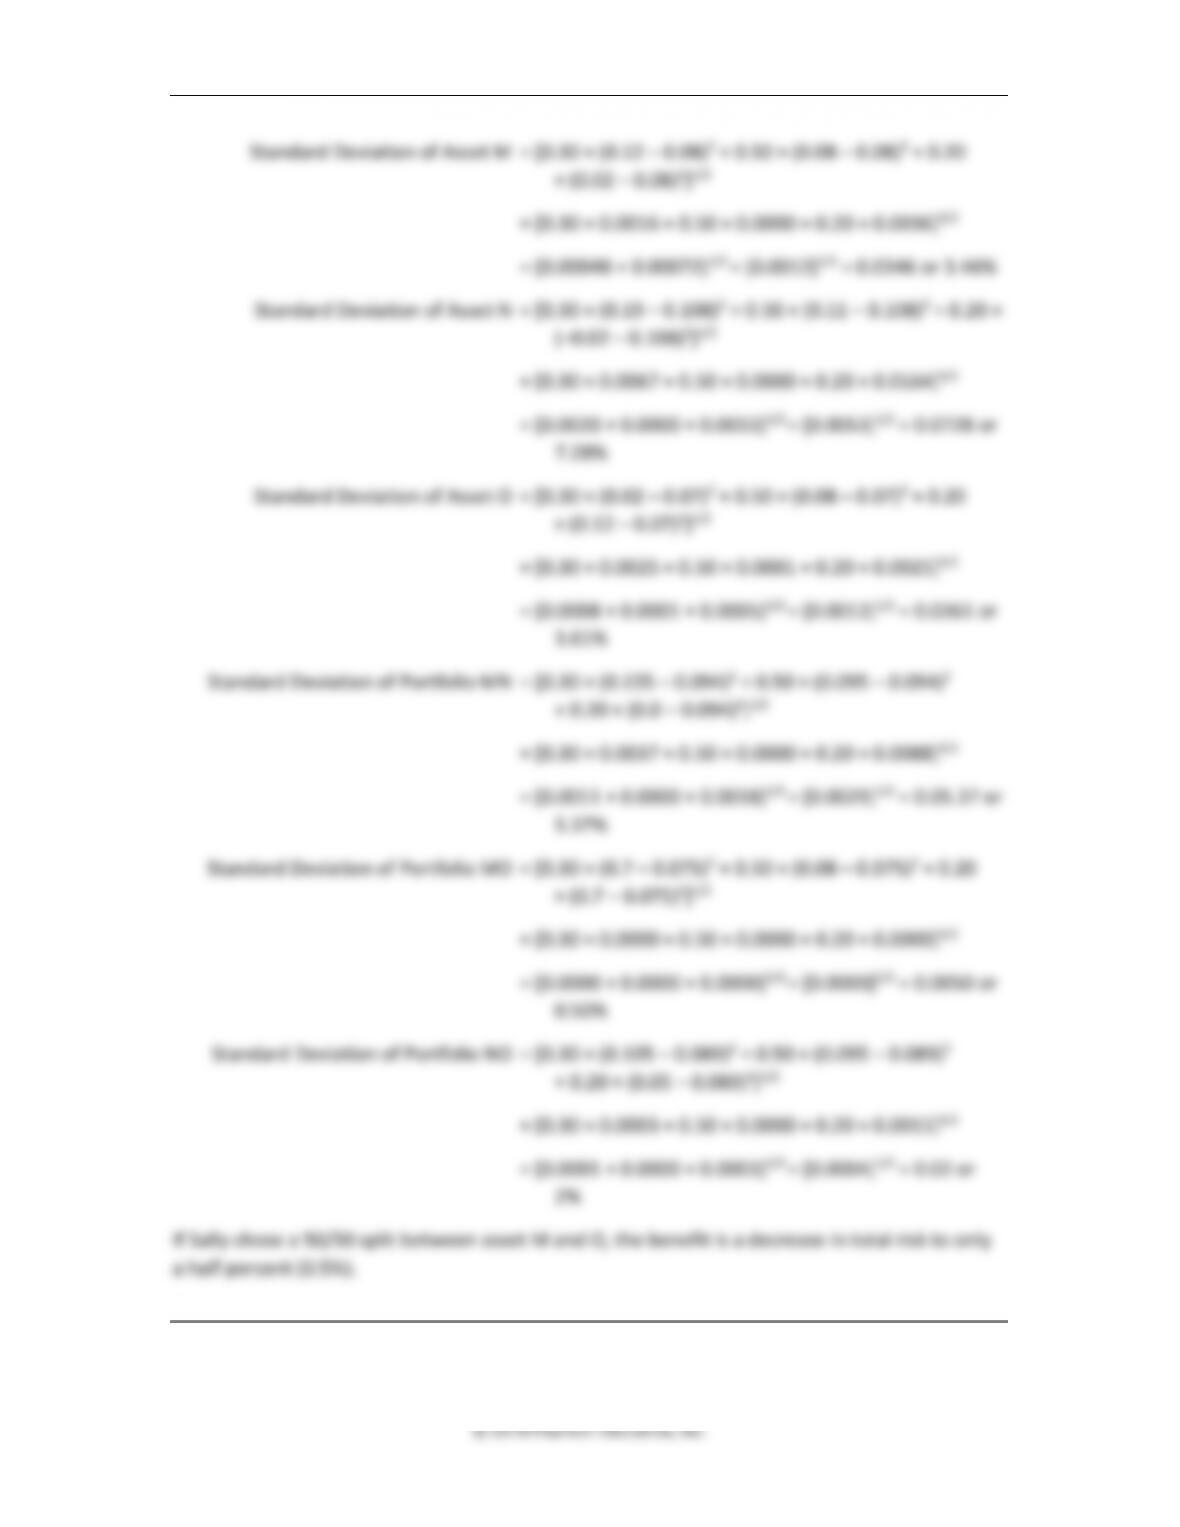
Standard Deviation of Asset M = [0.30 × (0.12 – 0.08)2 + 0.50 × (0.08 – 0.08)2 + 0.20
× (0.02 – 0.08)2]1/2
= [0.30 × 0.0016 + 0.50 × 0.0000 + 0.20 × 0.0036]1/2
= [0.00048 + 0.00072]1/2 = [0.0012]1/2 = 0.0346 or 3.46%
Standard Deviation of Asset N = [0.30 × (0.19 – 0.108)2 + 0.50 × (0.11 – 0.108)2 + 0.20 ×
(–0.02 – 0.108)2]1/2
= [0.30 × 0.0067 + 0.50 × 0.0000 + 0.20 × 0.0164]1/2
= [0.0020 + 0.0000 + 0.0033]1/2 = [0.0053]1/2 = 0.0728 or
7.28%
Standard Deviation of Asset O = [0.30 × (0.02 – 0.07)2 + 0.50 × (0.08 – 0.07)2 + 0.20
× (0.12 – 0.07)2]1/2
= [0.30 × 0.0025 + 0.50 × 0.0001 + 0.20 × 0.0025]1/2
= [0.0008 + 0.0001 + 0.0005]1/2 = [0.0013]1/2 = 0.0361 or
3.61%
Standard Deviation of Portfolio MN = [0.30 × (0.155 – 0.094)2 + 0.50 × (0.095 – 0.094)2
+ 0.20 × (0.0 – 0.094)2]1/2
= [0.30 × 0.0037 + 0.50 × 0.0000 + 0.20 × 0.0088]1/2
= [0.0011 + 0.0000 + 0.0018]1/2 = [0.0029]1/2 = 0.05.37 or
5.37%
Standard Deviation of Portfolio MO = [0.30 × (0.7 – 0.075)2 + 0.50 × (0.08 – 0.075)2 + 0.20
× (0.7 – 0.075)2]1/2
= [0.30 × 0.0000 + 0.50 × 0.0000 + 0.20 × 0.0000]1/2
= [0.0000 + 0.0000 + 0.0000]1/2 = [0.0000]1/2 = 0.0050 or
0.50%
Standard Deviation of Portfolio NO = [0.30 × (0.105 – 0.089)2 + 0.50 × (0.095 – 0.089)2
+ 0.20 × (0.05 – 0.089)2]1/2
= [0.30 × 0.0003 + 0.50 × 0.0000 + 0.20 × 0.0015]1/2
= [0.0001 + 0.0000 + 0.0003]1/2 = [0.0004]1/2 = 0.02 or
2%
If Sally chose a 50/50 split between asset M and O, the benefit is a decrease in total risk to only
a half percent (0.5%).
276 Brooks ◼ Financial Management: Core Concepts, 4e
Weight in P
Weight in Q
Weight in R
Weight in S
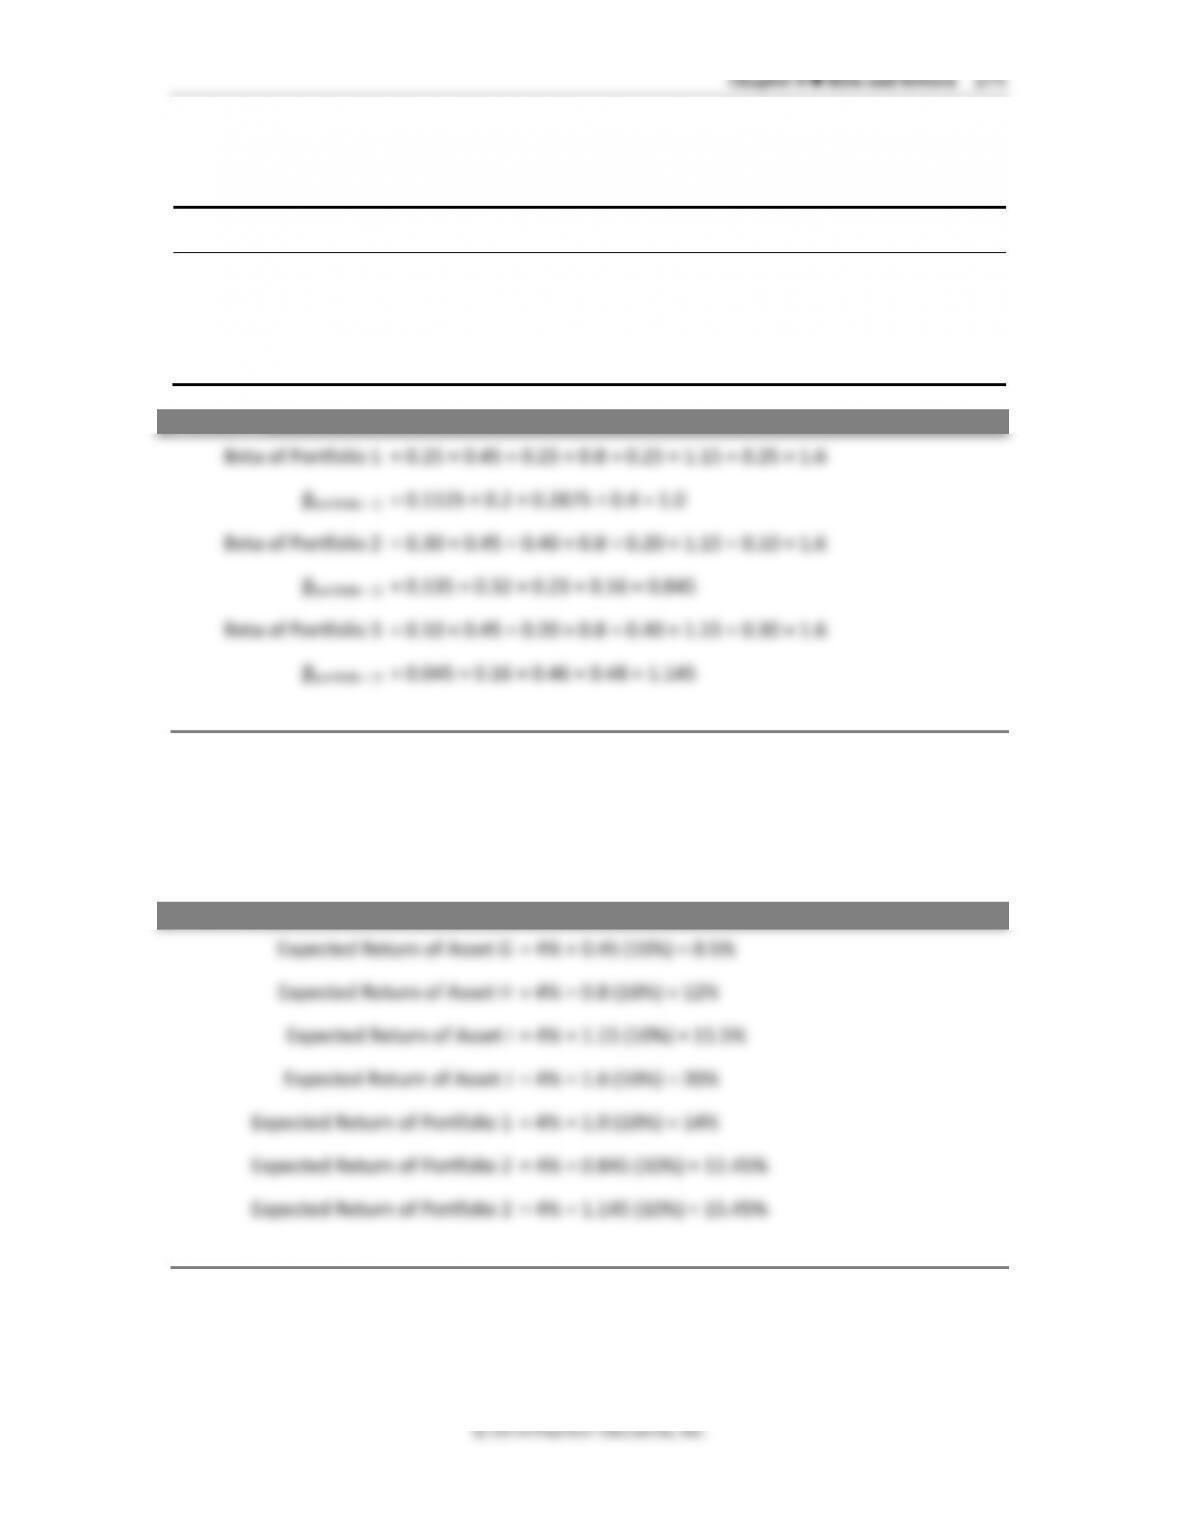
Portfolio 1
25%
25%
25%
25%
Portfolio 2
30%
40%
20%
10%
Portfolio 3
10%
20%
40%
30%
ANSWER
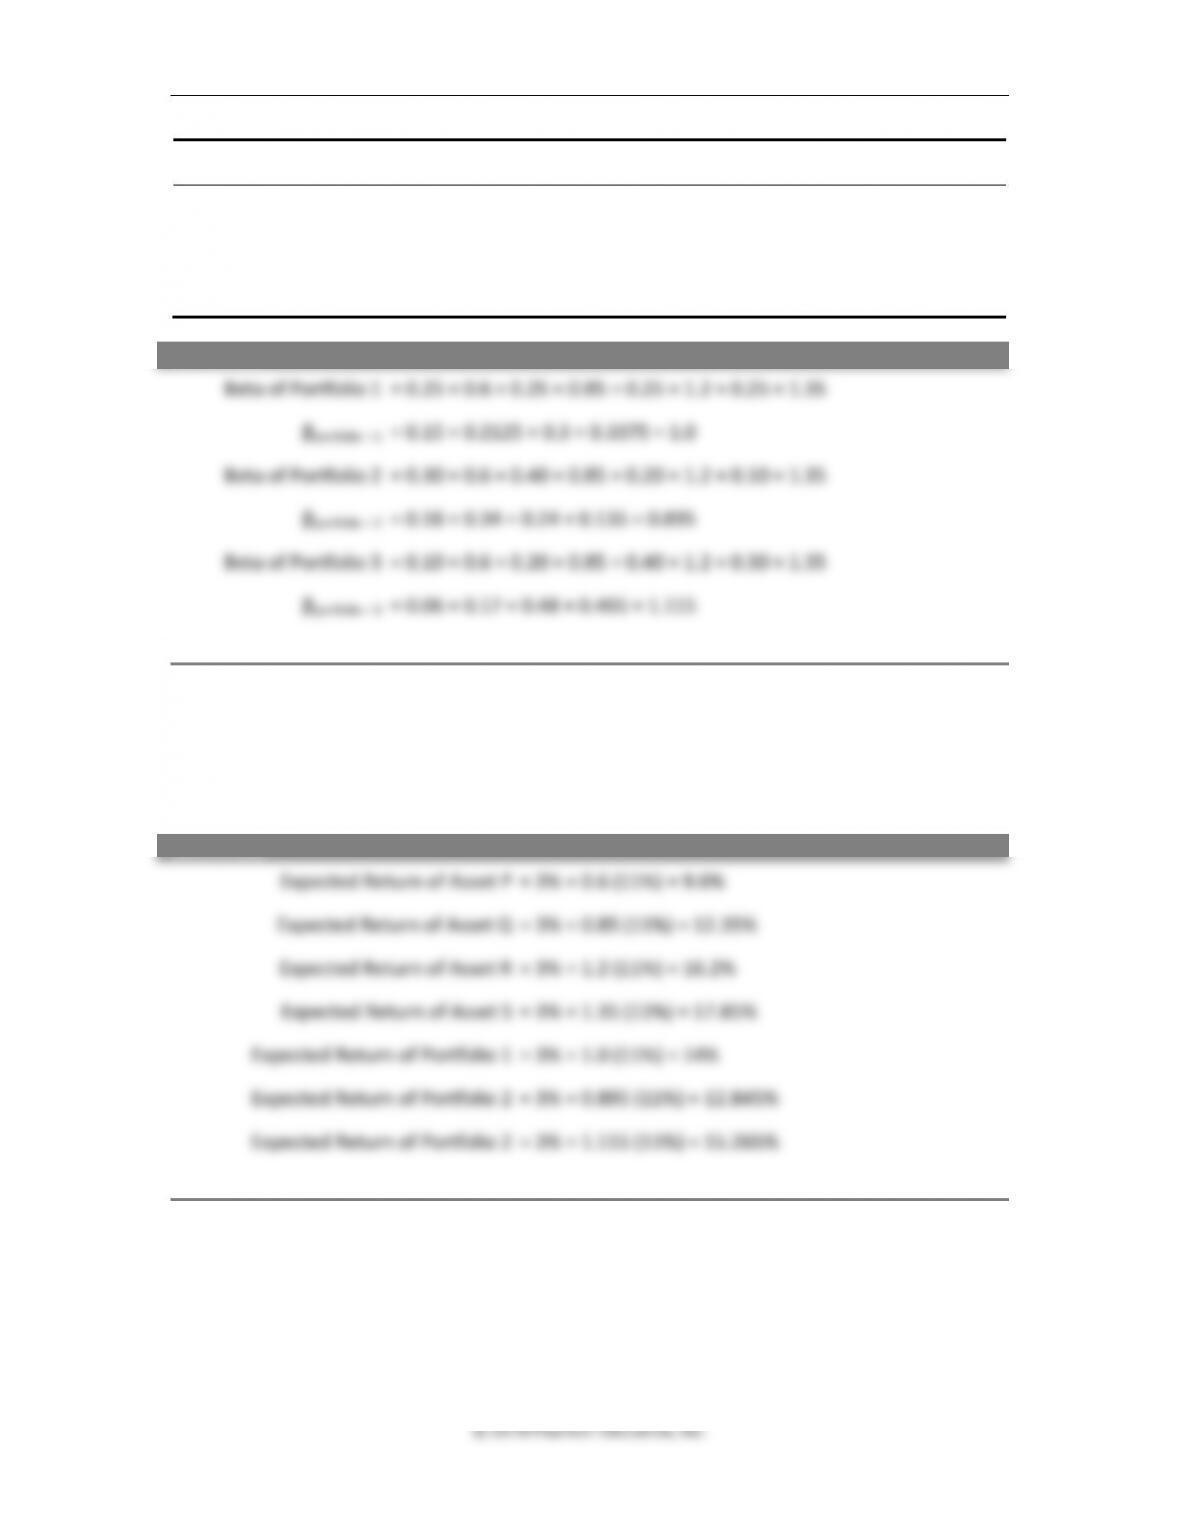
28. Expected return of a portfolio using beta. Use the same four assets from Problem 27 in the
same three portfolios. What are the expected returns of the four individual assets and the
three portfolios, if the current SML is plotting with an intercept of 3% (risk-free rate) and a
market premium of 11% (slope of the line)?
29. Changing risk level. Mr. Malone wants to change the overall risk of his portfolio. Currently
his portfolio is a combination of risky assets with a beta of 1.25 and an expected return of
14%. He will add a risk-free asset (U.S. Treasury bill) to his portfolio. If he wants a beta of
1.0, what percentage of his wealth should be in the risky portfolio, and what percentage
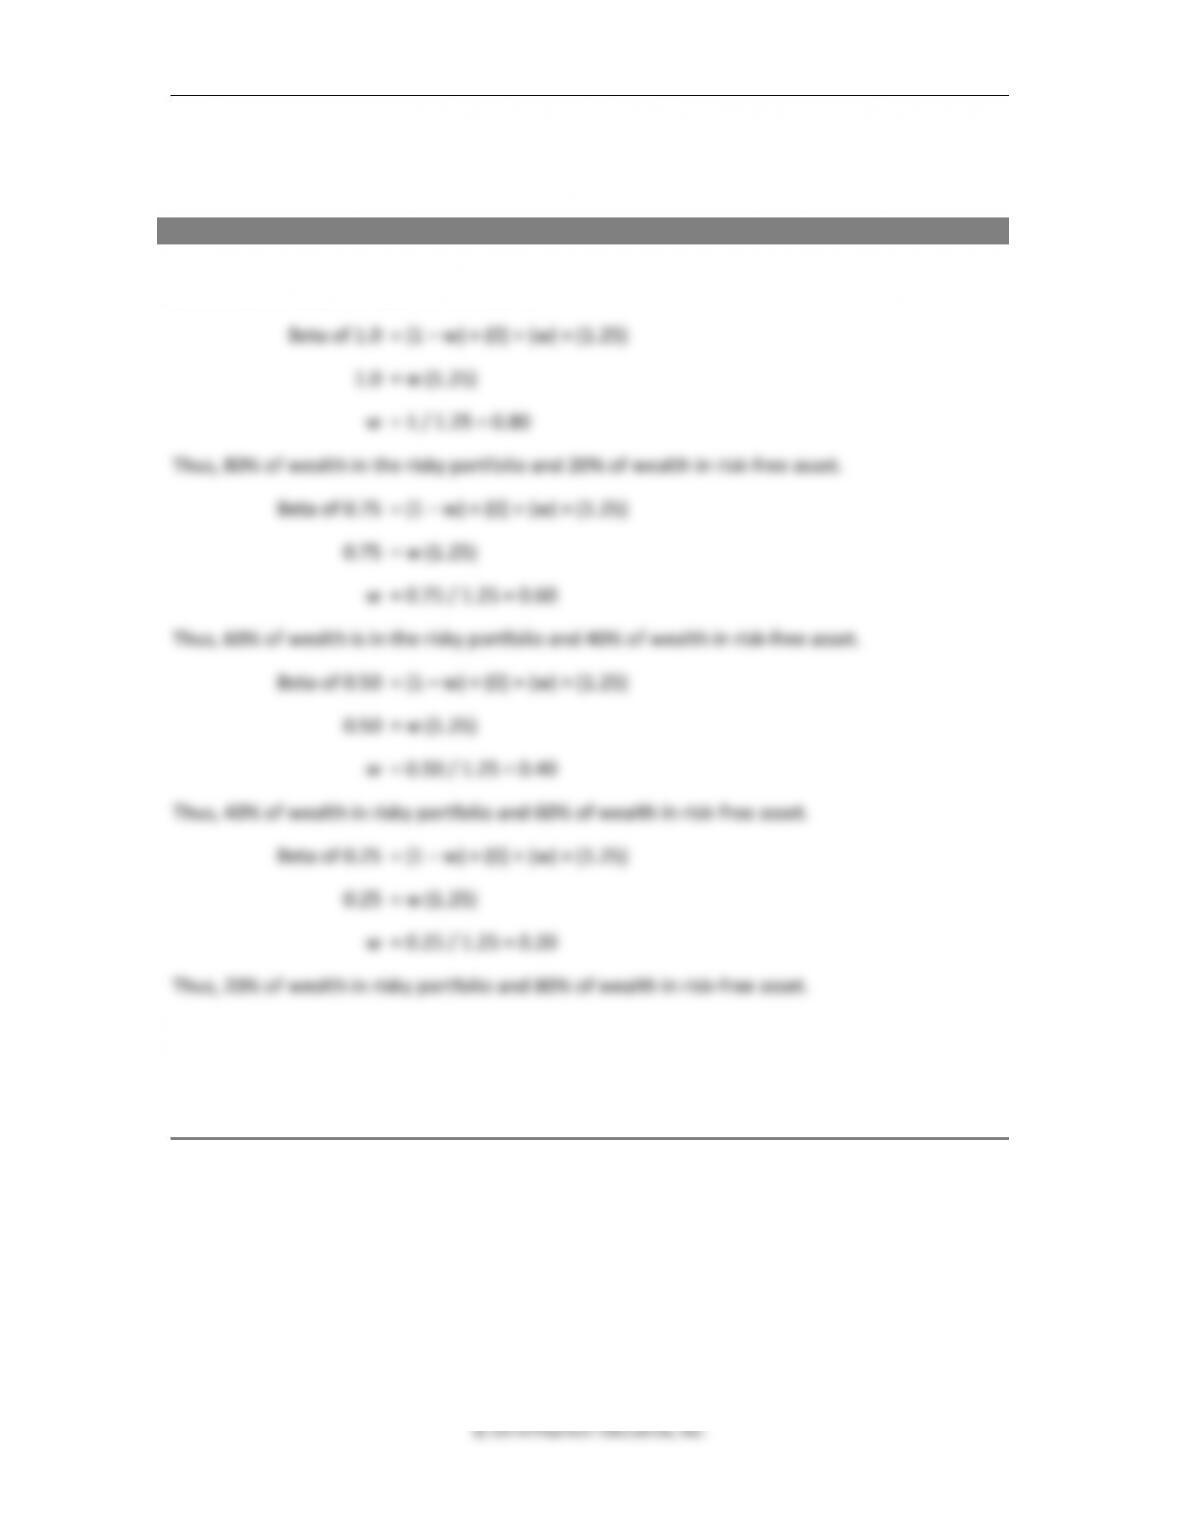
Chapter 8 ◼ Risk and Return 277
should be in the risk-free asset? If he wants a beta of 0.75? If he wants a beta of 0.50? If he
wants a beta of 0.25? Is there a pattern here?
ANSWER
The weight in the risk-free asset is 1 – w, and the weight in the risky portfolio is w and the total
of the two reflects 1 or 100% of his wealth.
The pattern is for every beta change of 0.25, Sam will need to switch 20% of his wealth out of
the risky portfolio and into the risk-free asset. This constant ratio means that there is a linear
relationship between portfolio weights and beta.


