
Chapter 8 ◼ Risk and Return 239
© 2016 Pearson Education, Inc.
Unsystematic risk is firm-specific risk, while systematic risk is risk that varies with changes in
the economy. You can avoid unsystematic risk by diversification. You cannot avoid
systematic risk.

240 Brooks ◼ Financial Management: Core Concepts, 4e
12. What is beta in the finance world? What is standard deviation in the finance world? What
type of risk does each measure? What assumption do you make about the stock when you
use beta as a measure of its risk?
Prepping for Exams
1. a.
10. b.
Problems
1. Profits. What are the profits on the following investments?
Investment
Original Cost
or Invested $
Selling Price of
Investment
Distributions
Received $
Dollar Profit
CD
$500.00
$540.00
$0.00
Stock
$23.00
$34.00
$2.00
Bond
$1,040.00
$980.00
$80.00
Bike
$400.00
$220.00
$0.00
ANSWER
Investment
Original Cost
or Invested $
Selling Price of
Investment
Distributions
Received $
Dollar Profit
CD
$500.00
$540.00
$0.00
$40
Stock
$23.00
$34.00
$2.00
$13
Bond
$1,040.00
$980.00
$80.00
$20
Chapter 8 ◼ Risk and Return 241
© 2016 Pearson Education, Inc.
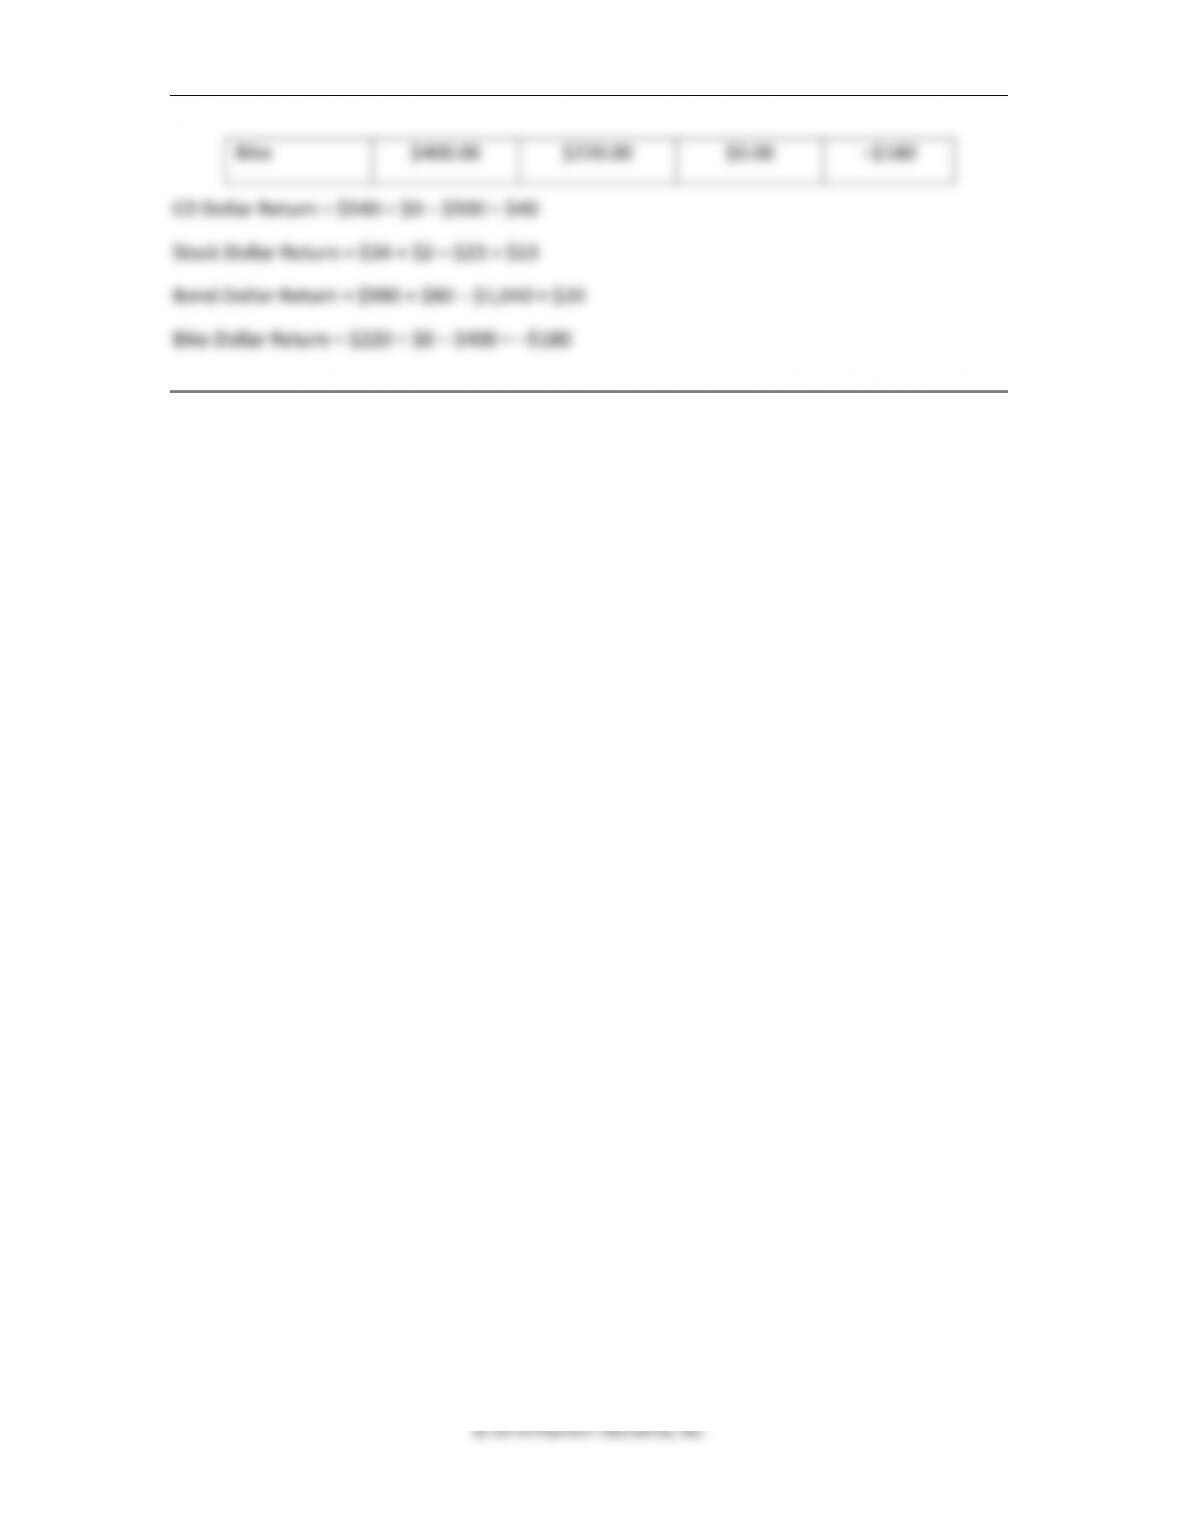
Bike
$400.00
$220.00
$0.00
–$180
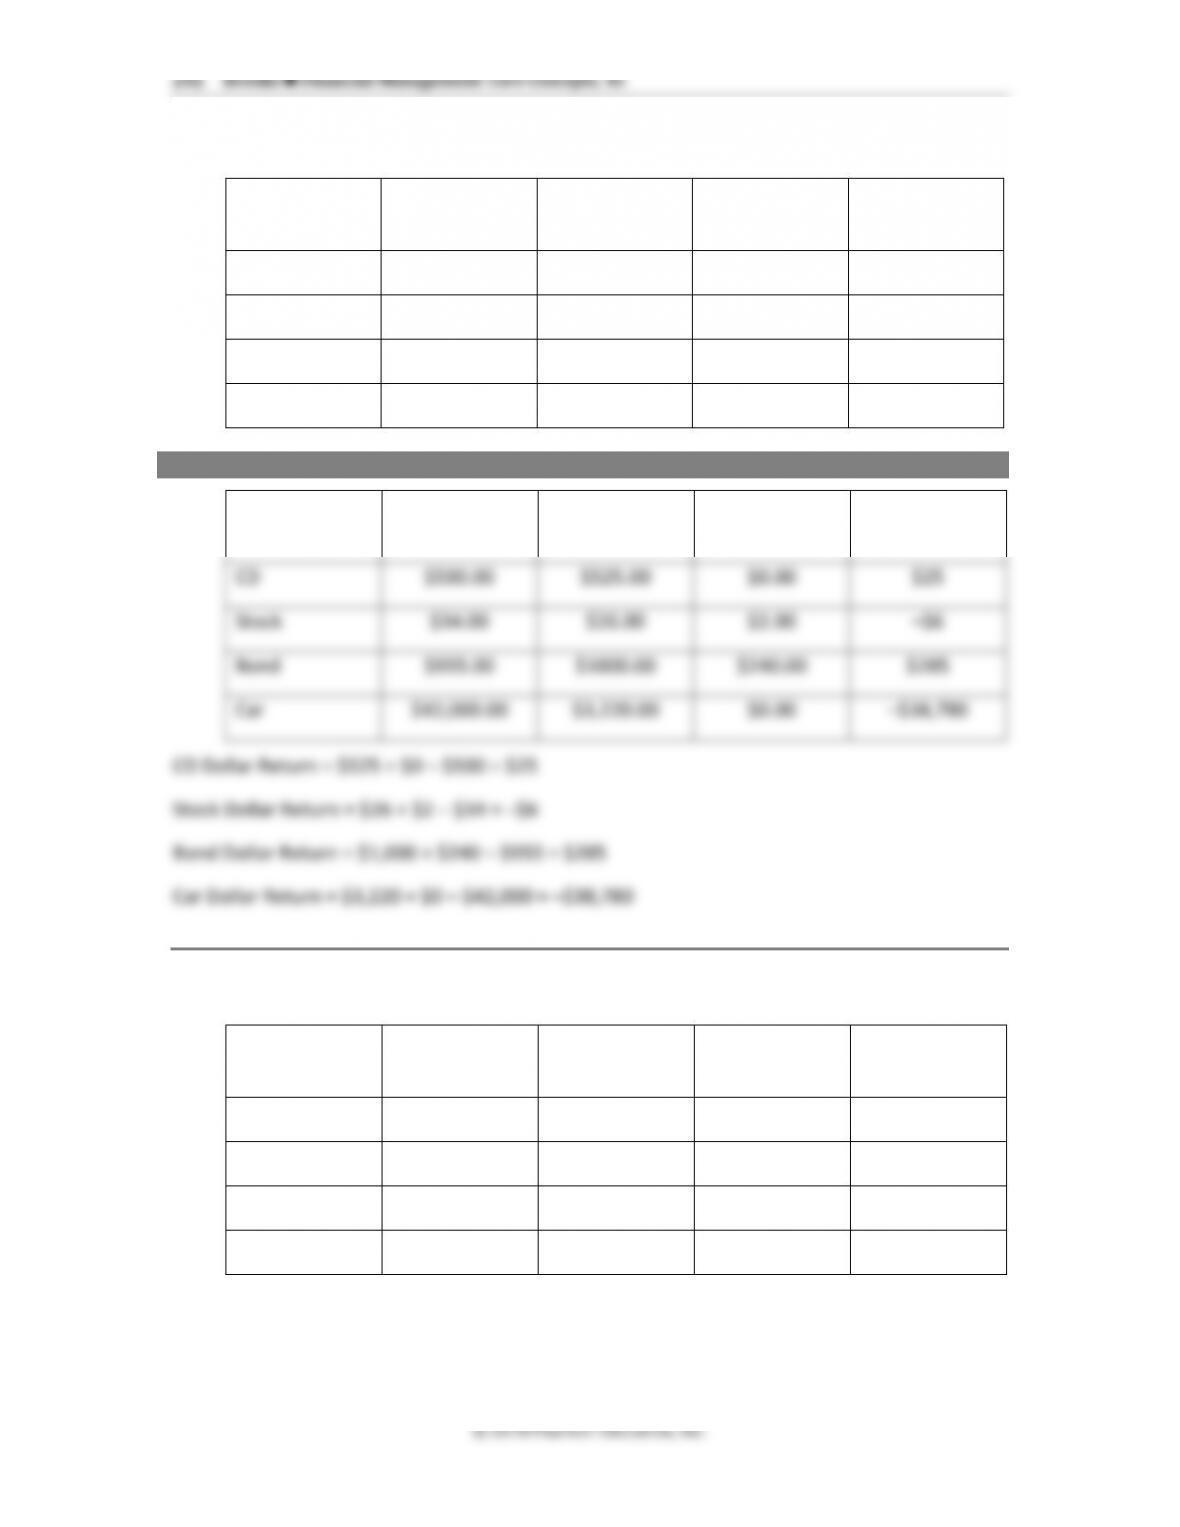
CD Dollar Return = $540 + $0 – $500 = $40
Stock Dollar Return = $34 + $2 – $23 = $13
Bond Dollar Return = $980 + $80 – $1,040 = $20
Bike Dollar Return = $220 + $0 – $400 = –$180
Chapter 8 ◼ Risk and Return 243
ANSWER
Investment
Original Cost or
Invested $
Selling Price of
Investment
Distributions
Received $
Percent Return
CD
$500.00
$540.00
$0.00
8.00%
Stock
$23.00
$34.00
$2.00
56.52%
Bond
$1,040.00
$980.00
$80.00
1.92%
Bike
$400.00
$220.00
$0.00
–45.00%
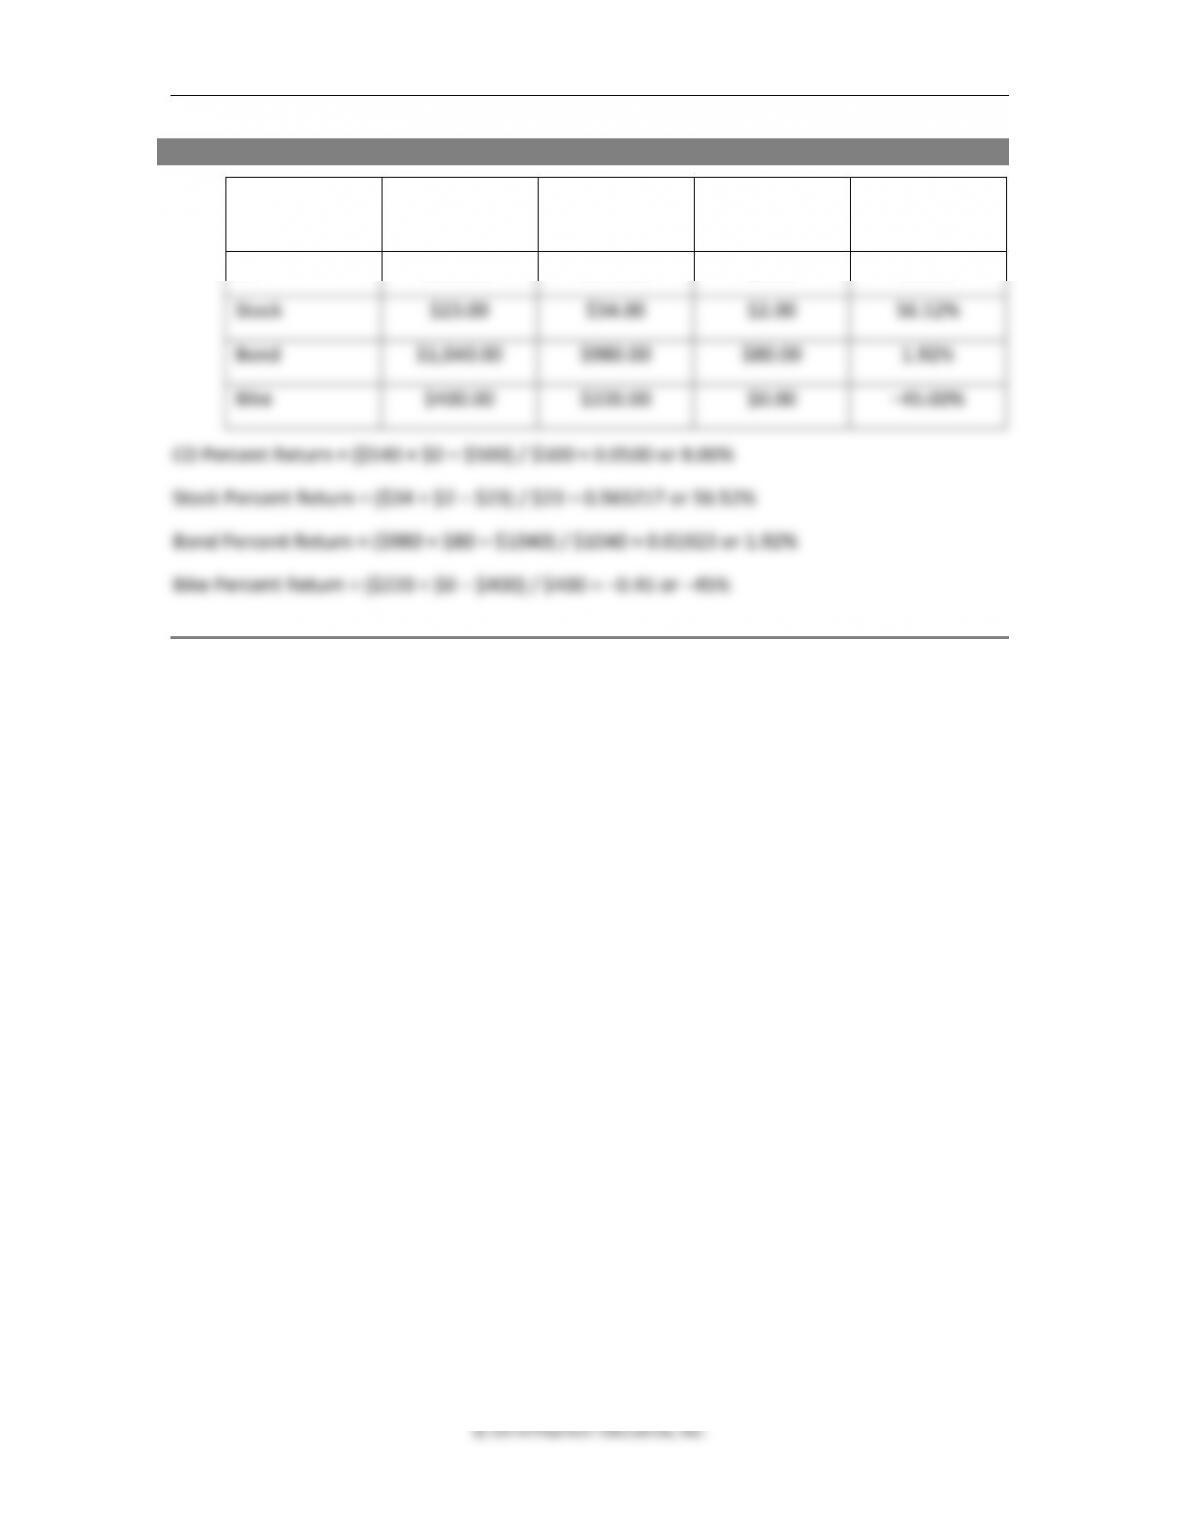
CD Percent Return = ($540 + $0 – $500) / $500 = 0.0500 or 8.00%
Stock Percent Return = ($34 + $2 – $23) / $23 = 0.565217 or 56.52%
Bond Percent Return = ($980 + $80 – $1040) / $1040 = 0.01923 or 1.92%
Bike Percent Return = ($220 + $0 – $400) / $400 = –0.45 or –45%
Chapter 8 ◼ Risk and Return 245
© 2016 Pearson Education, Inc.
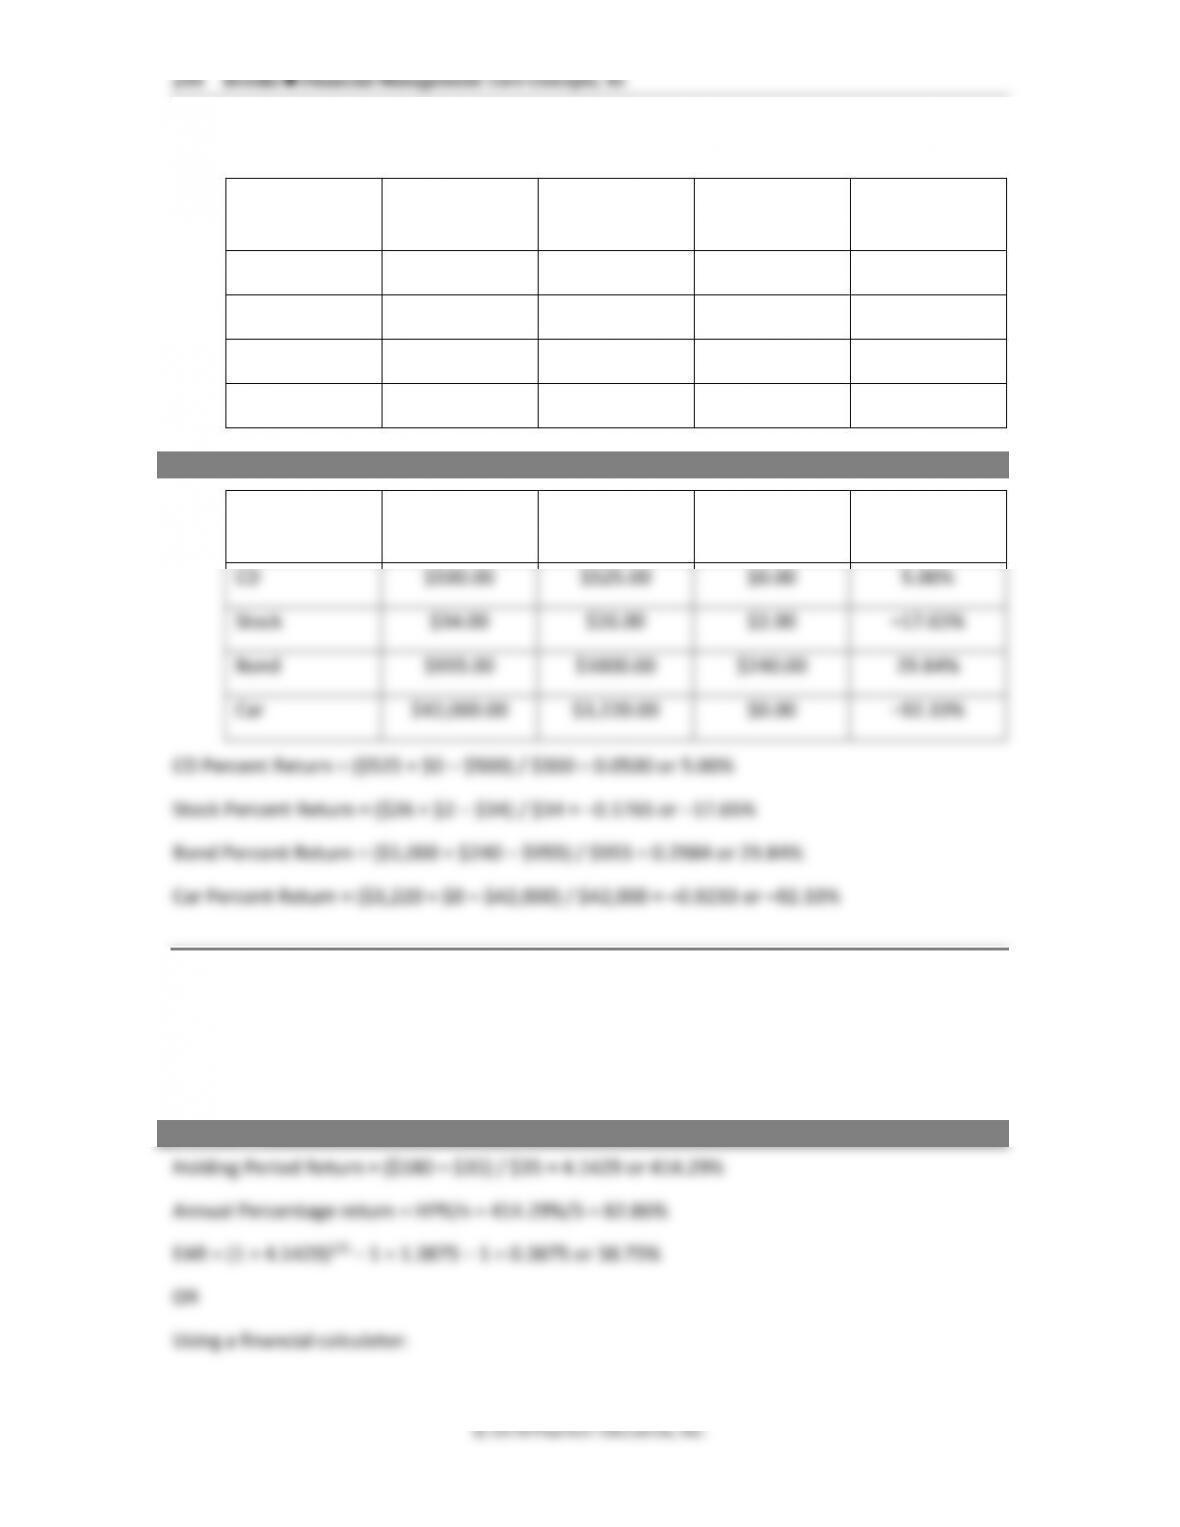
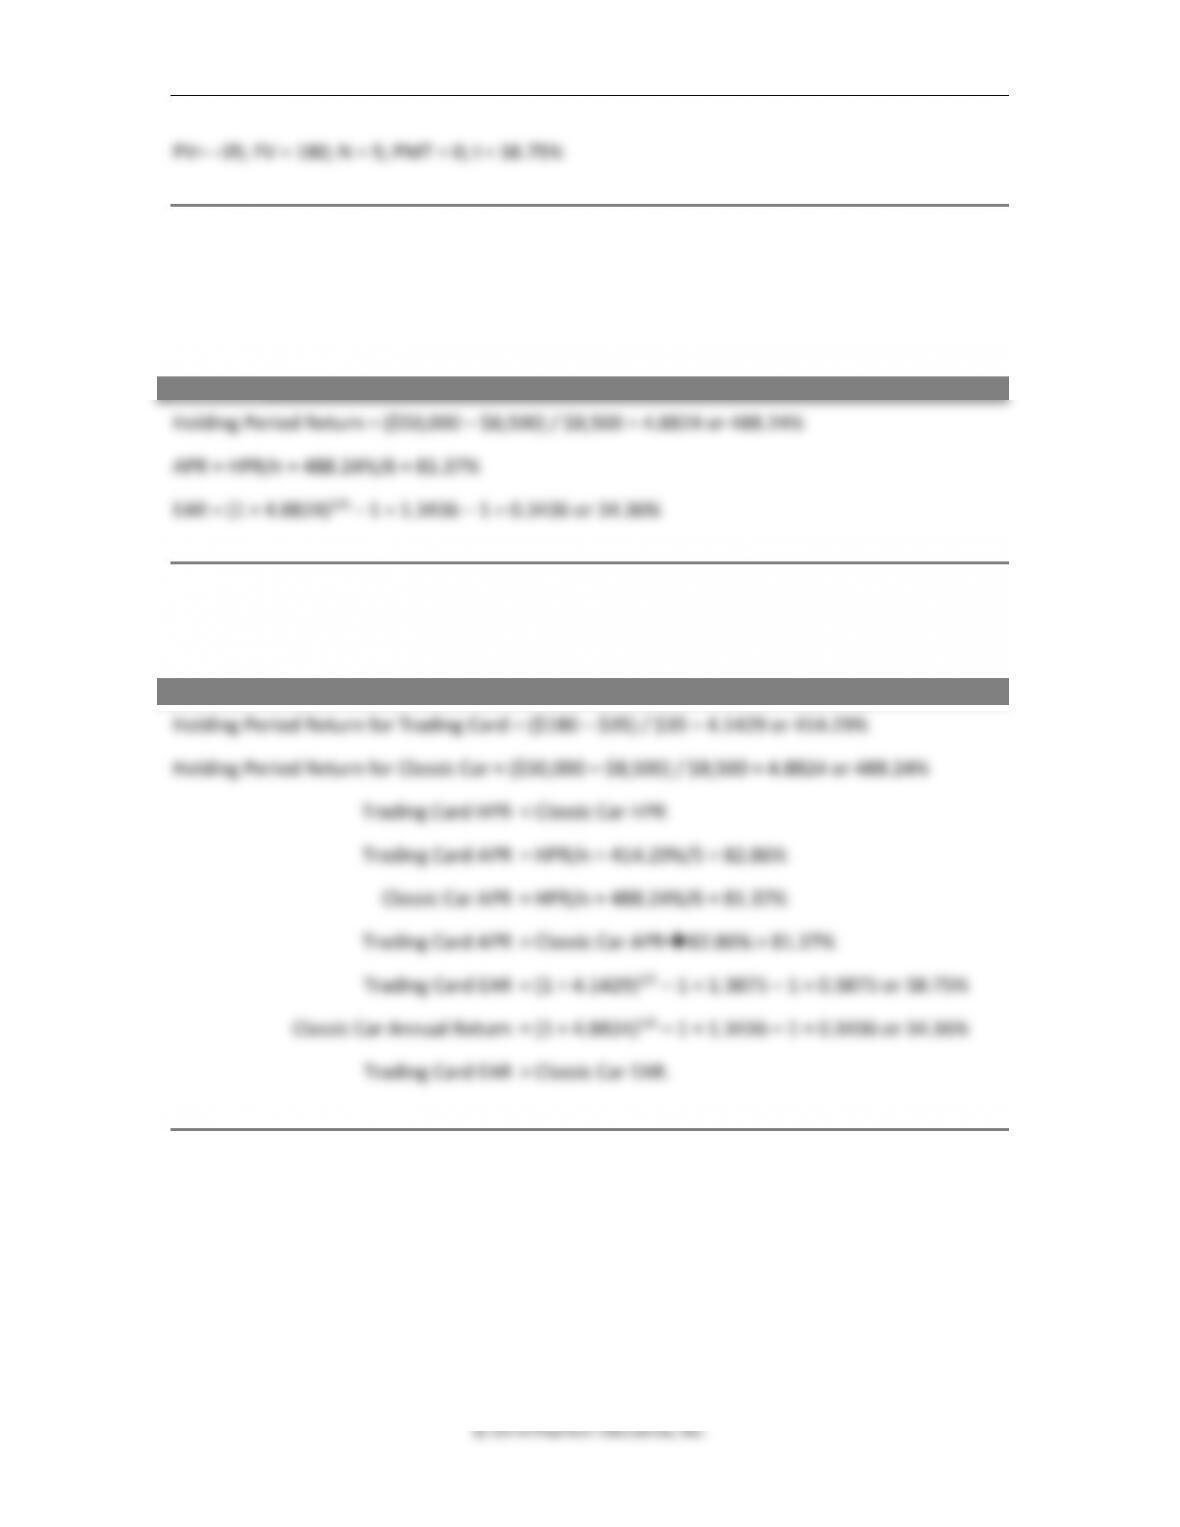
PV= –35; FV = 180; N = 5; PMT = 0; I = 38.75%
6. Holding Period and Annual (Investment) Returns. Bohenick Classic Automobiles restores
and rebuilds old classic cars. The company purchased and restored a classic 1957
Thunderbird convertible six years ago for $8,500. Today at auction, the car sold for $50,000.
What are the holding period return and the annual return on this investment?
ANSWER
7. Comparison of returns. Looking back at Problems 5 and 6, which investment had the higher
holding period return? Which had the higher annual return?
ANSWER
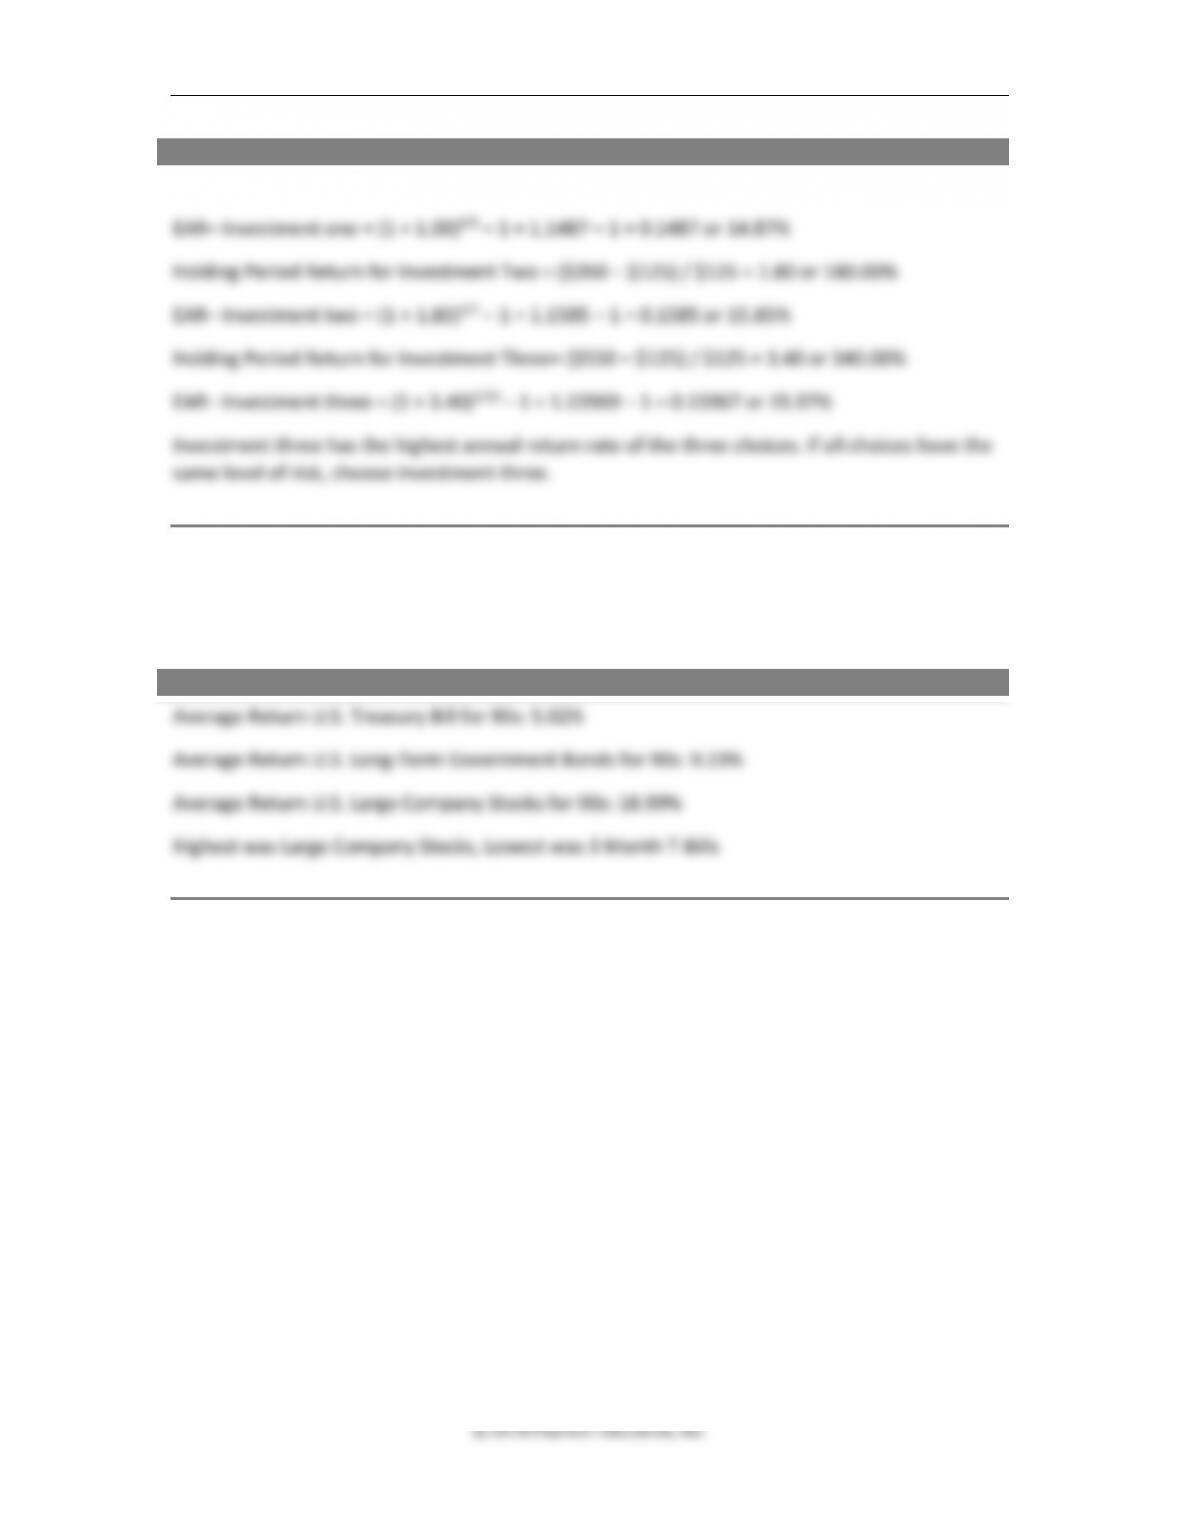
8. Comparison of returns. WG Investors are looking at three different investment
opportunities. Investment one is a five-year investment with a cost of $125 and a promised
payout of $250 at maturity. Investment two is a seven-year investment with a cost of $125
and a promised payout of $350. Investment three is a ten-year investment with a cost of
$125 and a promised payout of $550. WG Investors can only take on one of the three
investments. Assuming all three investment opportunities have the same level of risk,
calculate the annual return for each investment, and select the best investment choice.
246 Brooks ◼ Financial Management: Core Concepts, 4e
ANSWER
Holding Period Return for Investment One = ($250 – $125) / $125 = 1.00 or 100.00%
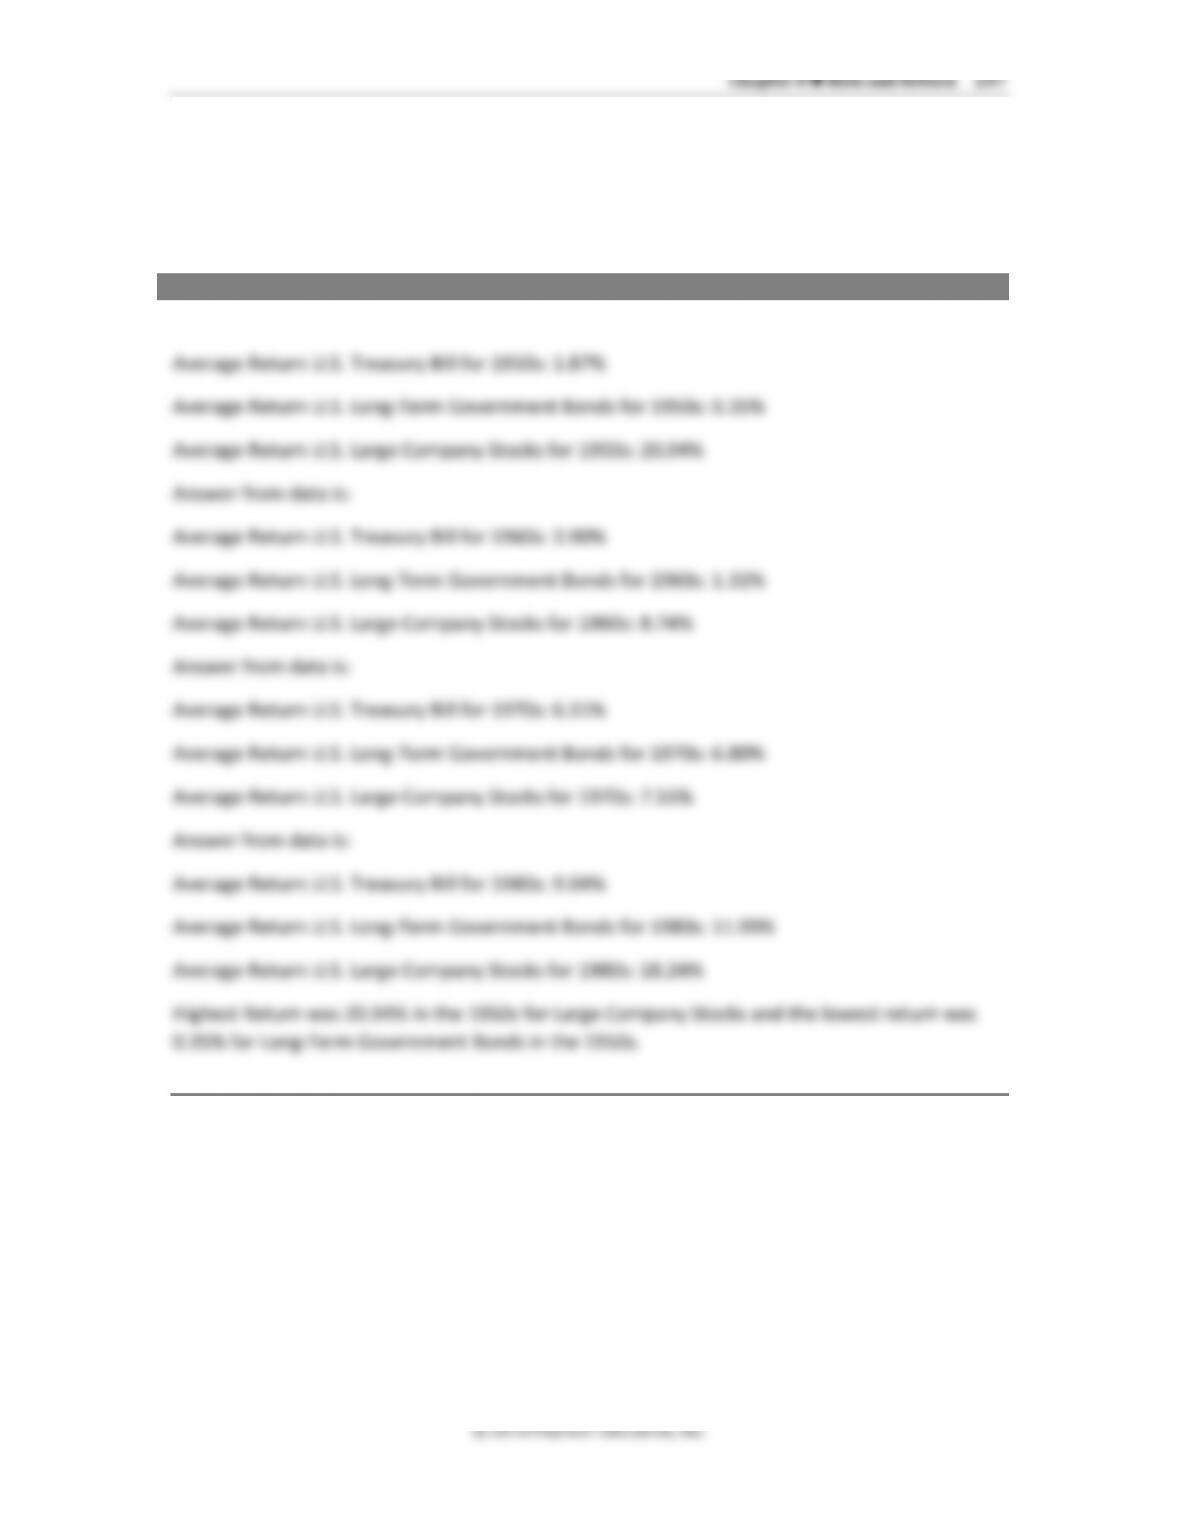
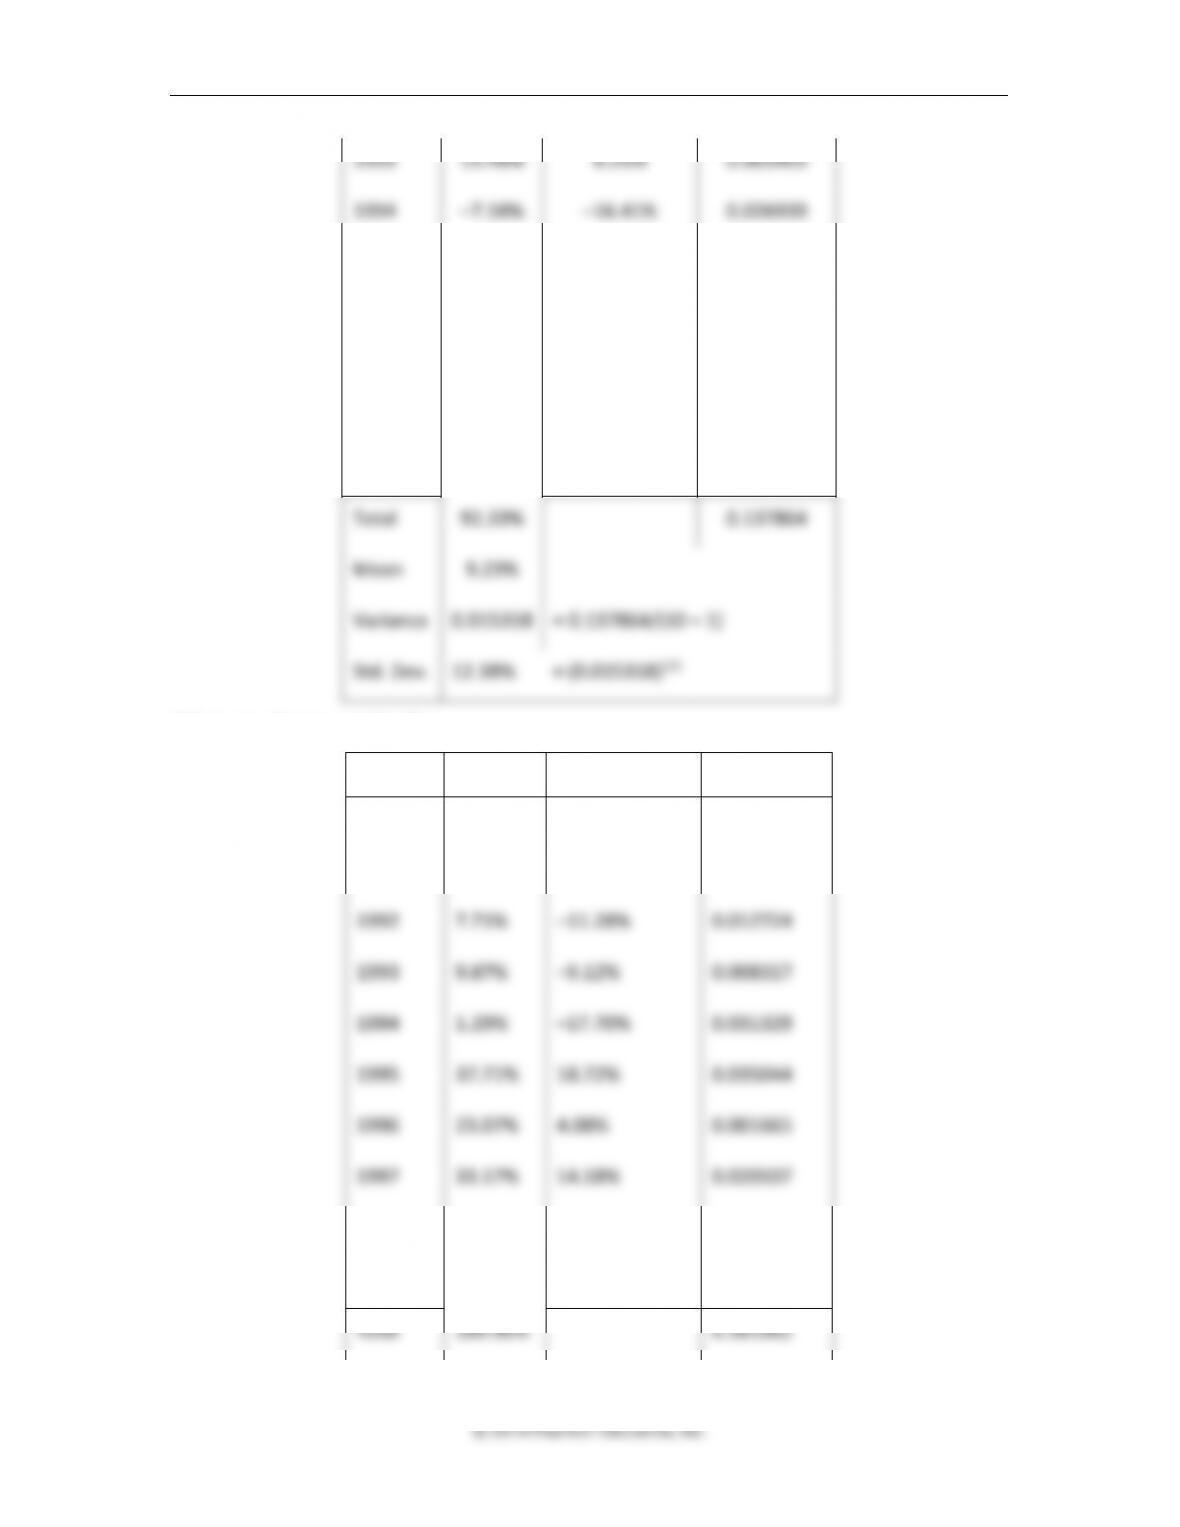
9. Historical returns. Calculate the average return of U.S. Treasury bills, long-term government
bonds, and large company stocks for 1990 to 1999 from Table 8.1. Which had the highest
and which had the lowest return?
ANSWER
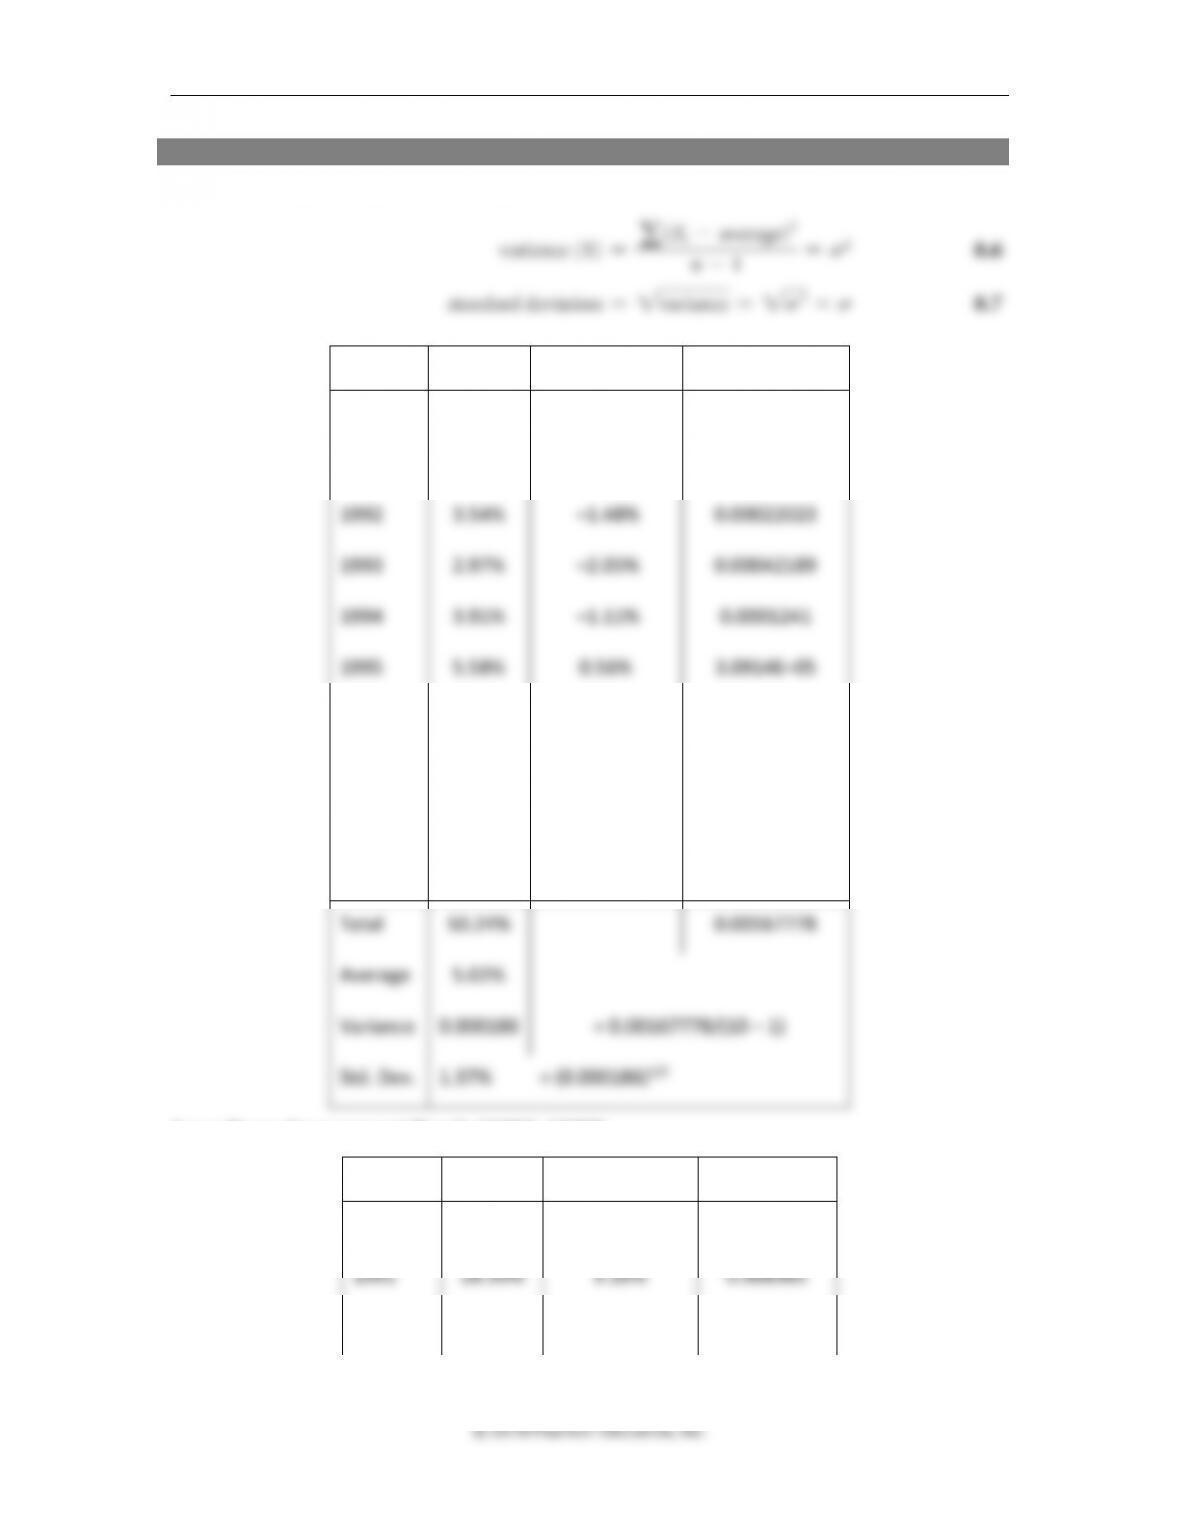
248 Brooks ◼ Financial Management: Core Concepts, 4e
ANSWER
U.S. Treasury Bills (1990–1999)
Year
Return
(R – Average)
(R – Average)2
1990
7.86%
2.84%
0.00080429
1991
5.65%
0.63%
3.9188E–05
1992
3.54%
–1.48%
0.00022023
1993
2.97%
–2.05%
0.00042189
1994
3.91%
–1.11%
0.0001241
1995
5.58%
0.56%
3.0914E–05
1996
5.50%
0.48%
2.2658E–05
1997
5.32%
0.30%
8.7616E–06
1998
5.11%
0.09%
7.396E–07
1999
4.80%
–0.22%
5.0176E–06
Total
50.24%
0.00167778
Average
5.02%
Variance
0.000186
= 0.00167778/(10 – 1)
Std. Dev.
1.37%
= (0.000186)1/2
Long-Term Government Bonds (1990–1999)
Year
Return
(R – Mean)
(R – Mean)2
1990
7.13%
–2.10%
0.000442
1991
18.39%
9.16%
0.008385
1992
7.79%
–1.44%
0.000208
Chapter 8 ◼ Risk and Return 249
1993
15.48%
6.25%
0.003903
1994
–7.18%
–16.41%
0.026939
1995
31.67%
22.44%
0.050342
1996
–0.81%
–10.04%
0.010086
1997
15.08%
5.85%
0.003419
1998
13.52%
4.29%
0.001838
1999
–8.74%
–17.97%
0.032303
Total
92.33%
0.137864
Mean
9.23%
Variance
0.015318
= 0.137864/(10 – 1)
Std. Dev.
12.38%
= (0.015318)1/2
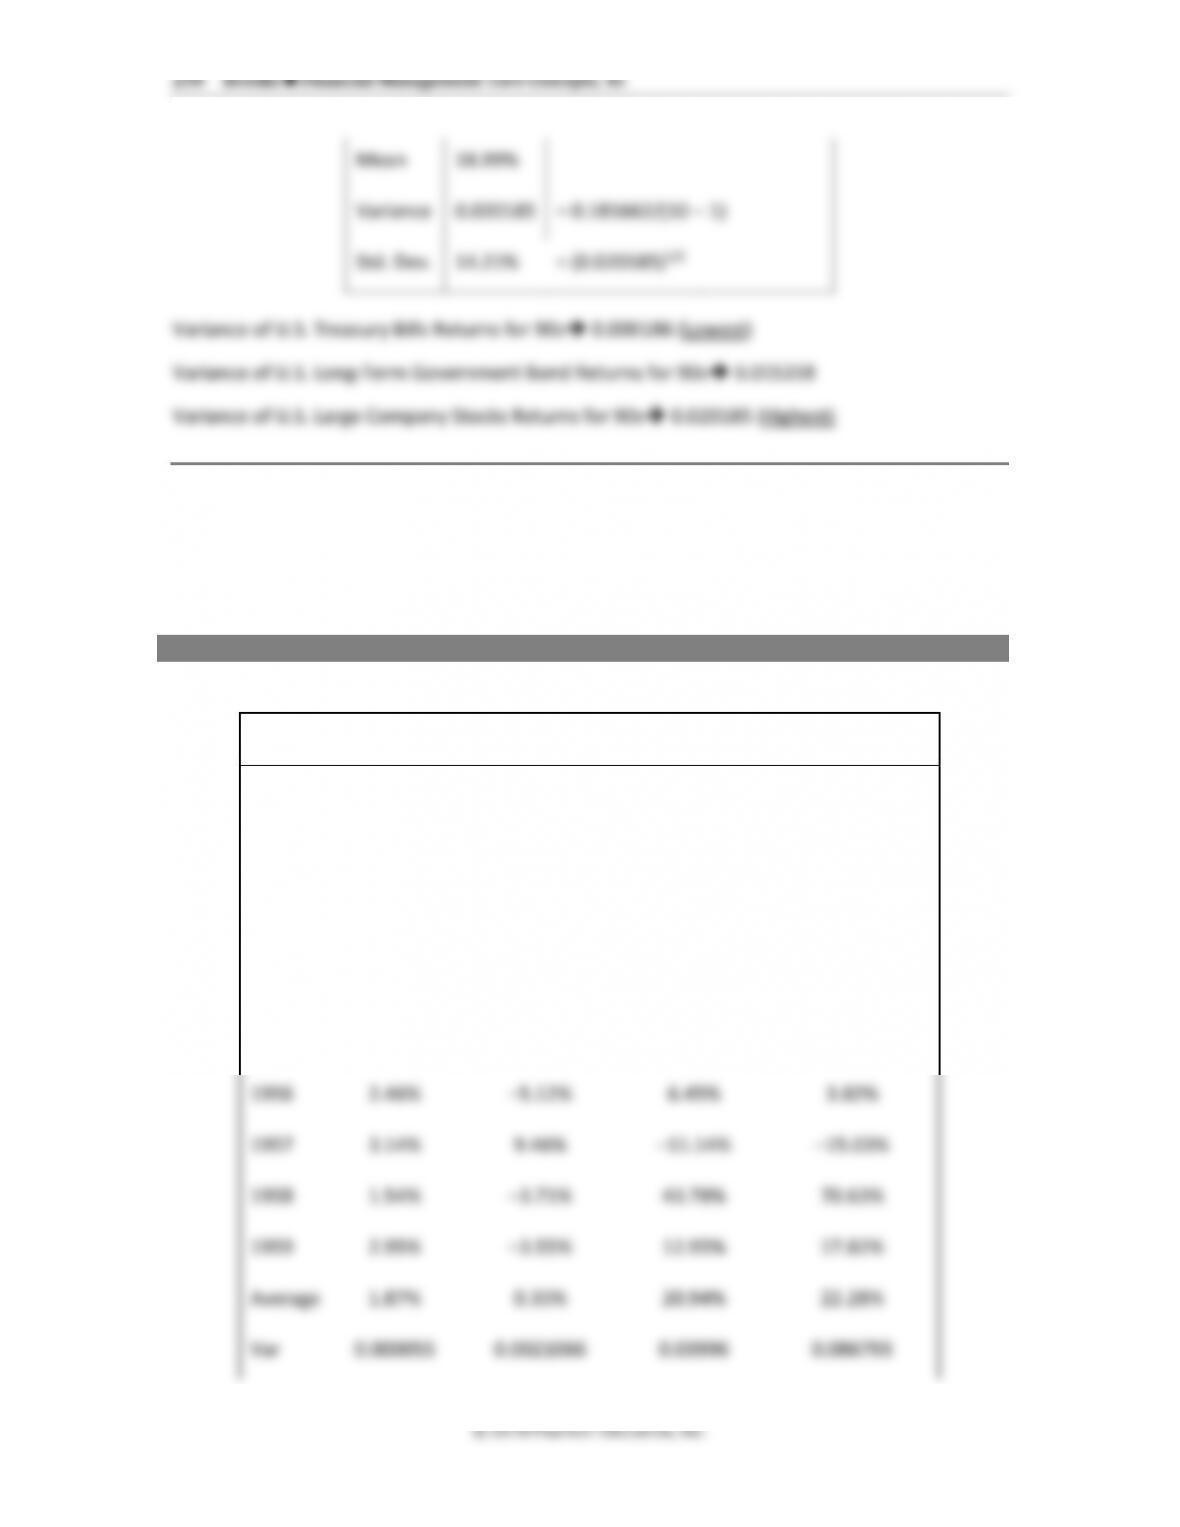
U.S. Large Company Stocks
Year
Return
(R – Mean)
(R – Mean)2
1990
–3.20%
–22.19%
0.04924
1991
30.66%
11.67%
0.013619
1992
7.71%
–11.28%
0.012724
1993
9.87%
–9.12%
0.008317
1994
1.29%
–17.70%
0.031329
1995
37.71%
18.72%
0.035044
1996
23.07%
4.08%
0.001665
1997
33.17%
14.18%
0.020107
1998
28.58%
9.59%
0.009197
1999
21.04%
2.05%
0.00042
Total
189.90%
0.181662
Chapter 8 ◼ Risk and Return 251
© 2016 Pearson Education, Inc.
Year
T-Bills
L-T Gov. Bonds
Large Stocks
Small Co. Stocks
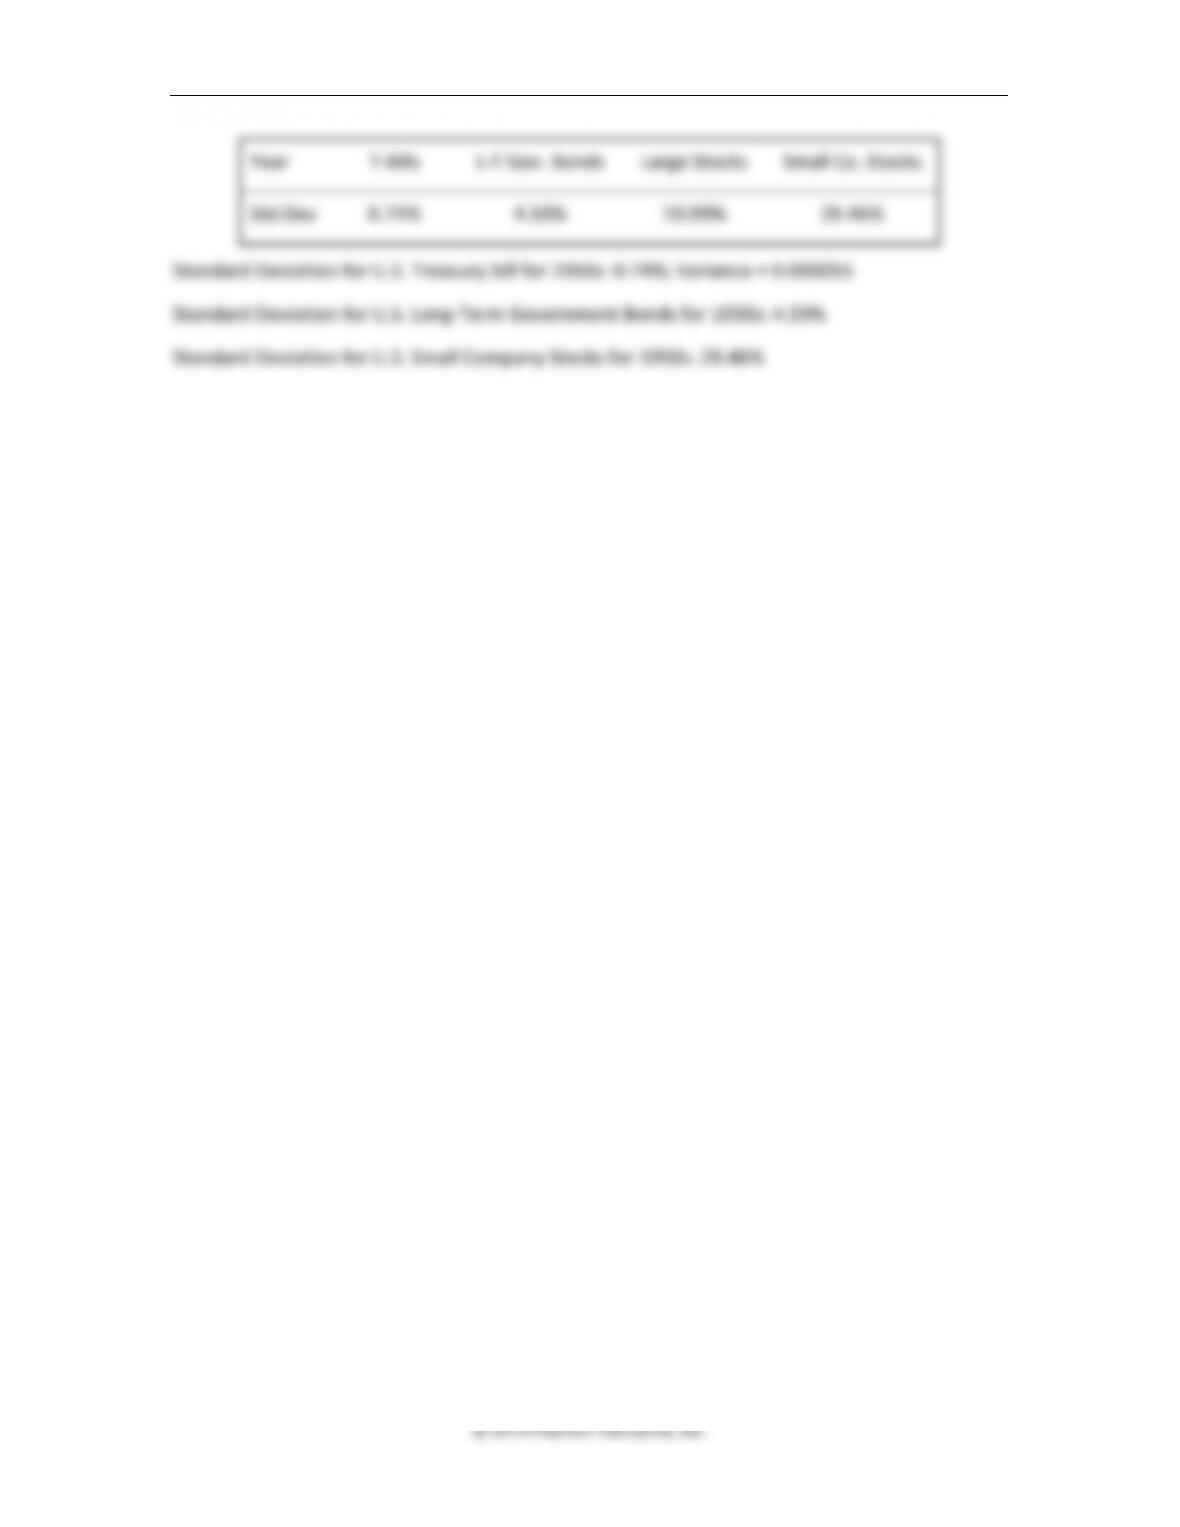
Std.Dev
0.74%
4.59%
19.99%
29.46%
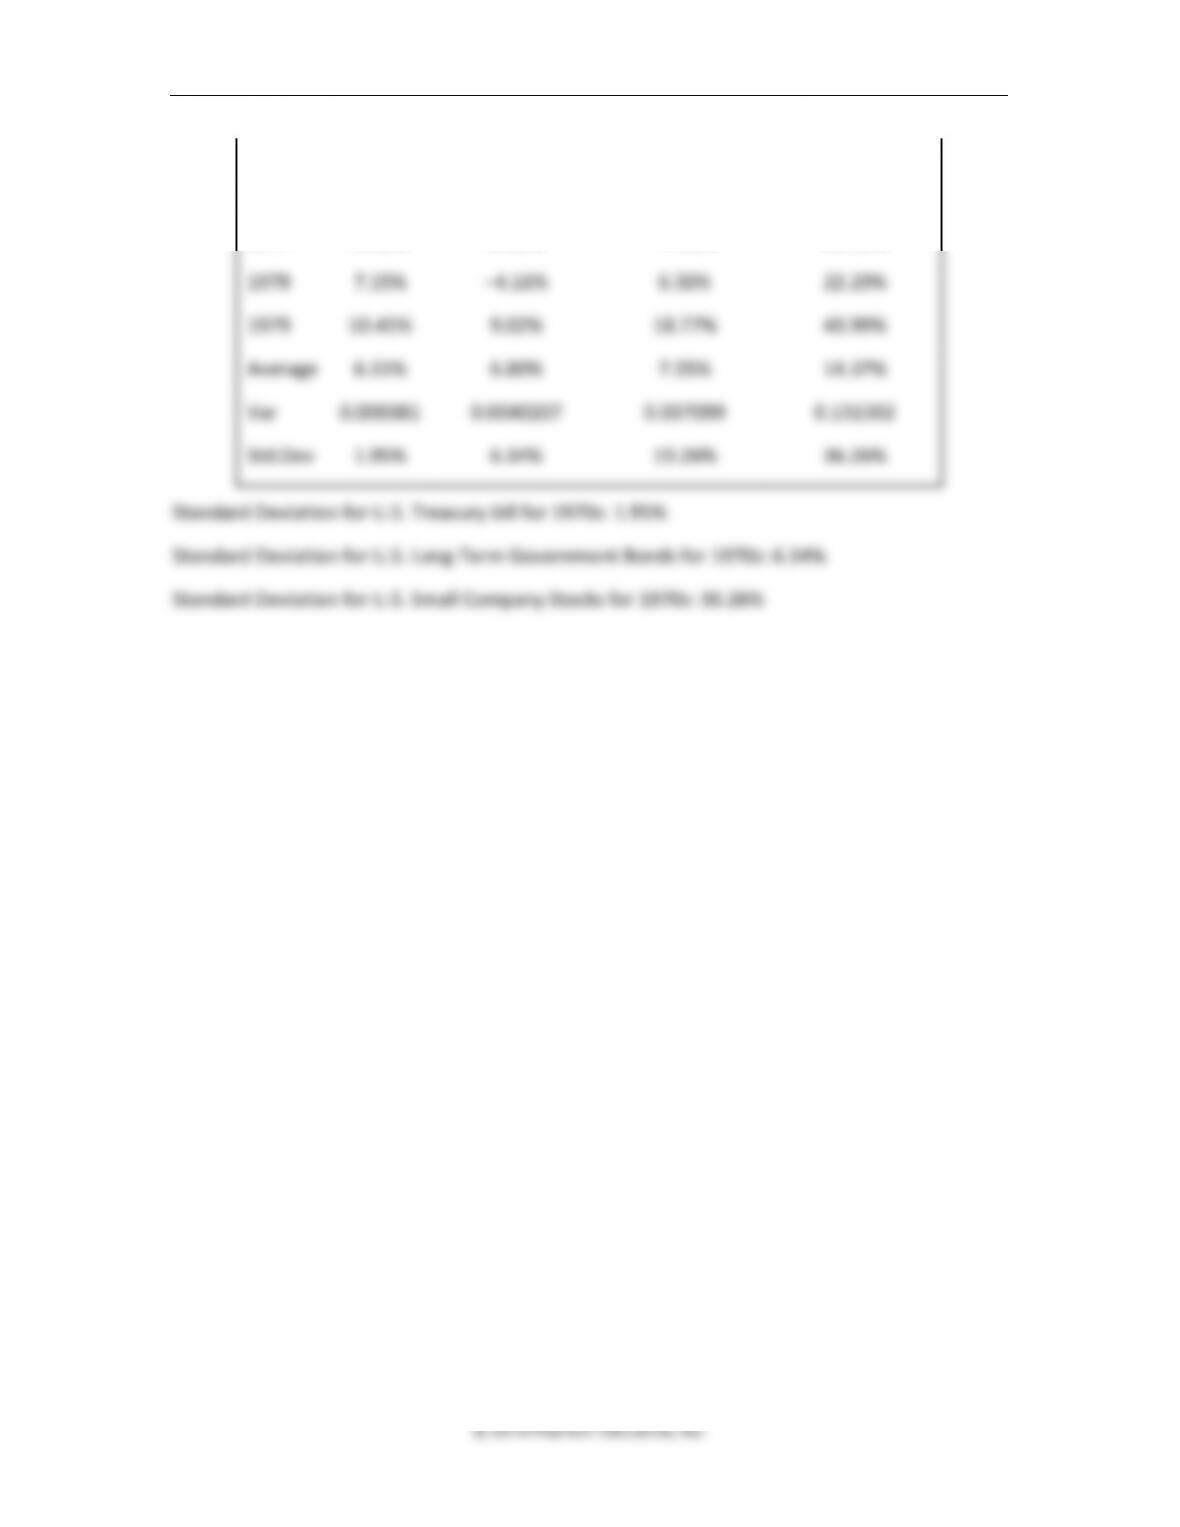
Standard Deviation for U.S. Treasury bill for 1950s: 0.74%; Variance = 0.000055
Standard Deviation for U.S. Long-Term Government Bonds for 1950s: 4.59%
Standard Deviation for U.S. Small Company Stocks for 1950s: 29.46%
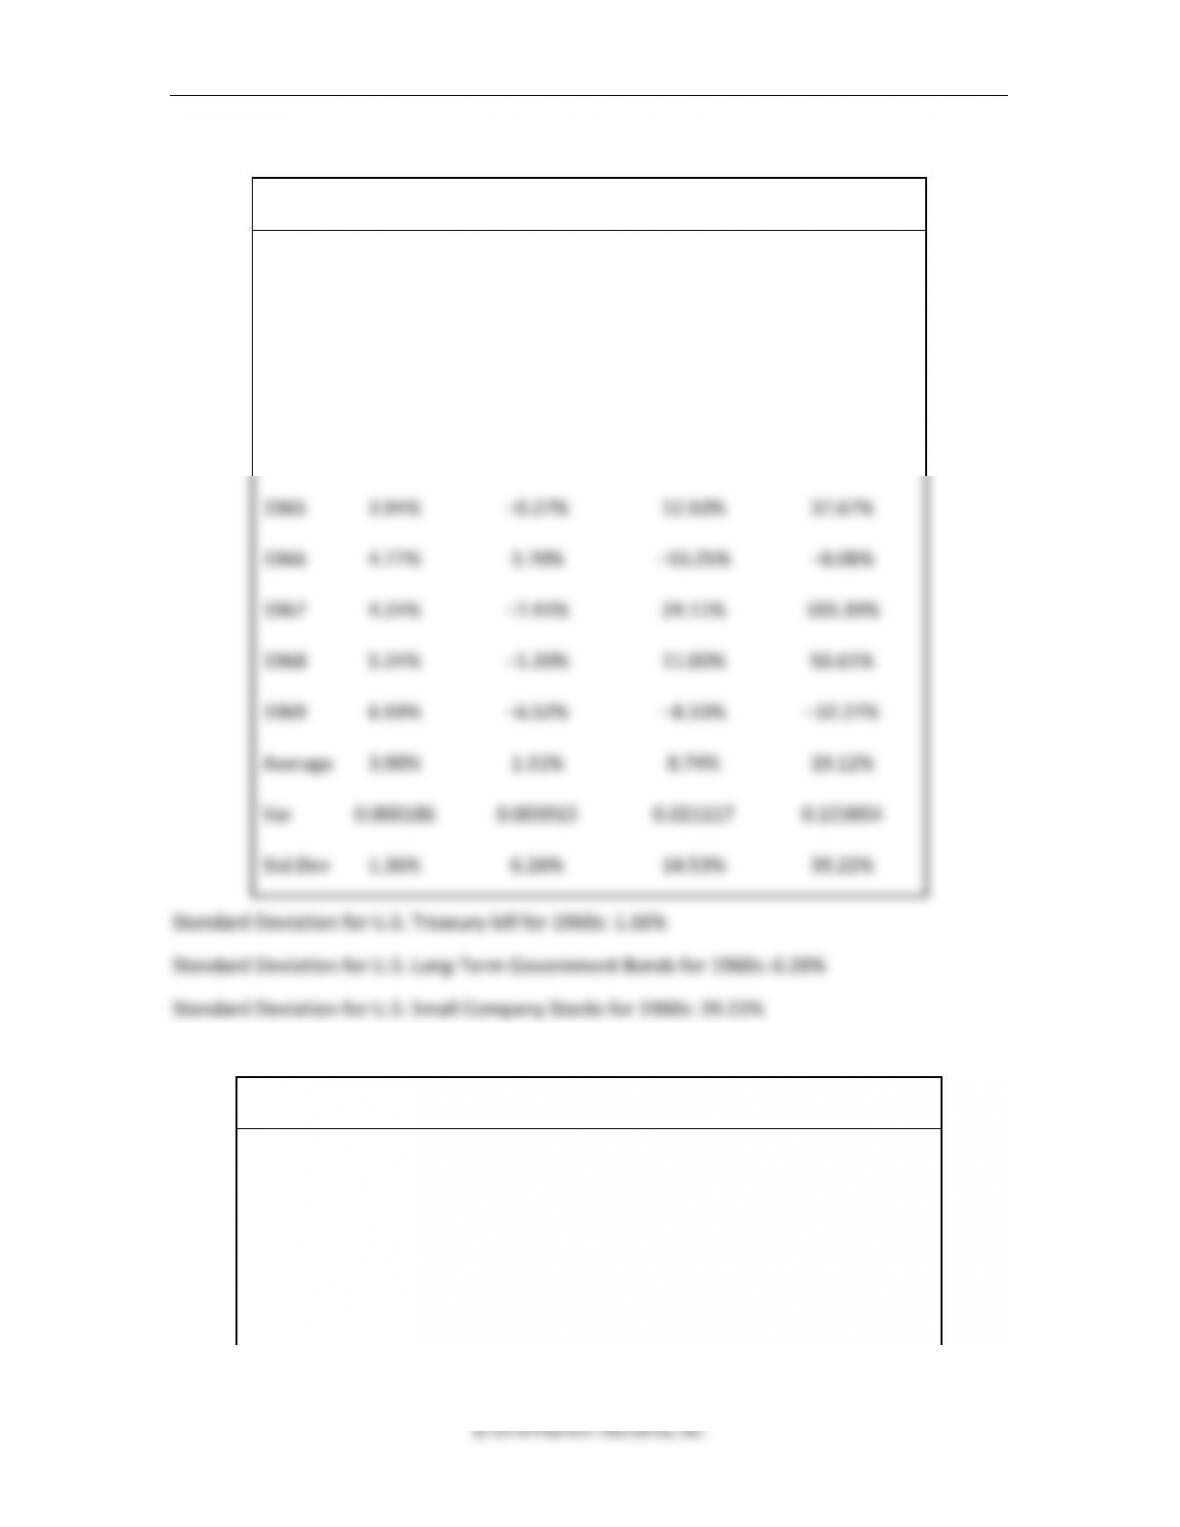
252 Brooks ◼ Financial Management: Core Concepts, 4e
1960s
Year
T-Bills
L-T Gov. Bonds
Large Stocks
Small Co. Stocks
1960
2.66%
13.78%
0.19%
–5.16%
1961
2.13%
0.19%
27.63%
30.48%
1962
2.72%
6.81%
–8.79%
–16.41%
1963
3.12%
–0.49%
22.63%
12.20%
1964
3.54%
4.51%
16.67%
18.75%
1965
3.94%
–0.27%
12.50%
37.67%
1966
4.77%
3.70%
–10.25%
–8.08%
1967
4.24%
–7.41%
24.11%
103.39%
1968
5.24%
–1.20%
11.00%
50.61%
1969
6.59%
–6.52%
–8.33%
–32.27%
Average
3.90%
1.31%
8.74%
19.12%
Var
0.000186
0.003915
0.021117
0.153854
Std.Dev
1.36%
6.26%
14.53%
39.22%
1970s
Year
T-Bills
L-T Gov. Bonds
Large Stocks
Small Co. Stocks
1970
6.50%
12.69%
4.10%
–16.54%
1971
4.34%
17.47%
14.17%
18.44%
1972
3.81%
5.55%
19.14%
–0.62%
1973
6.91%
1.40%
–14.75%
–40.54%
1974
7.93%
5.53%
–26.40%
–29.74%
Chapter 8 ◼ Risk and Return 253
1975
5.80%
8.50%
37.26%
69.54%
1976
5.06%
11.07%
23.98%
54.81%
1977
5.10%
0.90%
–7.26%
22.02%
1978
7.15%
–4.16%
6.50%
22.29%
1979
10.45%
9.02%
18.77%
43.99%
Average
6.31%
6.80%
7.55%
14.37%
Var
0.000381
0.0040207
0.037099
0.131502
Std.Dev
1.95%
6.34%
19.26%
36.26%
254 Brooks ◼ Financial Management: Core Concepts, 4e
1980s
Year
T-Bills
L-T Gov. Bonds
Large Stocks
Small Co. Stocks
1980
11.57%
13.17%
32.48%
35.34%
1981
14.95%
3.61%
–4.98%
7.79%
1982
10.71%
6.52%
22.09%
27.44%
1983
8.85%
–0.53%
22.37%
34.49%
1984
10.02%
15.29%
6.46%
–14.02%
1985
7.83%
32.68%
32.00%
28.21%
1986
6.18%
23.96%
18.40%
3.40%
1987
5.50%
–2.65%
5.34%
–13.95%
1988
6.44%
8.40%
16.86%
21.72%
1989
8.32%
19.49%
31.34%
8.37%
Average
9.04%
11.99%
18.24%
13.88%
Var
0.0008
0.0124889
0.016021
0.034069
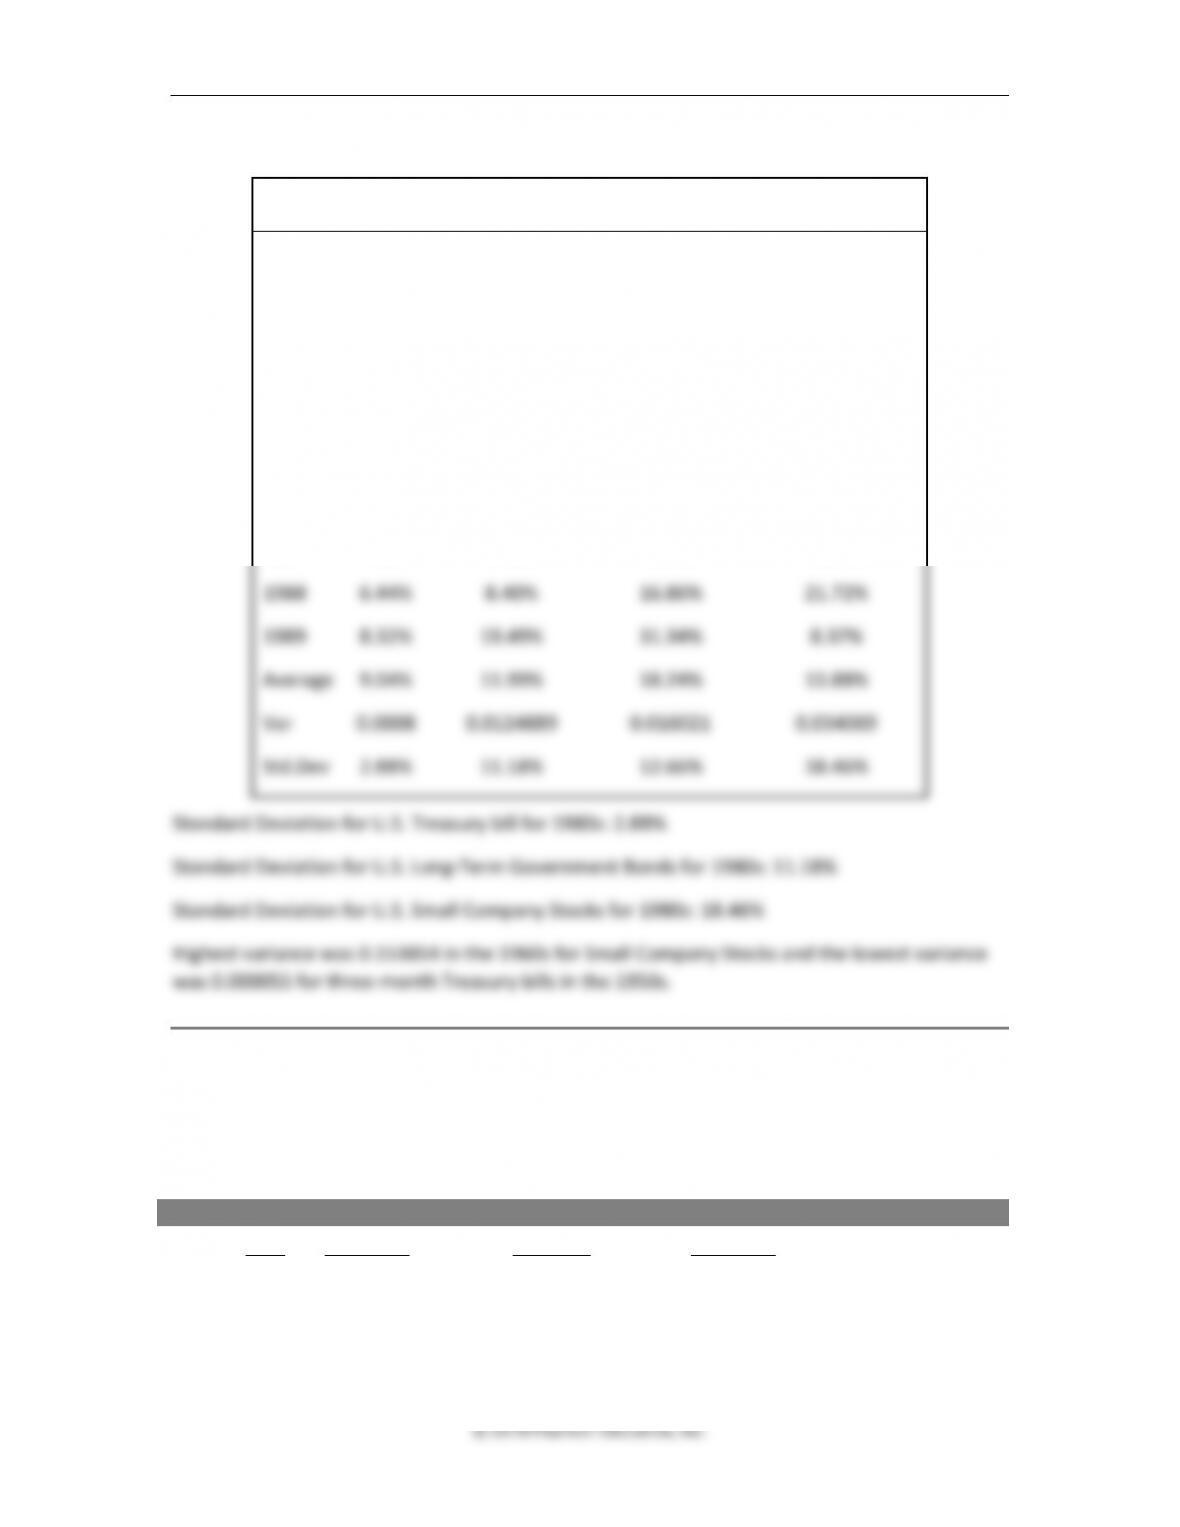
Std.Dev
2.88%
11.18%
12.66%
18.46%
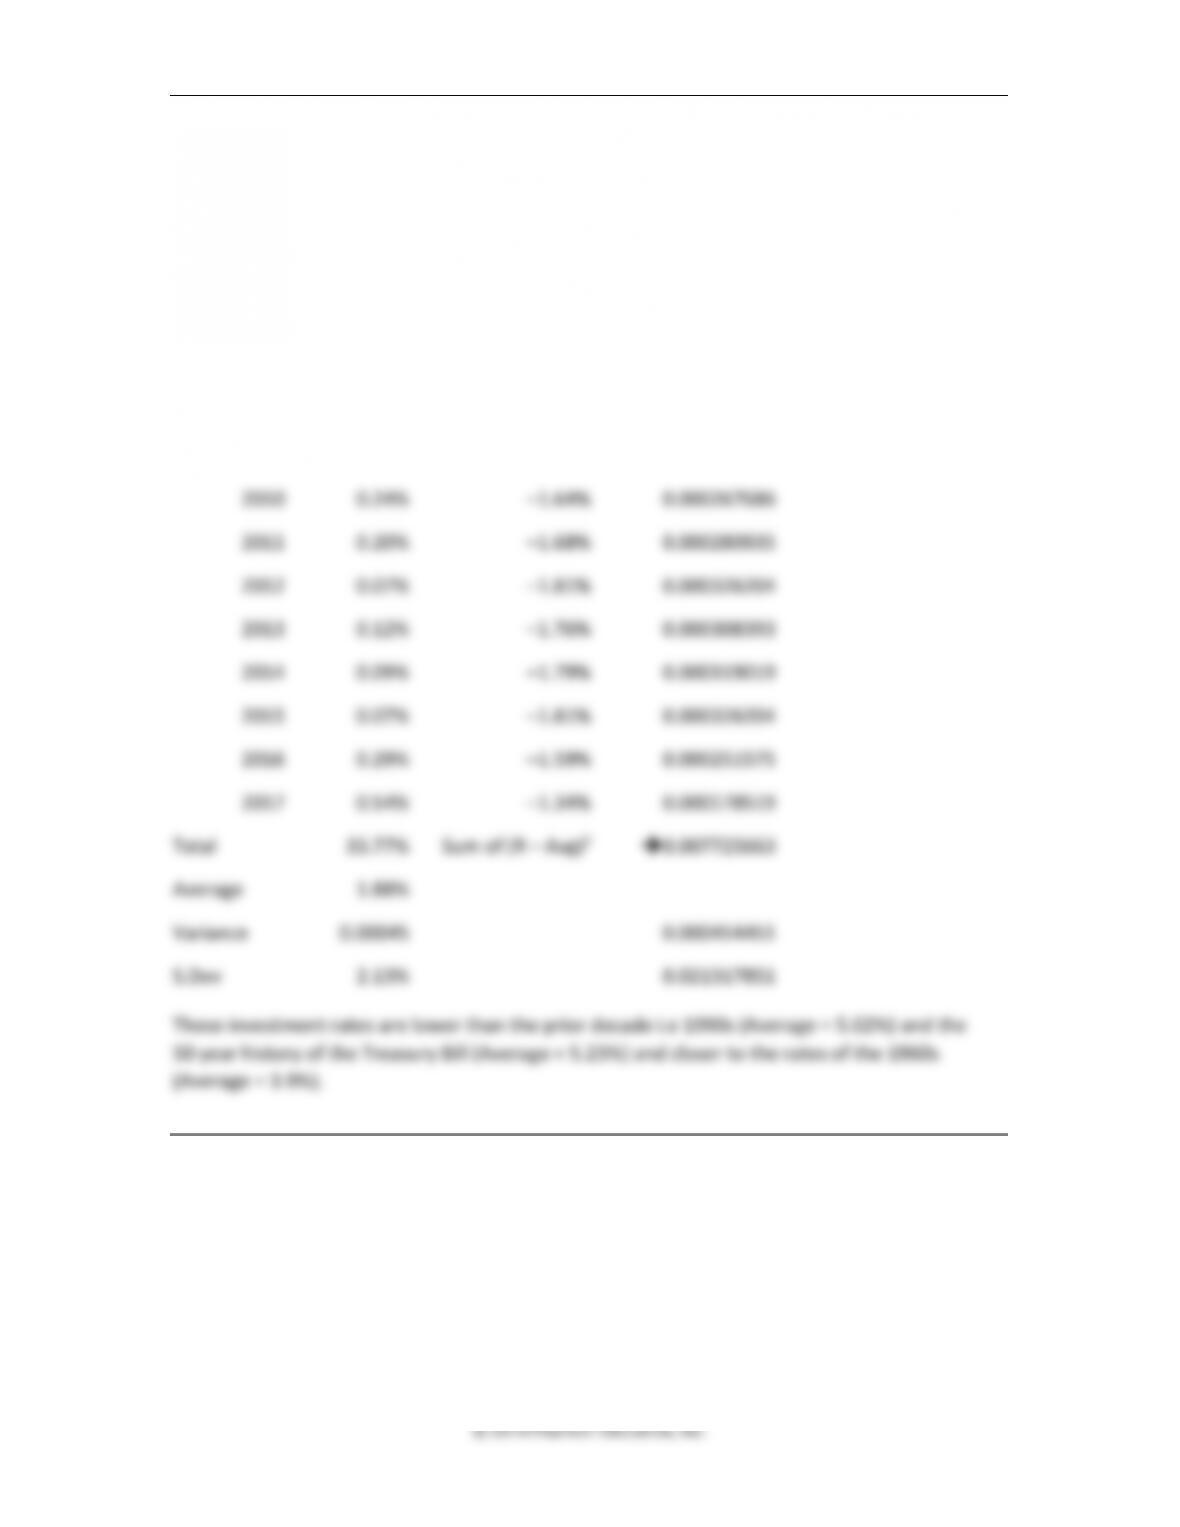
13. Treasury rates. Find the thirteen-week Treasury bill rates for the years 2000 to 2017 shown
in the table below. What was the average from 2000 to 2017? What was the standard
deviation of this sample of auction rates? How does it compare with the data presented in
Table 8.1?
ANSWER:
Year
T-Bill rate
(R – Avg)
(R – Avg)2
2000
5.32%
3.44%
0.001186037
2001
6.60%
4.72%
0.002231513
Chapter 8 ◼ Risk and Return 255
2002
2.15%
0.27%
7.50151E-06
2003
1.35%
–0.53%
2.76793E-05
2004
0.98%
–0.90%
8.03015E-05
2005
2.20%
0.32%
1.04904E-05
2006
4.12%
2.24%
0.000503504
2007
5.09%
3.21%
0.001032908
2008
3.53%
1.65%
0.000273535
2009
0.81%
–1.07%
0.000113659
2010
0.24%
–1.64%
0.000267686
2011
0.20%
–1.68%
0.000280935
2012
0.07%
–1.81%
0.000326204
2013
0.12%
–1.76%
0.000308393
2014
0.09%
–1.79%
0.000319019
2015
0.07%
–1.81%
0.000326204
2016
0.29%
–1.59%
0.000251575
2017
0.54%
–1.34%
0.000178519
Total
33.77%
Sum of (R – Avg)2
➔0.007725663
Average
1.88%
Variance
0.00045
0.000454451
S.Dev
2.13%
0.021317851
14. Internet exercise. Find the Standard & Poor’s 500 annual returns for 2000 to the present. Go
to Yahoo! Finance (www.finance.yahoo.com), and in the “Get Quotes” search field, enter
SPY (the ticker symbol for the Standard & Poor’s 500 electronically traded fund). Select
historical prices and find the year-end prices for the fund and all dividends from 2000
through the end of the most recent year. Find each year’s return (remember to add in the
dividend distributions for the year). What was the average annual return? What was the
standard deviation? How does it compare with the data presented in Table 8.1?
256 Brooks ◼ Financial Management: Core Concepts, 4e
ANSWER
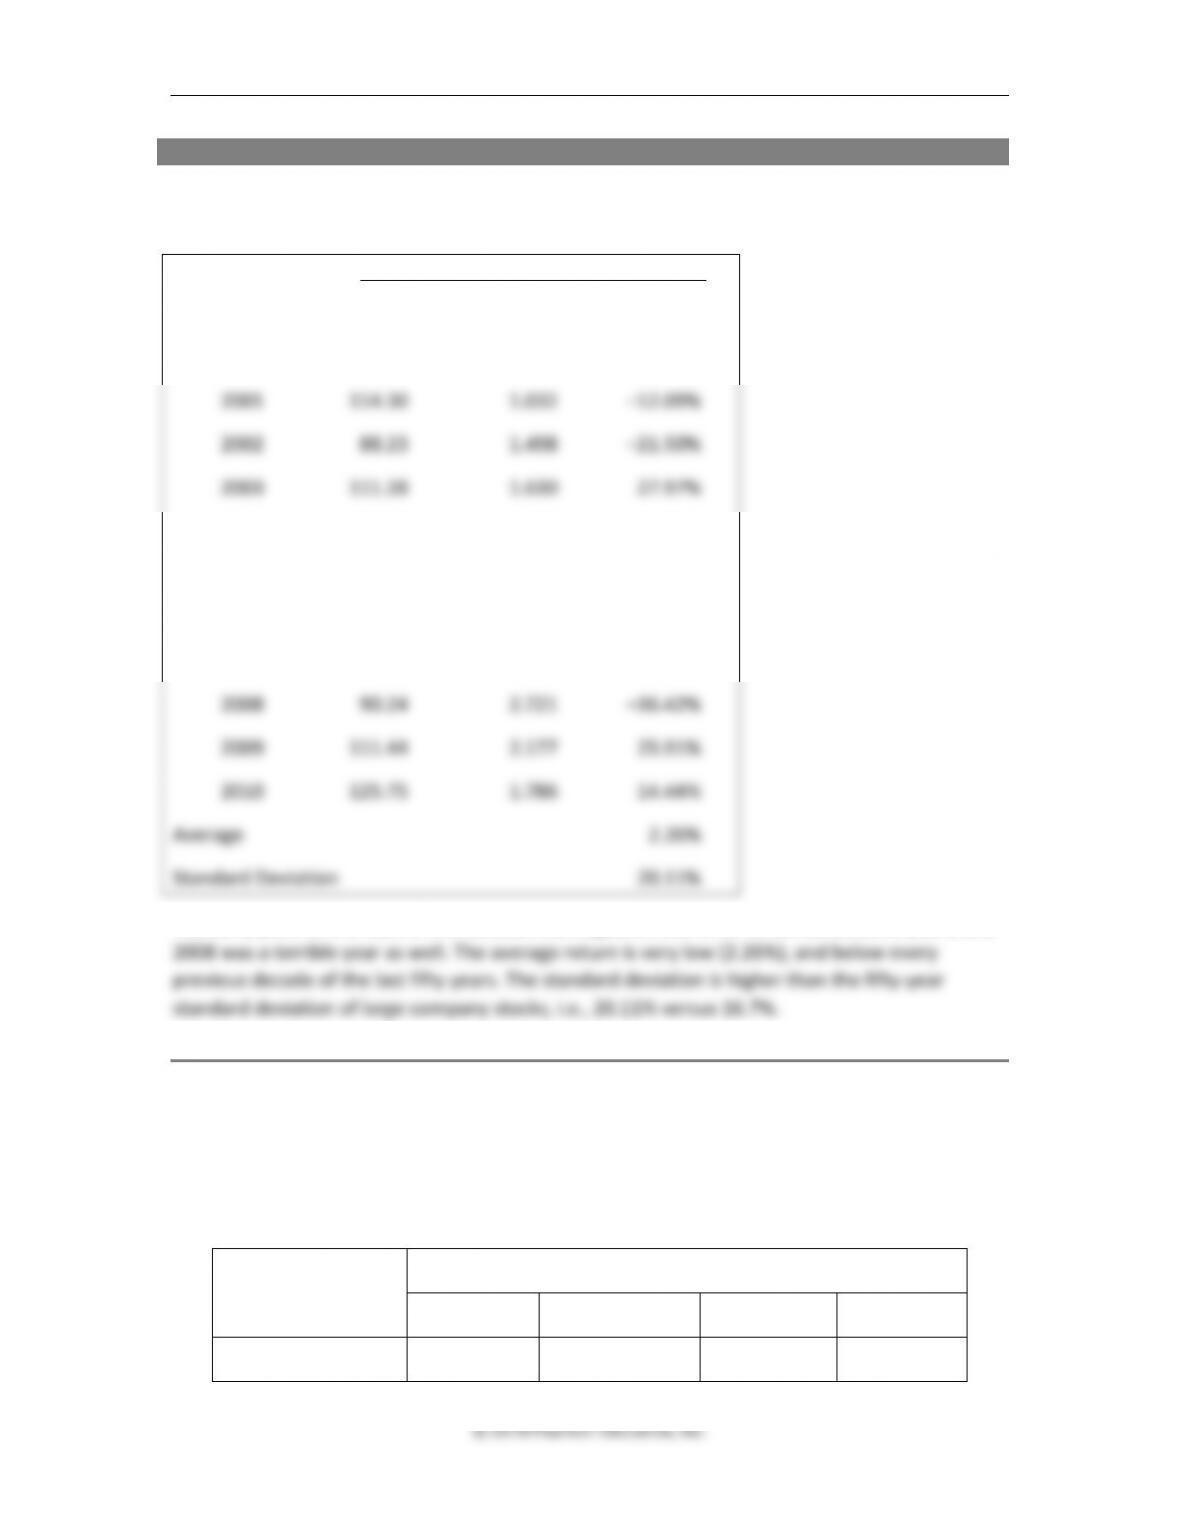
Note: We used data for the period 1999–2010
Year End Price of SPY (1999–2010) and annual Dividends and annual Return
Price Dividends (annual) Return
1999 146.88
2000 131.19 1.454 – 9.69%
2004 120.87 2.197 10.59%
2005 124.51 2.149 4.79%
2006 141.62 2.446 15.71%
2007 146.21 2.701 5.15%
The early years of the start of this decade had negative returns for three consecutive years, and
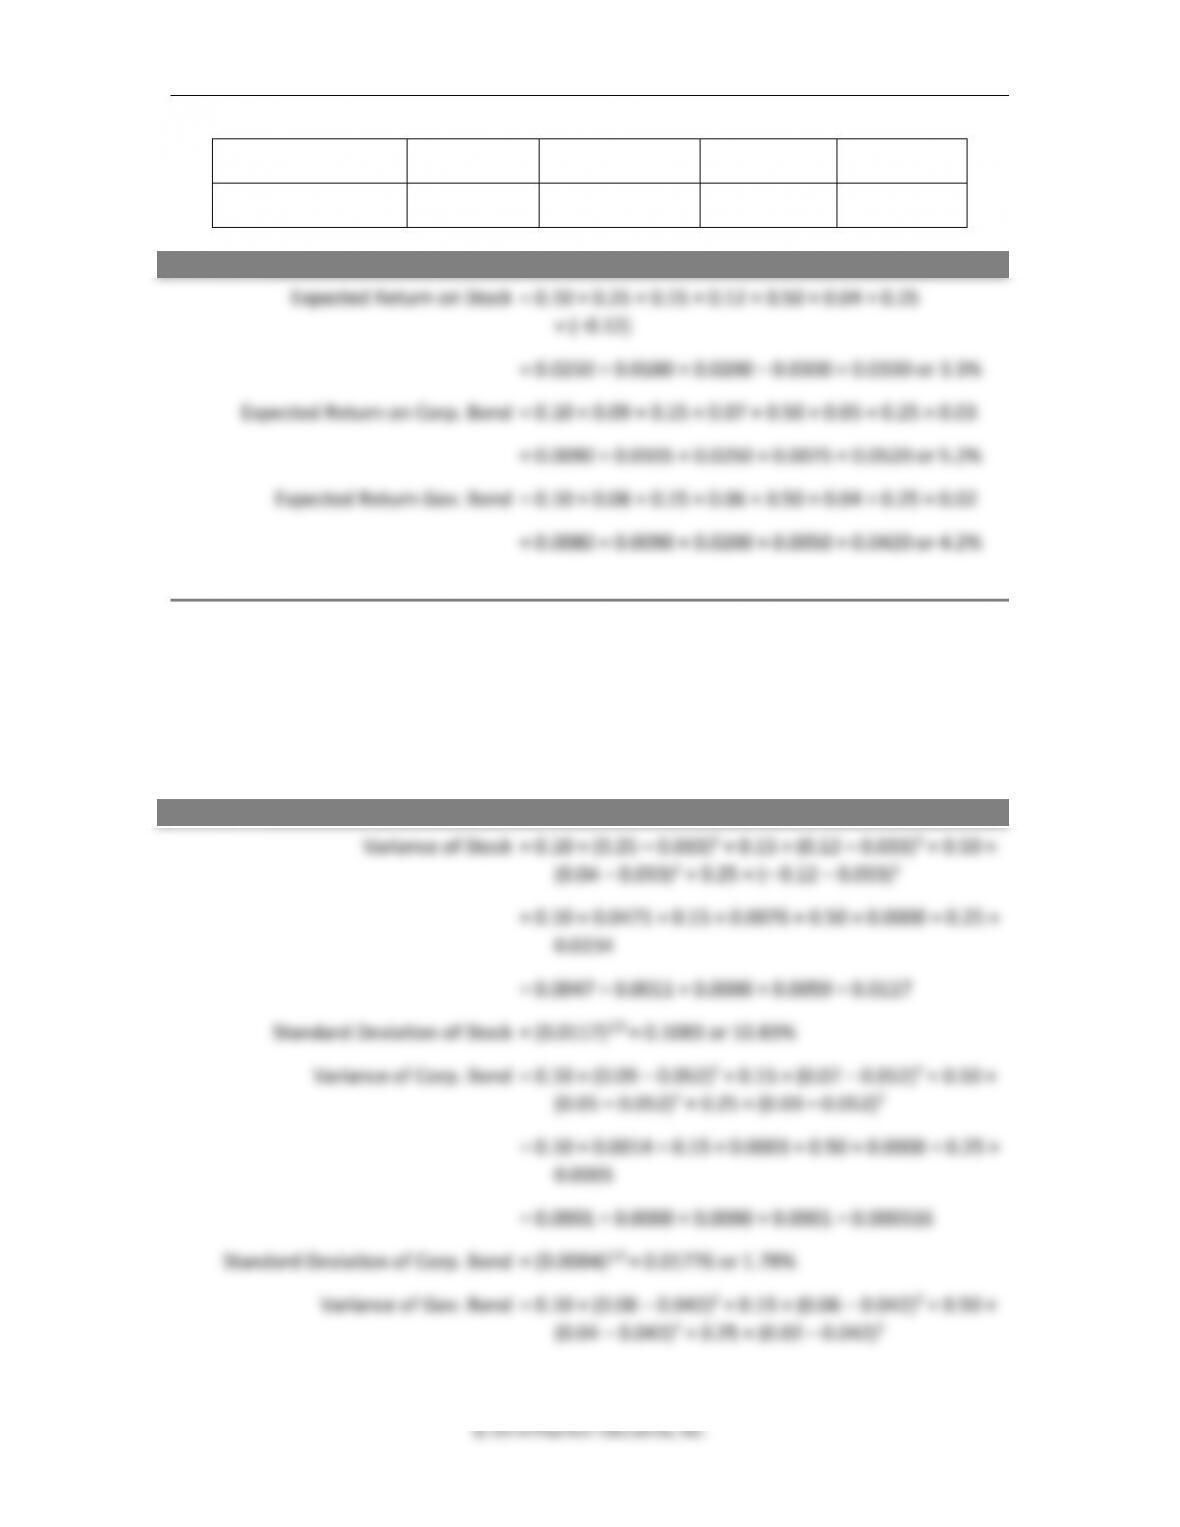
15. Expected return. Hull Consultants, a famous think tank in the Midwest, has provided
probability estimates for the four potential economic states for the coming year. The
probability of a boom economy is 10%, the probability of a stable growth economy is 15%,
the probability of a stagnant economy is 50%, and the probability of a recession is 25%.
Estimate the expected returns on the following individual investments for the coming year.
INVESTMENT
Forecasted Returns for Each Economy
Boom
Stable Growth
Stagnant
Recession
Stock
25%
12%
4%
–12%
Chapter 8 ◼ Risk and Return 257
Corporate Bond
9%
7%
5%
3%
Government Bond
8%
6%
4%
2%
ANSWER
16. Variance and standard deviation (expected). Using the data from Problem 15, calculate the
variance and standard deviation of the three investments, stock, corporate bond, and
government bond. If the estimates for both the probabilities of the economy and the
returns in each state of the economy are correct, which investment would you choose,
considering both risk and return? Why?
ANSWER

258 Brooks ◼ Financial Management: Core Concepts, 4e
© 2018 Pearson Education, Inc.
= 0.10 × 0.0014 + 0.15 × 0.0003 + 0.50 × 0.0000 + 0.25 ×
0.0005
= 0.0001 + 0.0000 + 0.0000 + 0.0001 = 0.000316
Standard Deviation of Gov. Bond = (0.000316)1/2 = 0.01776 or 1.78%