
186
Chapter 7
Stocks and Stock Valuation
LEARNING OBJECTIVES (Slide 7-2)
1. Explain the basic characteristics of common stock.
2. Define the primary market and the secondary market.
3. Calculate the value of a stock given a history of dividend payments.
4. Explain the shortcomings of the dividend pricing models.
5. Calculate the price of preferred stock.
6. Understand the concept of efficient markets.
IN A NUTSHELL…
In this chapter, the author covers the basic characteristics of stocks—both common and
preferred—and describes how they are traded in primary and secondary markets. Considerable
attention is given to the pricing of stocks and how expected dividends help determine a stock’s
value. The methodology, advantages, and disadvantages associated with dividend discount
models are covered next, followed by the formula for pricing preferred stock. Finally, the
concept of efficient markets is discussed with particular emphasis on the role that information
plays in the pricing of stocks.
LECTURE OUTLINE
7.1 Characteristics of Common Stock (Slides 7-3 to 7-11)
Common stock, like bonds, represents a major financing vehicle for corporations and provides
holders with an opportunity to share in the future cash flows of the issuer. Unlike bonds,
however, holding common stock signifies ownership in the company, with no maturity date, and
variable periodic income. This section covers the basic characteristics of common stock in
comparison with bonds. A good grasp of this material is tantamount to understanding the
valuation models that follow.
Ownership: As part owners of the company, common shareholders are entitled to share in the
residual profits of the company and have a claim to all its assets and cash flow once the
creditors, employees, suppliers, and taxes are paid off. Ownership via common stock also
confers voting rights to the shareholders allowing them to participate in the management of the
company by electing the board of directors, which ultimately selects the management team that
runs the company’s day–to-day operations.
Claim on Assets and Cash Flow (Residual Claim): right to share in the residual assets and
cash flow of the issuer, once all the other stakeholders have been paid off.
Chapter 7 ◼ Stocks and Stock Valuation 187
Vote (Voice in Management)
Standard voting rights: Typically, one vote per share provided to shareholders to vote in board
elections and other key changes to the charter and bylaws. This standard can be altered by
issuing several classes of stock.
Nonvoting stock, which is usually for a temporary period of time, or super voting rights, which
provide the holders with multiple votes per share, increasing their influence and control over
the company.
No Maturity Date: Common stock is considered to have an infinite life since, unlike
bondholders, shareholders do not have a promised future date when they will receive their
investment back.
Dividends and Their Tax Effect: Companies pay cash dividends periodically (usually every
quarter) to their shareholders out of net income. Unlike coupon interest paid on bonds,
dividends cannot be treated as a tax-deductible expense by the company. For the recipient,
however, dividends are considered to be taxable income. More material on dividends and
dividend policy is covered in Chapter 17.
Authorized, Issued, and Outstanding Shares:
Authorized shares is the maximum number of shares that the company may sell, as specified in
the charter.
Issued shares represent the number of shares that has already been sold by the company and
are either currently available for public trading (outstanding shares) or held by the company for
future uses such as rewarding employees (treasury stock).
Preemptive Rights are privileges that allow current shareholders to buy a fixed percentage of
all future issues before they are offered to the general public and are provided to common
shareholders so as to allow them to maintain their proportional ownership in the company.
7.2 Stock Markets (Slides 7-12 to 7-15)
Stocks are traded in two types of markets: the primary or “first sale” market, where the firm first
sells its stock, and the secondary or “after–sale” market, where previously issued shares are
traded among investors themselves.
Primary Markets are markets where companies that want to “go public” are involved in
selling their stock to investors, generally with the assistance and expertise of investment
banking firms.
Initial public offering (IPO) is the first public equity issue of a firm.
Prospectus is a document that provides information regarding the issuing company and the
impending sale of securities to potential buyers.
188 Brooks ◼ Financial Management: Core Concepts, 4e
Due diligence are steps undertaken by the investment banker to ensure that all relevant
information regarding the stock issue is being disclosed prior to the sale.
Chapter 7 ◼ Stocks and Stock Valuation 189
Secondary Markets: How Stocks Trade. Secondary markets represent a forum where
common stock can be traded among investors themselves, thereby providing investors with
liquidity and variety. In the United States, there are three well-known secondary stock markets:
The New York Stock Exchange (NYSE) and the American Stock Exchange (AMEX) are both
physical trading locations with trading floors, while the National Association of Securities Dealers
(NASD) and its trading system, the National Association of Securities Dealers Automated
of unfilled orders awaiting execution in the “limit order book.”
Ask price is the price that the dealer is willing to sell at.
Bid price is the price that the dealer is willing to buy at.
Bid-ask spread is the dealer’s profit or difference between the bid price and the ask price.
Bull Markets and Bear Markets are terms used to describe stock market trends.
A bull market is the label for a prolonged rising stock market, coined on the analogy that a bull
attacks with his horns from the bottom up.
A bear market is the label for a prolonged declining market, based on the analogy that a bear
swipes with his paws from the top down.
7.3 Stock Valuation (Slides 7-16 to 7-21)
Theoretically speaking, the value of a share of stock, like any financial asset, can be estimated as
the present value of its expected future cash flow, which would include the cash dividends paid
by the company (if any) and the future selling price of the stock, when sold to another buyer.
The discount rate used would be the appropriate rate of return that should be earned given the
riskiness of the company.
Example 1: Stock price with known dividends and sale price
Agnes wants to purchase common stock of New Frontier Inc. and hold it for three years. The
directors of the company just announced that they expect to pay an annual cash dividend of
$4.00 per share for the next five years. Agnes believes that she will be able to sell the stock for
$40 at the end of three years. In order to earn 12% on this investment, how much should Agnes
pay for this stock?
Method 1: Using an Equation
( )
( )
1
11
1
1
n
n
r
r
r
−
+
+
190 Brooks ◼ Financial Management: Core Concepts, 4e
© 2018 Pearson Education, Inc.
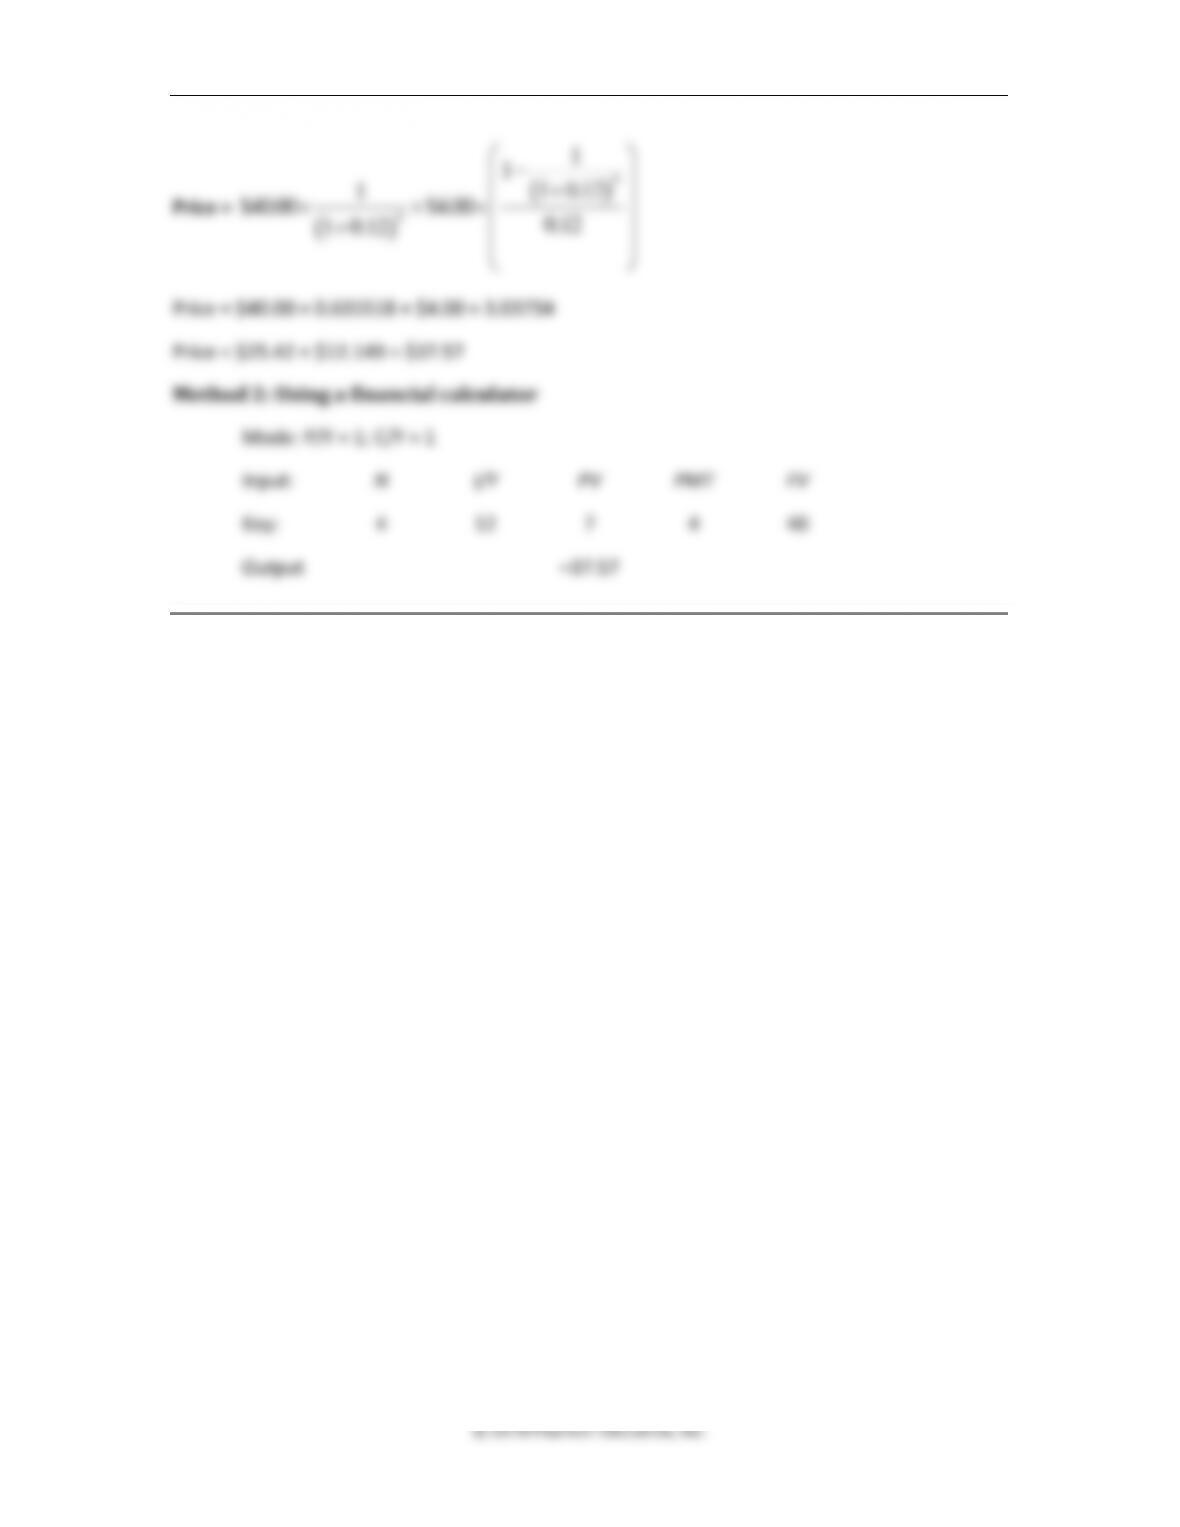
Price =
( )
( )
4
4
1
11 0.12
1
$40.00 $4.00 0.12
1 0.12
−
+
+
+
Price = $40.00 × 0.635518 + $4.00 × 3.03734
Price = $25.42 + $12.149 = $37.57
Method 2: Using a financial calculator
Mode: P/Y = 1; C/Y = 1
Input: N I/Y PV PMT FV
Key: 4 12 ? 4 40
Output –37.57
The problem with this approach is that, unlike bonds, which have a predetermined coupon
payment and maturity or par value, common stocks do not specify a fixed periodic dividend rate
nor do they mature at a future date and pay a stated par value. Thus the timing and magnitude
of cash flow from common stock ownership is uncertain and variable, making valuation difficult
and more of an art than a science.
Since the main cash flow received from common stock is the periodic dividend, four variations of
a dividend pricing model have been used to value common stock, each of which makes a
different assumption about the dividend stream and the maturity of the stock, whether the
dividends are constant or growing and whether we hold the stock forever or up to a point at
which we sell it.
The variations are as follows:
1. The constant dividend model with an infinite horizon
2. The constant dividend model with a finite horizon
3. The constant growth dividend model with a finite horizon
4. The constant growth dividend model with an infinite horizon
Note: It is important to remind students that models can only estimate stock values based on
projected cash flows. The market price that a stock trades for at any given time is a reflection of
consensus estimates of future cash flow and the discount rate, and these consensus estimates
change frequently, so by using these pricing models we are trying to connect with the idea that
when it comes to pricing stocks what matters is the timing and amount of cash flow.
Chapter 7 ◼ Stocks and Stock Valuation 191
The Constant Dividend
Model with an Infinite Horizon (Slides 7-22 to 7-23)
Under this model, it is assumed that the firm is paying the same dividend amount in perpetuity.
That is,
Div1 = Div2 = Div3 = Div4 = Div5 = Div6 = Div7 = Div8 = Div∞
Recall in Chapter 4 (equation 4.7), it was shown that for perpetuities,
PV = PMT/r; where r the required rate and PMT is the cash flow.
Thus, for a stock that is expected to pay the same dividend forever,
Price = Dividend/Required rate of return
Example 2: Quarterly dividends forever
Let’s say that the Peak Growth Company is paying a quarterly dividend of $0.50 and has decided
to pay the same amount forever. If Joe wants to earn an annual rate of return of 12% on this
investment, how much should he offer to buy the stock at?
The Constant Dividend
Model with a Finite Horizon (Slides 7-24 to 7-26)
Under this model, it is assumed that the investor holds the stock for a finite period of time, and
then sells it off to another investor. If the dividends paid each period are expected to be
constant over the investment horizon, the price can be estimated as the sum of the present
value of an annuity (constant dividend) and that of a single sum (the selling price), similar to a
typical nonzero coupon, corporate bond. Of course, one would have to estimate the future
selling price, since that is not a given value, unlike the par value of a bond.
Example 3: Constant dividends with finite holding period
Let’s say that the Peak Growth Company is paying an annual dividend of $2.00 and has decided
to pay the same amount forever. If Joe wants to earn an annual rate of return of 12% on this
investment, and plans to hold the stock for five years, with the expectation of selling it for $20
at the end of five years, how much should he offer to buy the stock at?
Method 1: Using TVM formulae
192 Brooks ◼ Financial Management: Core Concepts, 4e
© 2018 Pearson Education, Inc.
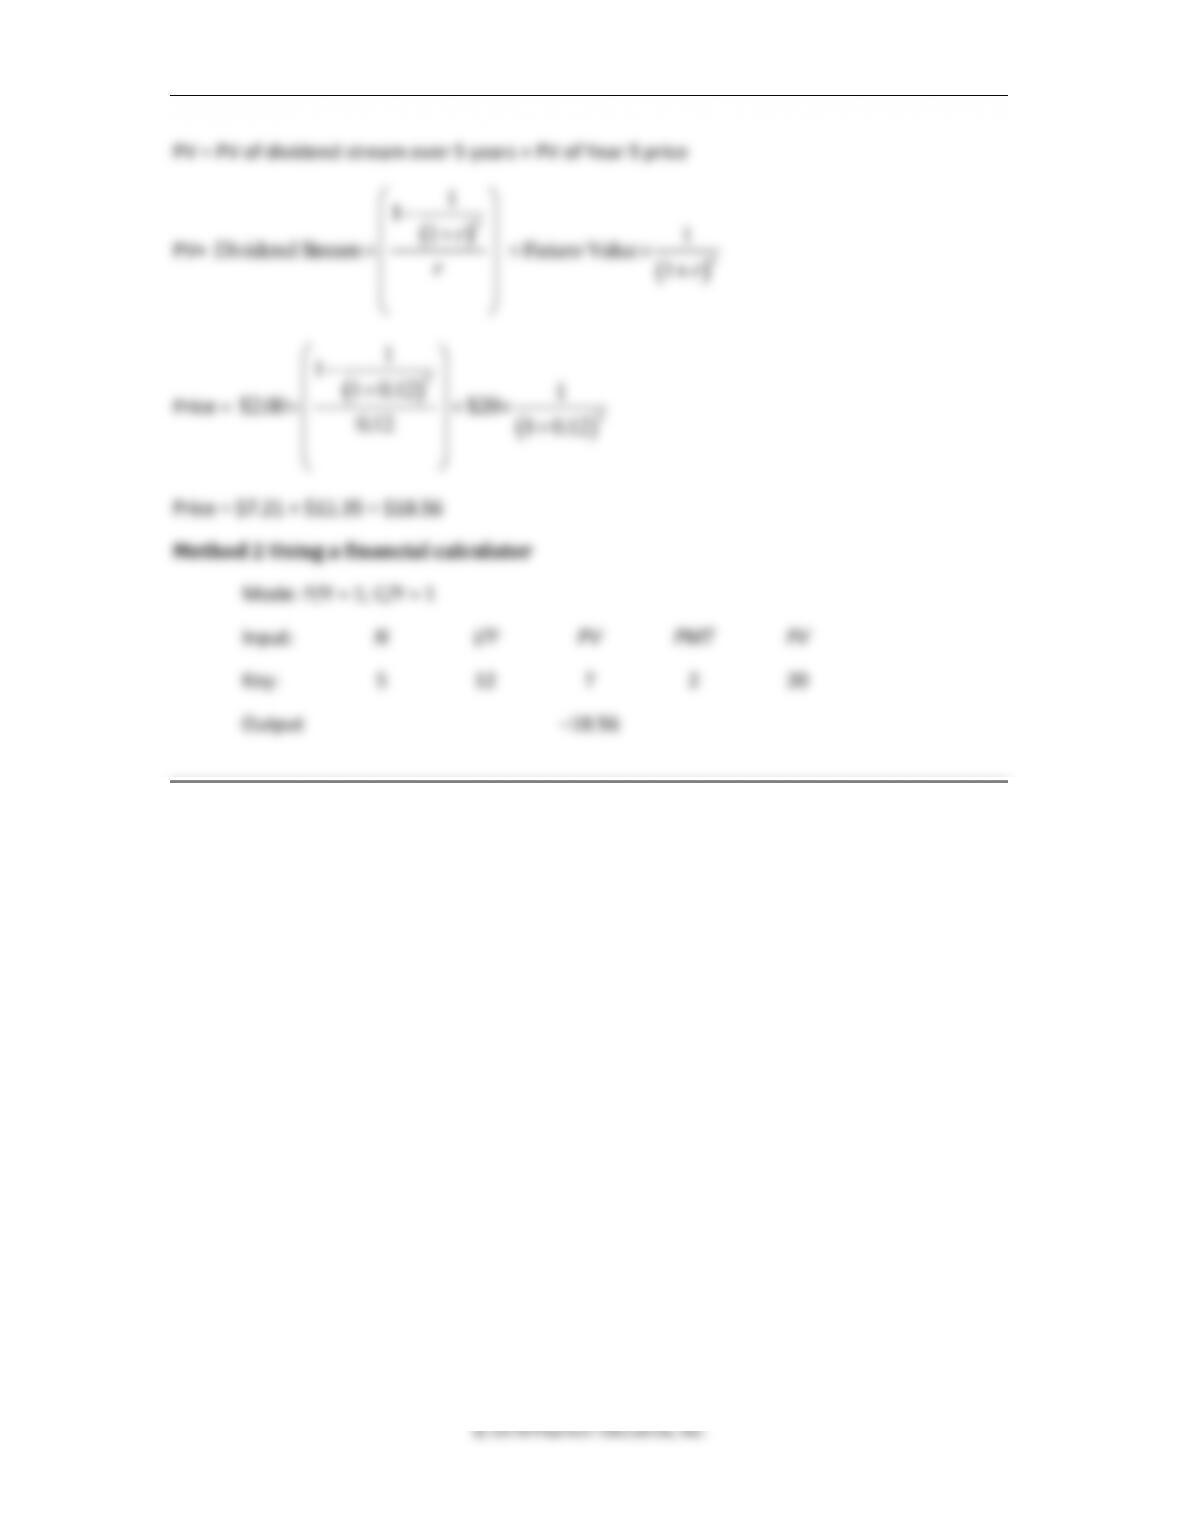
PV = PV of dividend stream over 5 years + PV of Year 5 price
PV=
( )
( )
1
111
Dividend Stream Future Value 1
n
n
r
rr
−
+
+
+
Price =
( )
( )
5
5
1
11 0.12 1
$2.00 $20
0.12 1 0.12
−
+
+
+
Price = $7.21 + $11.35 = $18.56
Method 2 Using a financial calculator
Mode: P/Y = 1; C/Y = 1
Input: N I/Y PV PMT FV
Key: 5 12 ? 2 20
Output –18.56
Chapter 7 ◼ Stocks and Stock Valuation 193
The Constant Growth Dividend
Model with an Infinite Horizon (Slides 7-27 to 7-32)
This model, also known as the Gordon model (after its developer, Myron Gordon), estimates the
value of stock based on the discounted value of an infinite stream of future dividends that grow
at a constant rate, g. The formula is as follows:
( )
( )
( )
( )
( )
( )
( )
( )
1 2 3
Div 1 Div 1 Div 1 Div 1
0 0 0 0
Price01 2 3 1
1 1 1
g g g g
r
r r r
+ + + +
= + + +
+
+ + +
Where r = the required rate of return. With some algebraic derivation, this formula can be
simplified to…
( )
( )
Div 1
0
Price0
g
rg
+
=−
And because, Div1 = Div0 × (1 + g)
( )
Div1
Price0rg
=−
And more generally
( )
1
Price n
n
Div
rg
+
=−
,
Where, Divn+1 is the estimated next dividend of the stock with the given growth rate of the
dividends, g, at time period n.
Note: For this model to be applicable, the required rate, r, must be greater than the growth
rate, g. Otherwise, we will be dividing by zero, (if r = g) or by a negative (if r < g), both of which
would lead to nonmeaningful values.
Example 4: Constant growth rate, infinite horizon (with growth rate given)
Let’s say that the Peak Growth Company just paid its shareholders an annual dividend of $2.00
and has announced that the dividends would grow at an annual rate of 8% forever. If investors
expect to earn an annual rate of return of 12% on this investment, how much would they offer
to buy the stock for?
( )
0
rg
© 2018 Pearson Education, Inc.
Example 5: Constant growth rate, infinite horizon
(with growth rate estimated from past history)
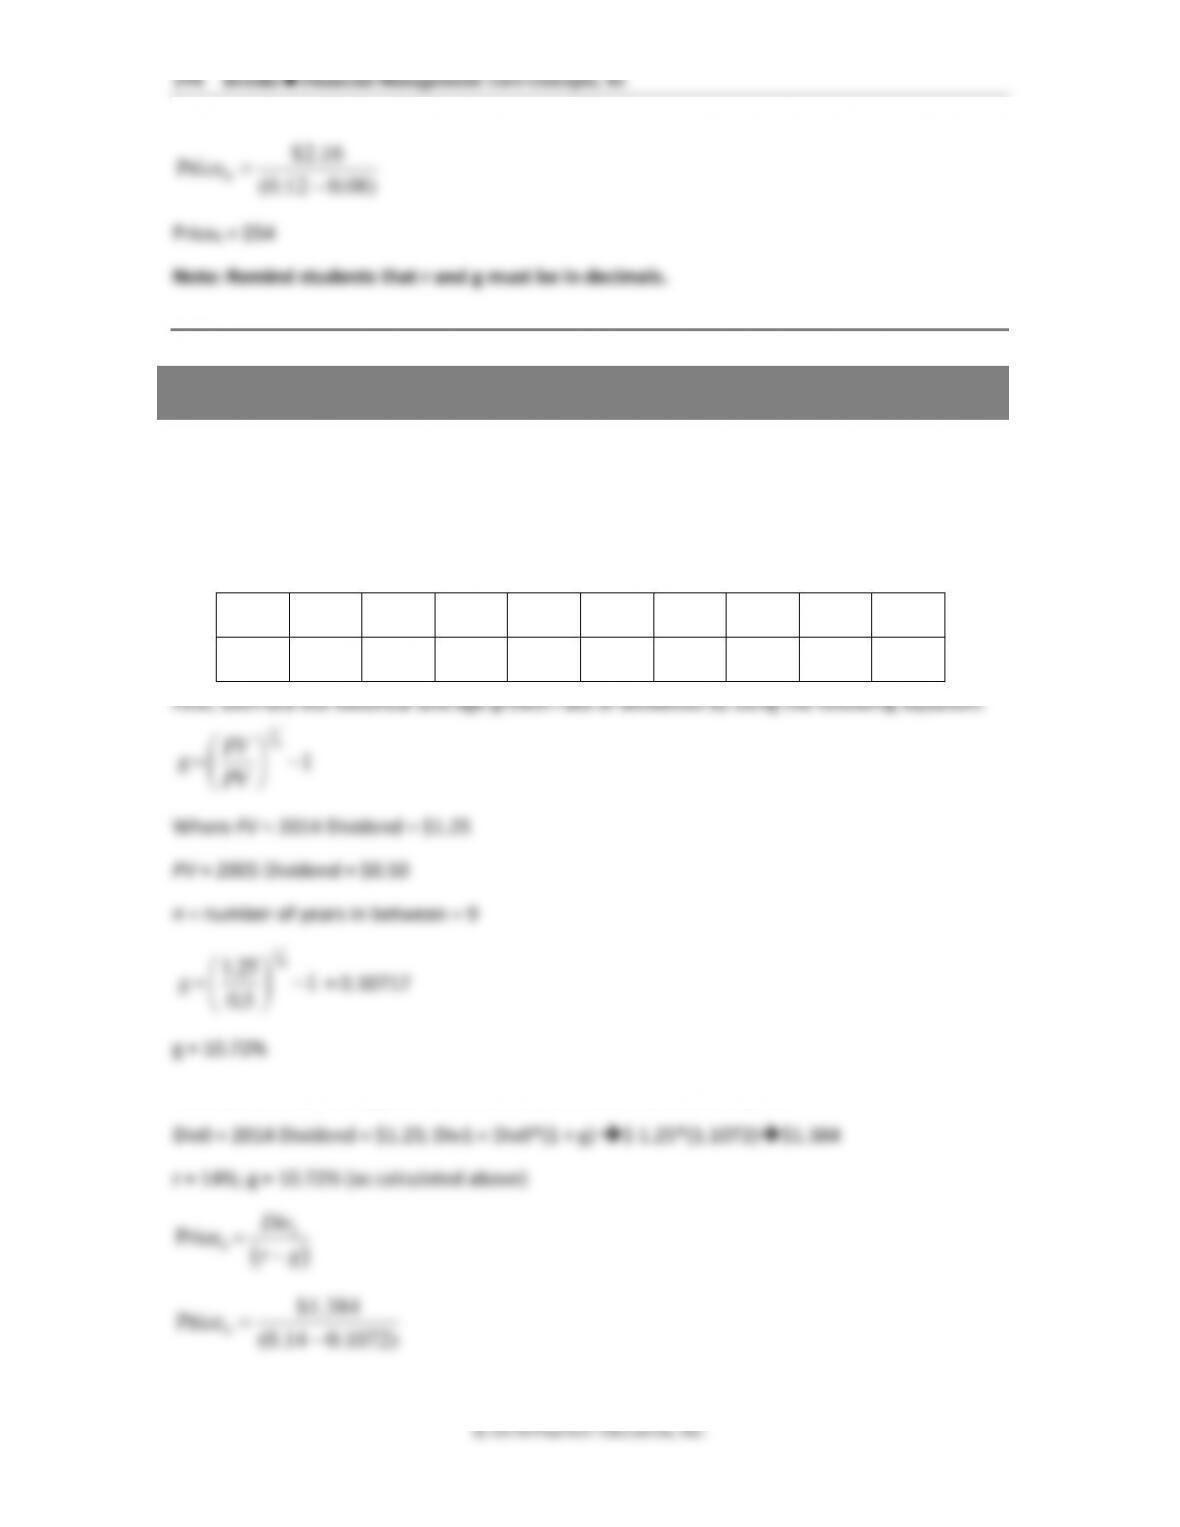
Let’s say that you are considering an investment in the common stock of QuickFix Enterprises
and are convinced that its last paid dividend of $1.25 will grow at its historical average growth
rate from here on. Using the past ten years of dividend history and a required rate of return of
14%, calculate the price of QuickFix’s common stock.
QuickFix Enterprises’ Annual Dividends
2005
2006
2007
2008
2009
2010
2011
2012
2013
2014
$0.50
$0.55
$0.61
$0.67
$0.73
$0.81
$0.89
$0.98
$1.08
$1.25
Next, use the constant growth, infinite horizon model to calculate price:
0
Chapter 7 ◼ Stocks and Stock Valuation 195
© 2018 Pearson Education, Inc.
Price0 = $42.19
196 Brooks ◼ Financial Management: Core Concepts, 4e
The Constant Growth Dividend
Model with a Finite Horizon (Slides 7-33 to 7-37)
In cases where an investor expects to hold a stock, whose dividends are growing at a constant
rate, for a limited number of years, the following adjusted formula can be used to value the
stock:
( )
( )
0
0
11
Price 1 1
n
Div g g
r g r
+ +
= −
−+
+
( )
Price
1
n
n
r+
where, g = the constant growth rate,
r = the required rate, and
n = the investor’s holding period.
Pricen
= Selling price in period n
Note: This formula would lead to the same price estimate as the Gordon model, if it is
assumed that the growth rate of dividends and the required rate of return of the next owner,
(after n years) remain the same.
Example 6: Constant growth, finite horizon
The QuickFix Company just paid a dividend of $1.25 and analysts expect the dividend to grow at
its compound average growth rate of 10.72% forever. If you plan on holding the stock for just
seven years, and you have an expected rate of return of 14%, how much would you pay for the
stock? Assume that the next owner also expects to earn 14% on his or her investment.
Div0 = $1.25; g = 10.72%; r = 14%; n = 7
We can solve this in two ways.
Method 1: Use constant growth, finite horizon formula:
( )
( )
0
Price 1 1
r g r
= −
−+
0
11
n
Div g g
+ +
Price
n
( )
0
.14 .1072 1.14
−
( )
7
1.14
Chapter 7 ◼ Stocks and Stock Valuation 197
© 2018 Pearson Education, Inc.
0
Price
= $42.195 *0.184829 + 34.40 = $42.19
Method 2: Since the growth rate is constant forever, and the required rates of return of both
investors is the same, we can also use the Gordon model.
( )
( )
0
0
1
Price Div g
rg
+
=−
➔
0
$1.25*(1.1072)
Price (0.14 0.1072 .9
)$42 1== −
Nonconstant Growth Dividends (Slides 3-38 to 7-41)
The above four models can only be used in cases where a firm is either expected to pay a
constant dividend amount indefinitely or is expected to have its dividends grow at a constant
rate for long periods of time. In reality, the dividend growth patterns of most firms tend to be
variable, making the valuation process complicated. However, if we can assume that at some
point in the future, the dividend growth rate will become constant, we can use a combination of
the Gordon Model and present value equations to calculate the price of the stock.
Example 7: Nonconstant dividend pattern
The Rapid Growth Company is expected to pay a dividend of $1.00 at the end of this year.
Thereafter, the dividends are expected to grow at the rate of 25% per year for two years, and
then drop to 18% for one year, before settling at the industry average growth rate of 10%
indefinitely. If you require a return of 16% to invest in a stock of this risk level, how much would
you be justified in paying for this stock?
Step 1. Calculate the annual dividends expected in Years 1–4, using the appropriate growth
rates.
Step 2. Calculate the price at the start of the constant growth phase using the Gordon model.
Step 3. Discount the annual dividends in Years 1–4 and the Price at the end of Year 4, back to
Year 0 using the required rate of return as the discount rate, and add them up to solve for the
current price.
198 Brooks ◼ Financial Management: Core Concepts, 4e
© 2018 Pearson Education, Inc.
CF0 = 0;CF1 = 1.00; CF2 = 1.25; CF3 = 1.56; CF4 = 1.84 + 33.73; I = 16; NPV = $22.44
7.4 Dividend Model Shortcomings (Slide 7-42)
Because dividend pricing models (constant growth or constant dividend) estimate stock prices
based on future cash flow such as the dividends to be received and a required rate of return,
they are difficult to apply universally. Firms with fairly erratic dividend patterns, long periods of
no dividends, or declining dividend trends, in particular, are not well suited for the application of
these models. In such cases, what we need is a pricing model that is more inclusive than the
dividend model, one that can estimate expected returns for stocks without the need for a stable
200 Brooks ◼ Financial Management: Core Concepts, 4e
Semi-strong-form efficient markets are those in which current prices already reflect not only
Chapter 7 ◼ Stocks and Stock Valuation 201
Strong-form efficient markets are those in which current prices reflect the price and volume
history of the stock, all publicly available information, and even all private information. It implies
that all information is already embedded in the price, and hence, there is no advantage to using
insider information to routinely outperform the market.
Note: These three forms of the EMH are analogous to three circles, one embedded inside the
other, with the inner-most circle representing the weak-form and the outer-most circle the
strong form. These circles imply that if a market is strong-form efficient, it would
automatically be deemed to be weak and semi-strong form efficient as well.
Despite decades of testing market efficiency, the jury is still out regarding the question of
whether or not markets are truly weak or semi-strong efficient. A lot of evidence points out to
markets being fairly semi-strong efficient, but there are exceptions making the results
inconclusive.
Questions
1. What are three key features of common stock?
There are many features to choose from, but here is a list of three key features:
2. What are the differences among authorized, issued, and outstanding shares?
Authorized shares are the number of shares a company can sell and is set by the charter of
3. What is the role of the investment banker in the primary sale of common stock?
4. What are the potential repercussions if the investment banker does not perform the due
diligence task?
5. What is the function of a specialist in the secondary market?
204 Brooks ◼ Financial Management: Core Concepts, 4e
© 2018 Pearson Education, Inc.
d. Price = $0.50 / 0.13 = $3.85
e. Price = $0.50 / 0.20 = $2.50
2. Stock price. Diettreich Electronics wants its shareholders to earn a 15% return on their
investment in the company. At what price would the stock need to be priced today if
Diettreich Electronics had a
a. $0.25 constant annual dividend forever?
b. $1.00 constant annual dividend forever?
c. $1.75 constant annual dividend forever?
d. $2.50 constant annual dividend forever?
ANSWER
3. Stock price. Singing Fish Fine Foods has a current annual cash dividend policy of $2.25. The
price of the stock is set to yield a 12% return. What is the price of this stock if the dividend
will be paid
a. for 10 years?
b. for 15 years?
c. for 40 years?
d. for 60 years?
e. for 100 years?
f. forever?
ANSWER
Chapter 7 ◼ Stocks and Stock Valuation 205
© 2018 Pearson Education, Inc.
e. Price = $2.25 × (1 – 1/(1.12)100 / 0.12 = $2.25 × 8.3332 = $18.75
f. Price = $2.25 / 0.12 = $18.75