
519
Chapter 16
Capital Structure
LEARNING OBJECTIVES (Slides 16-2 to 16-3)
1. Explain why borrowing rates are different based on ability to repay loans.
2. Demonstrate the benefits of borrowing.
3. Calculate the break-even EBIT for different capital structures.
4. Explain the appropriate borrowing strategy under the pecking order hypothesis.
5. Develop the arguments for the optimal capital structure in a world of no taxes and no
bankruptcy and in a world of corporate taxes with no bankruptcy costs.
6. Understand the static theory of capital structure and the trade-off between the benefits of
the tax shield and the cost of bankruptcy.
IN A NUTSHELL…
Firms in developed countries have different levels of debt and equity leading to variations in
their risk levels and cost of capital. In this chapter, the author starts out by explaining why
borrowing rates are dependent on a firm’s ability to pay. Next, the benefits of borrowing are
identified and the method of calculating break-even EBIT for different capital structures is
illustrated. The rationale behind the pecking order hypothesis is covered next followed by a
detailed explanation of the various theories of capital structure. The chapter ends with a
discussion of the static theory of capital structure and the trade-off between bankruptcy costs
and tax shield benefits.
LECTURE OUTLINE
16.1 Capital Markets: A Quick Review (Slides 16-4 to 16-6)
Companies raise funds for growth in debt and equity markets. Investors have different risk
preferences, and companies have varying risk profiles. The cost that a firm pays for its debt or
the rate of return that investors demand to purchase equity in a firm depends largely on the
firm’s debt rating and its beta or systematic risk measure. Riskier firms end up paying higher
yields on debt securities and are expected to pay a higher rate of return on their equity, thereby
raising their average cost of capital.
520 Brooks ◼ Financial Management: Core Concepts, 4e
Example 1: Effect of risk on borrowing rates
Mike and Agnes are two venture capitalists with fairly different risk profiles. On average, both
investors are willing to commit $1,000,000 per project to cutting-edge ideas and products that
they think will fly. However, Mike is more conservative in that he tends to select low-risk
projects that he thinks have at least a 50% chance of being successful, while Agnes selects high-
risk projects that have at least 20% chance of doing well. Their success rates have tended to be
right in line with their expectations. Based on their track records, what is the minimum rate at
which each investor is willing to lend $1,000,000?
16.2 Benefits of Debt (Slides 16-7 to 16-11)
Financial leverage is the ability that owners have to use other people’s (creditors’) money at
fixed rates to make higher rates of return than would have been possible by using all of one’s
own money. It represents one of the main benefits of taking on debt.
Firms that take on debt as part of their capital structure are therefore known as levered firms
while those that do not are known as unlevered firms.
Earnings per Share as a Measure of the Benefits of Borrowing
One way to measure the benefits of leverage is by comparing the EPS of firms with different
capital structures under good and bad economic conditions.
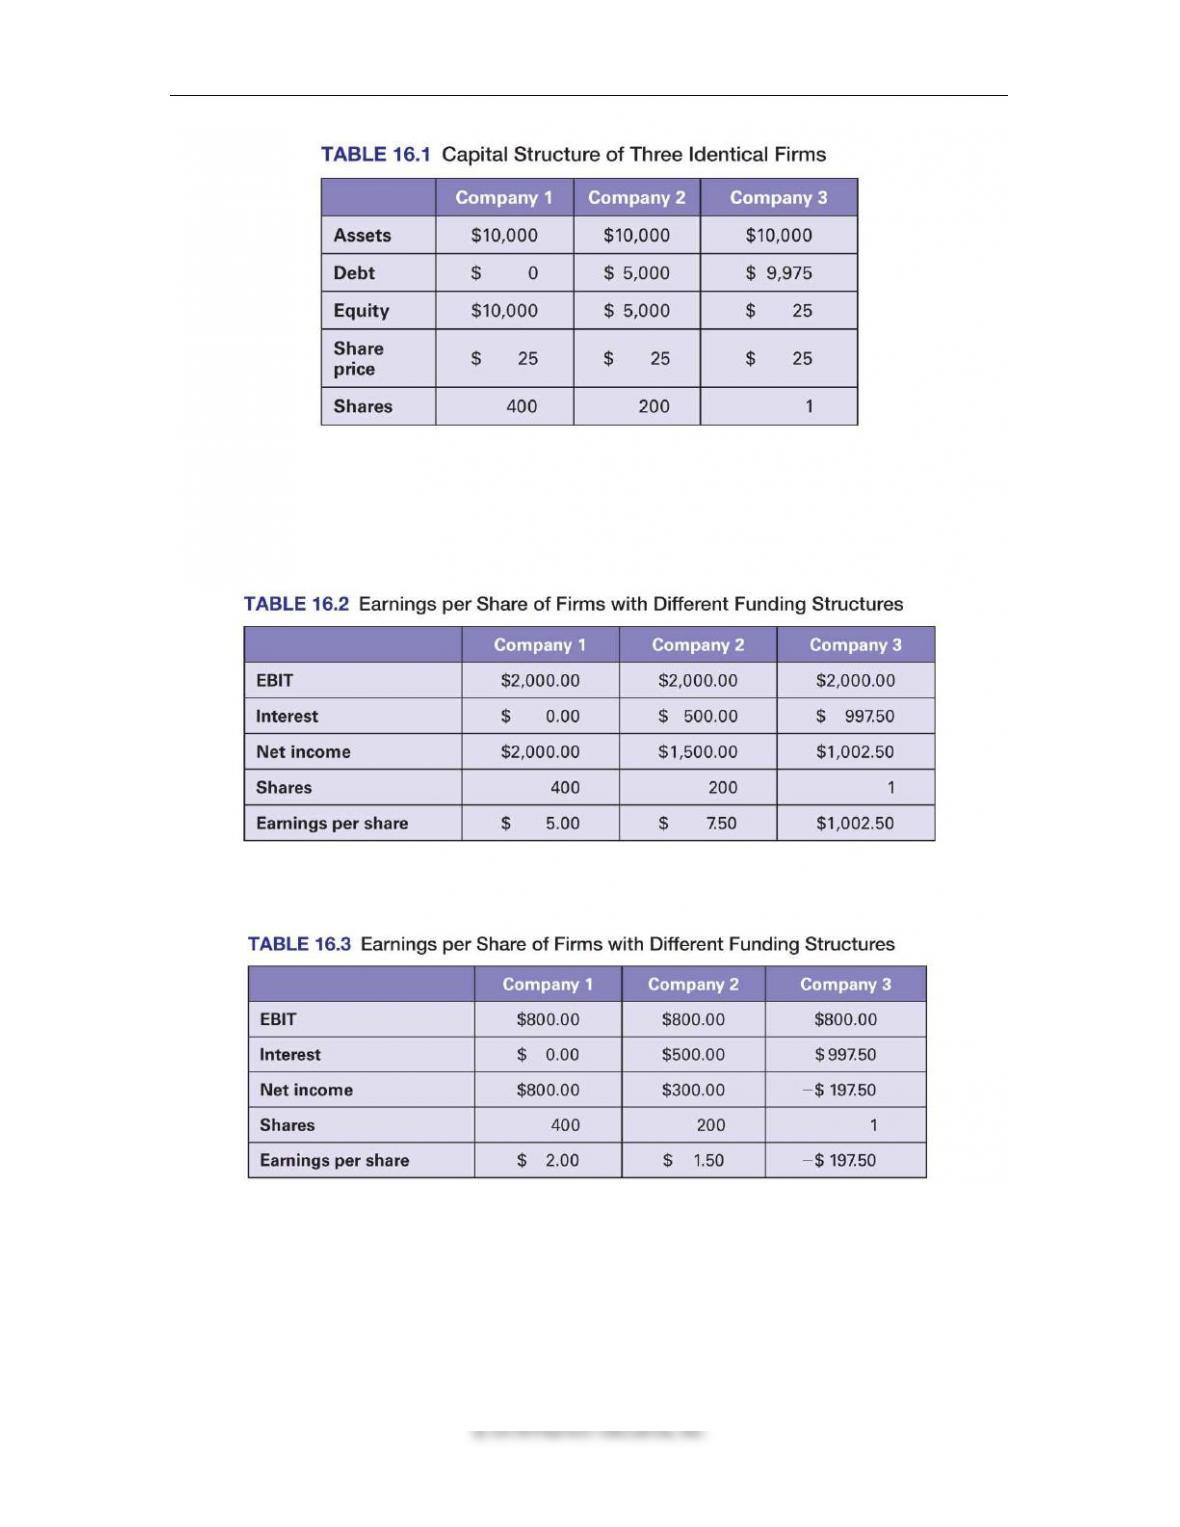
Table 16.1 presents three equal-sized firms, one with no debt, one with 50% debt, and the last
one with 99.75% debt.
Chapter 16 ◼ Capital Structure 521
Assuming a cost of debt of 10% for all firms and identical EBIT ($2000), EPS is calculated and
shown in Table 16.2.
If the firm’s EBIT covers its interest cost, higher leverage benefits the stockholders with a higher
EPS.
However, if the firm’s EBIT does not cover its interest cost, the reverse is true, as shown in Table
16.3
So leverage is a two-edged sword; benefiting firms in good times and hurting them in bad times.
16.3 Break-Even Earnings for
Different Capital Structures (Slides 16-12 to 16-14)
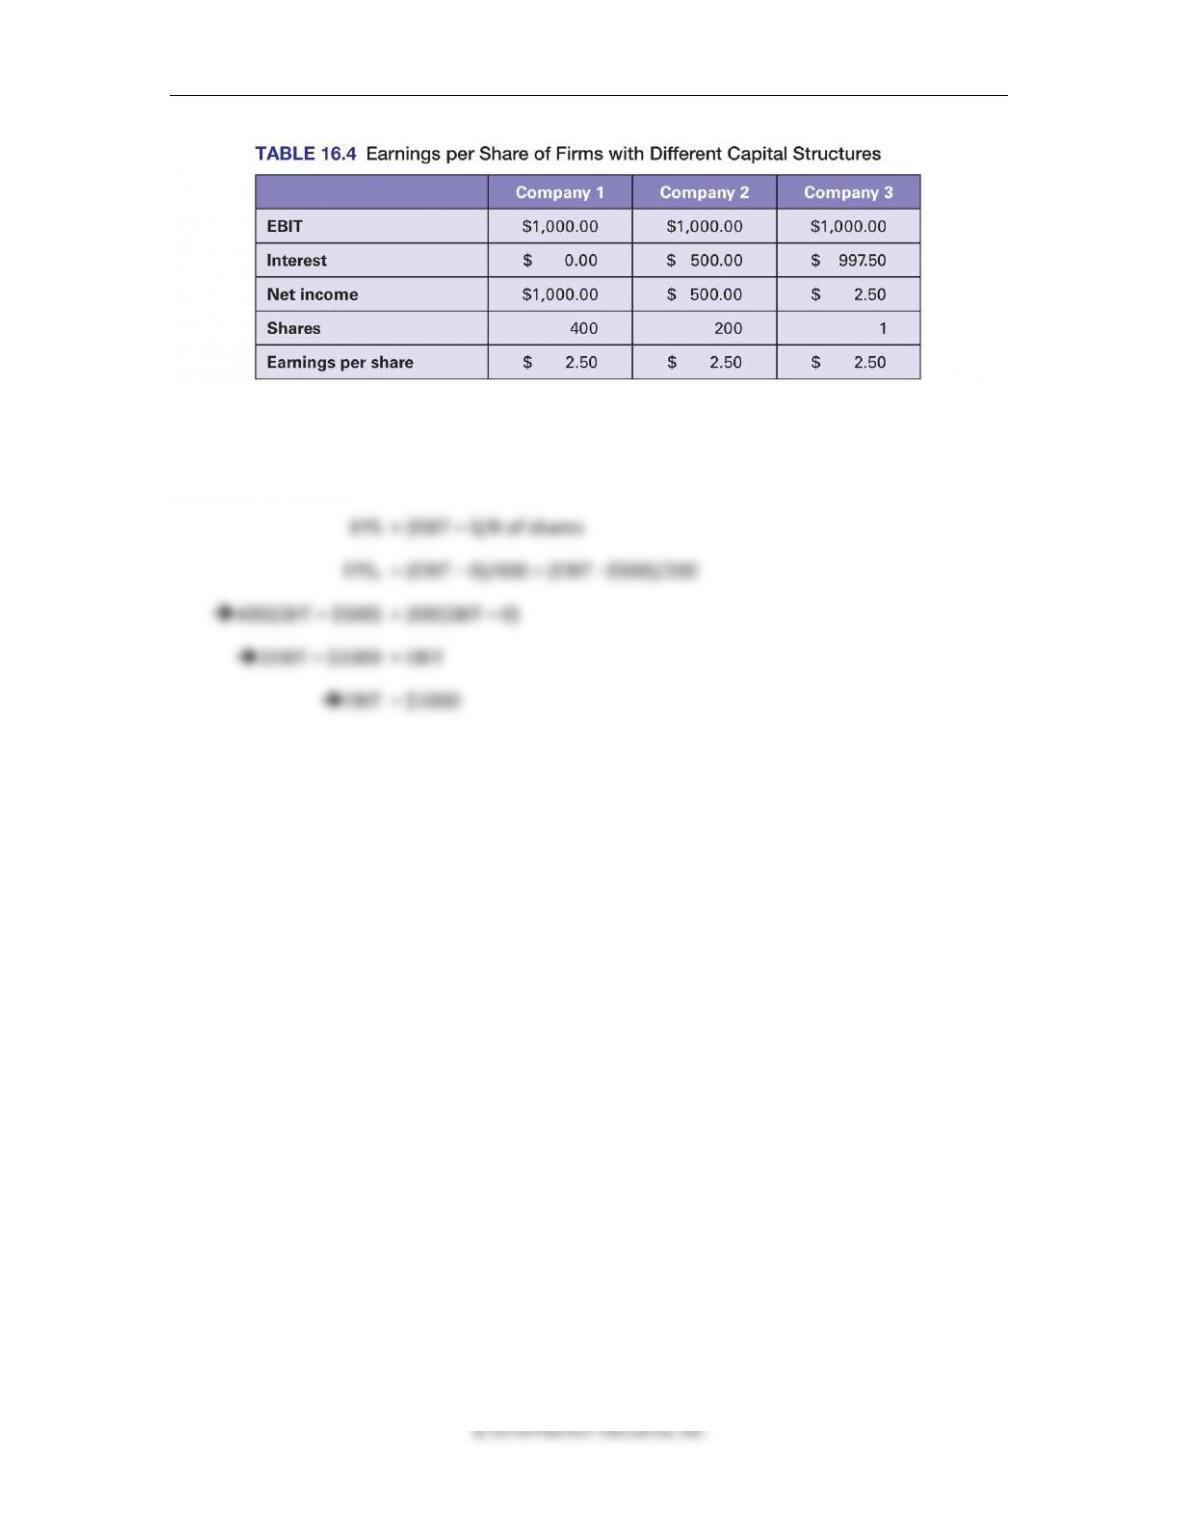
At a certain level of EBIT, known as the break-even EBIT, all three firms will have the same EPS
as shown in Table 16.4
522 Brooks ◼ Financial Management: Core Concepts, 4e
To calculate the break-even EBIT, we use the following method:
First, we first calculate the EPS of two firms, e.g., Company 1 and Company 2; set them equal;
and solve for the EBIT:
Chapter 16 ◼ Capital Structure 523
© 2018 Pearson Education, Inc.
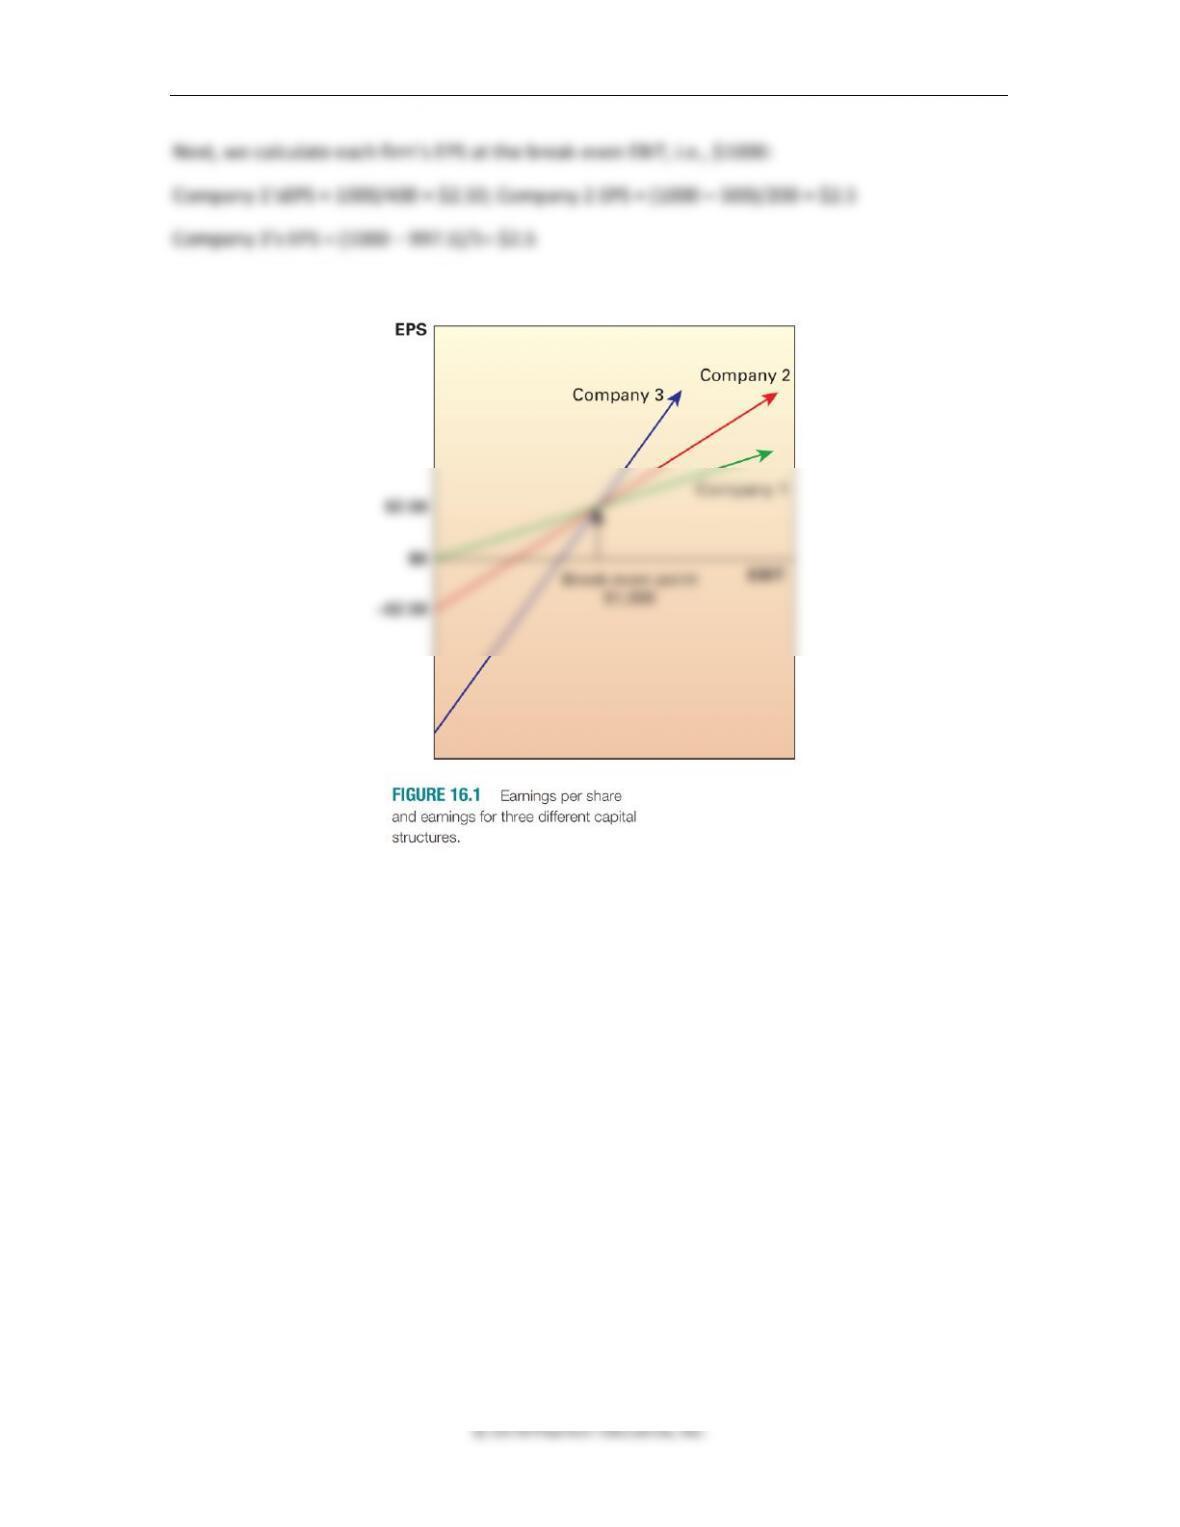
Next, we calculate each firm’s EPS at the break-even EBIT, i.e., $1000:
Company 1’sEPS = 1000/400 = $2.50; Company 2 EPS = (1000 – 500)/200 = $2.5
Company 3’s EPS = (1000 – 997.5)/1= $2.5
Below an EBIT of $1,000, e.g., $800, leverage hurts and vice versa, as shown in Figure 16.1
16.4 Pecking Order (Slides 16-15 to 16-18)
The pecking order hypothesis is based on the notion that firms have a preferred order of raising
capital. Accordingly, it states that:
1. Firms prefer internal financing (retained earnings) first.
2. If external financing is required, firms will choose to issue the safest or cheapest security
first, starting with debt financing and using equity as a last resort.
Firms Prefer Internal Financing First: This typically requires less effort, transactions cost,
and loss of secrecy.
Firms Choose to Issue Cheapest Security First and Use Equity as a Last Resort:
Retained earnings being limited, firms have to use other external sources such as debt and
equity.
When they do tap the capital markets, firms tend to issue debt first because it is less costly and
leads to less loss of control, and equity last because too much debt can put the firm into a risk of
bankruptcy.
In summary, there are three implications of the pecking order hypothesis:


526 Brooks ◼ Financial Management: Core Concepts, 4e
Because the WACC of the firm would also be the required rate of return of the investor, Ra, and
the corporate tax rate is 0; the equation becomes:
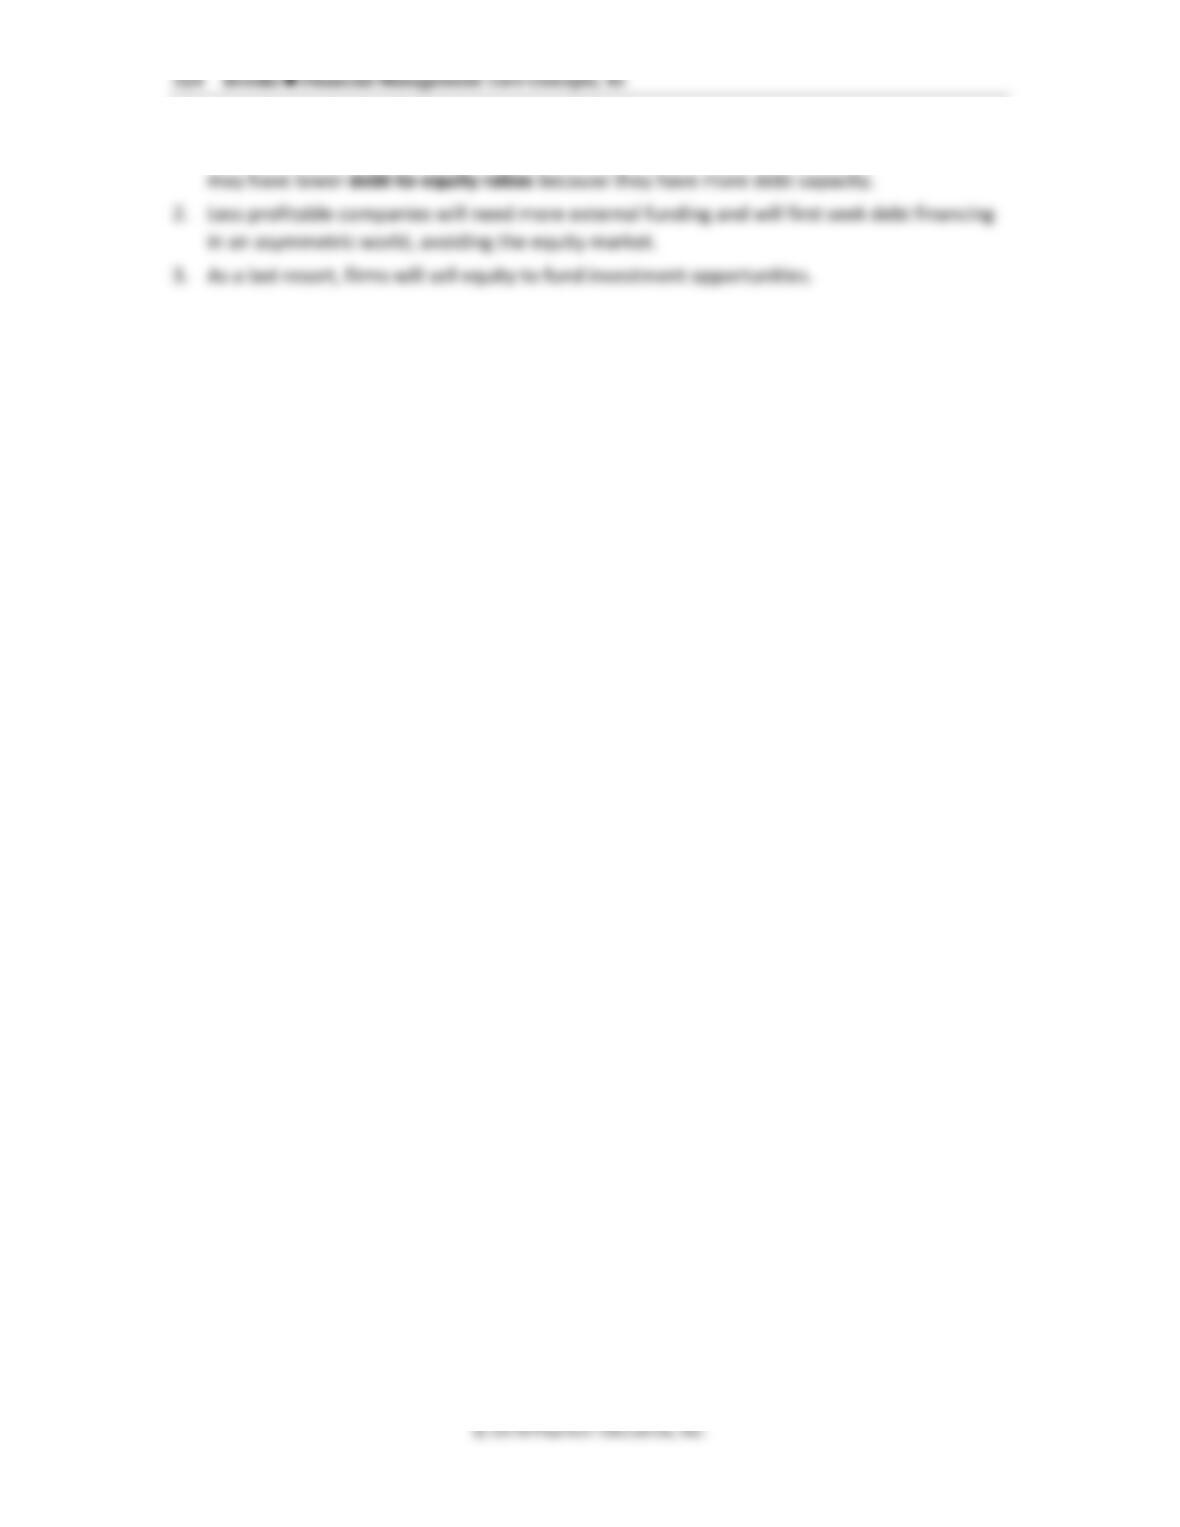
Because V = D + E, we can manipulate equation 16.3 to solve for the cost of equity (Re) as shown
in Equation 16.4:
➔Ra = [(E/V)* Re] + [(D/V)Rd]
➔[(E/V* Re] = Ra – [(D/V*Rd]
➔Re = Ra*V/E – D/E*Rd
Chapter 16 ◼ Capital Structure 527
Because V = D + E, we have
➔Re = Ra*(D + E)/E – D/E*Rd
➔Re = Ra*(1 + D/E) – D/E*Rd
➔Re = Ra + D/E*Ra – D/E*Rd
➔Re = Ra + D/E(Ra – Rd)
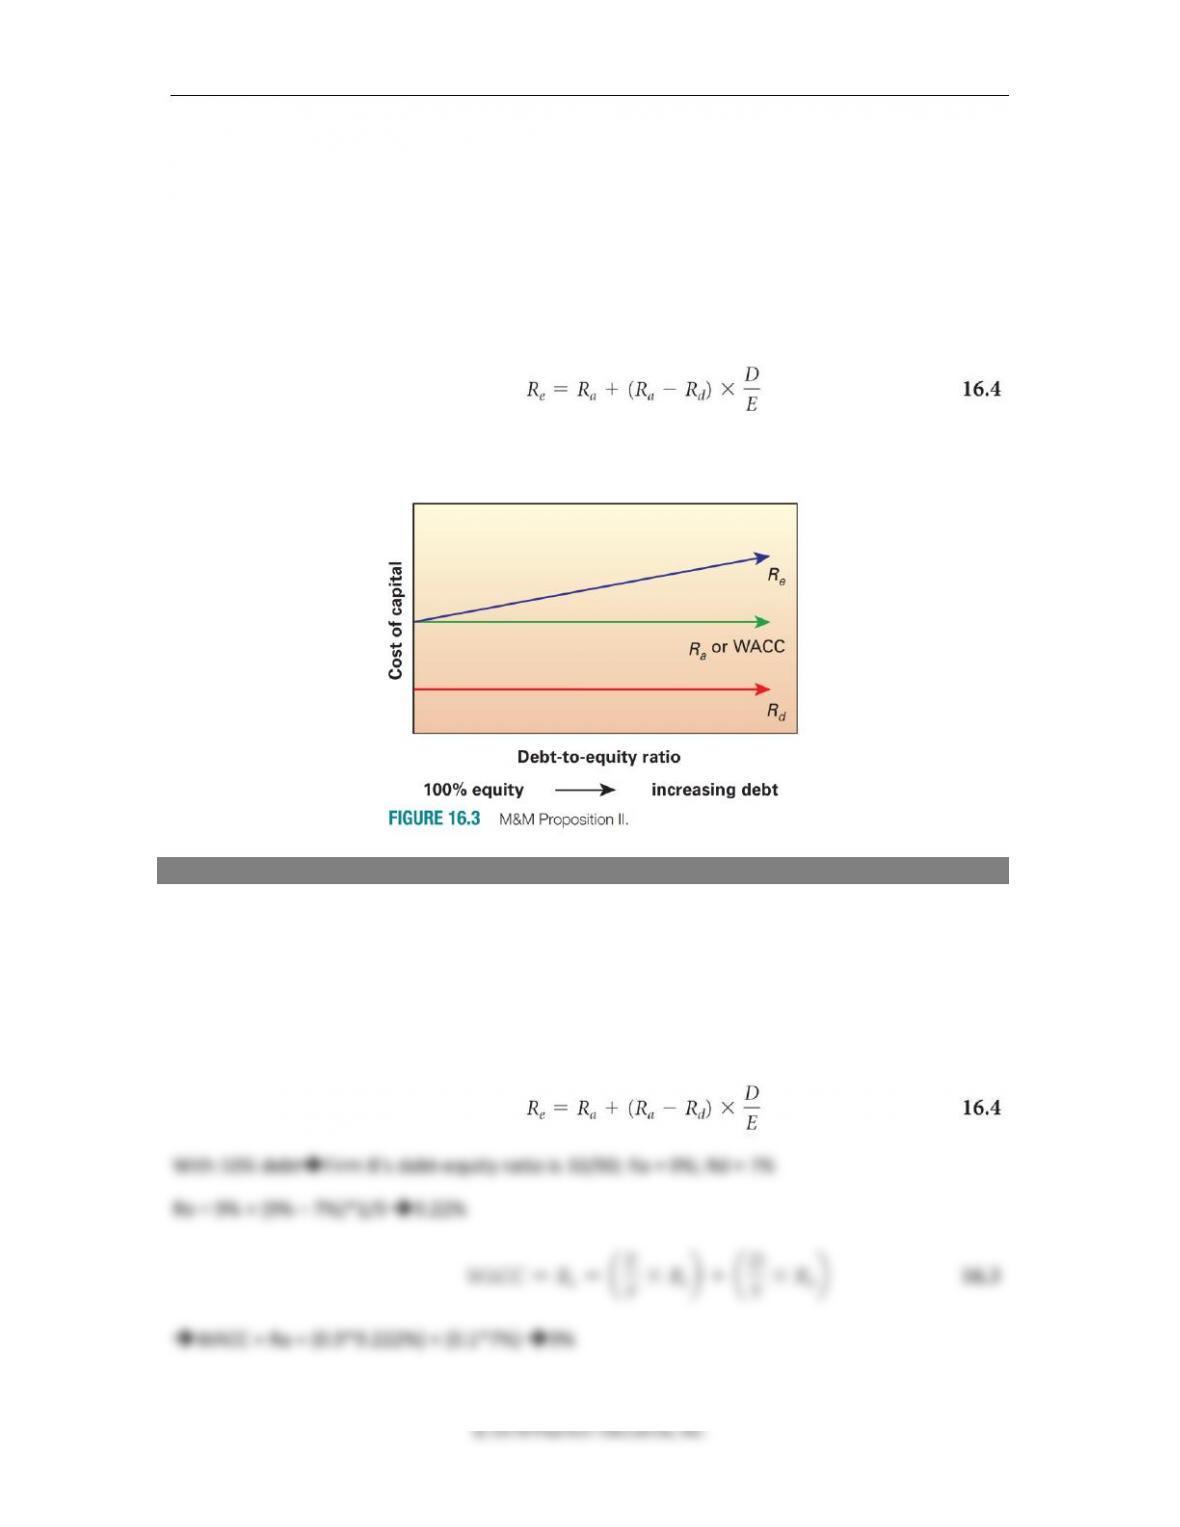
Figure 16.3 illustrates the trade-off between higher levels of debt and higher cost of equity, as
implied in Equation 16.4
Example 2: Applying M&M’s Propositions I and II in a world with no taxes
Firm A is an all-equity firm with a required return on its assets of 9%. Firm B is a levered firm and
can borrow in the debt market at 7%. Both companies operate in a utopian world of no taxes
and no bankruptcy (no risk). If M&M Proposition II holds, what is the cost of equity as firm B
goes from (a) having 10% debt to (b) 40% debt and finally to (c) 90% debt. Which capital
structure would be the best for this levered firm? To solve this problem, we need to calculate
the cost of equity, and the WACC, of Firm B under the three different capital structures given.
528 Brooks ◼ Financial Management: Core Concepts, 4e
© 2018 Pearson Education, Inc.
With 40% debt➔D/E = 40/60
Re = 9% + (9% – 7%)*0.667➔10.334%
WACC = 0.6*10.334% + 0.4*7% ➔9%
With 90% debt➔D/E = 90/10
Re = 9% + (9% – 7%)*9 ➔27%
WACC = 0.1*27% + 0.9*7% ➔9%
Because the WACC of the levered firm is the same as that of the all-equity firm (9%) in all three
scenarios, we can say that debt does not matter.
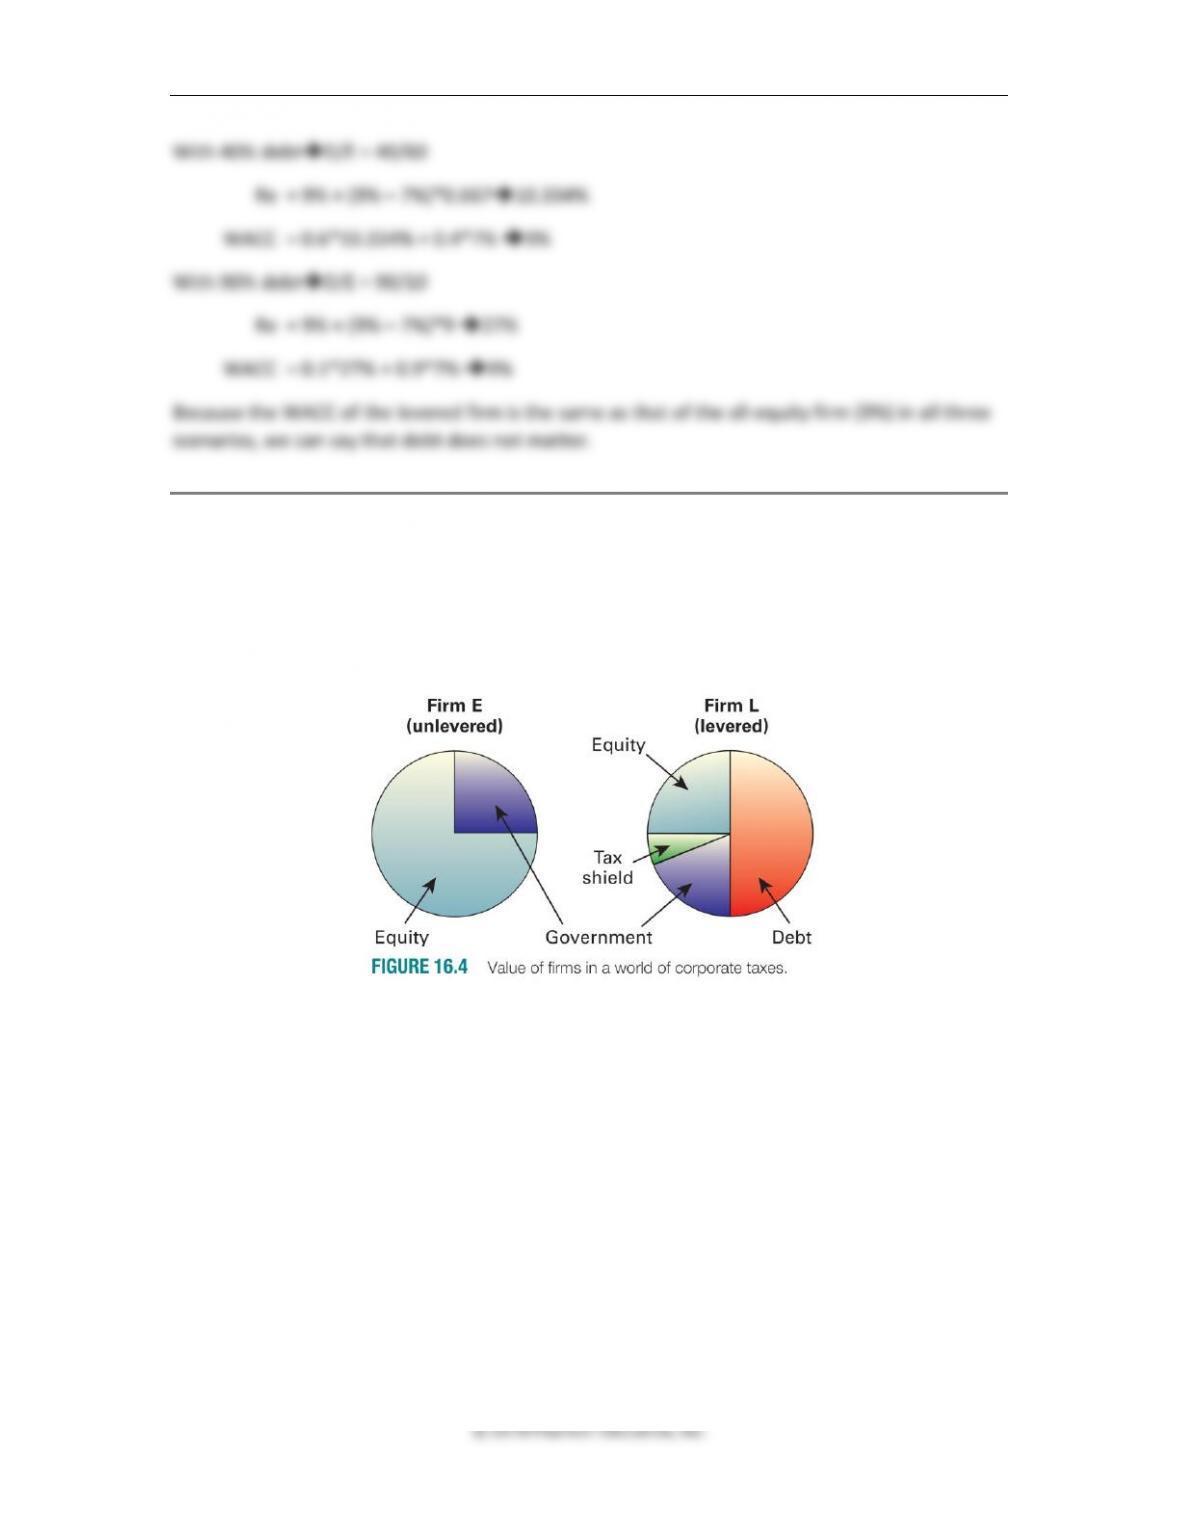
Capital Structure in a World of Corporate Taxes and No Bankruptcy
Once M&M injected some reality into their capital structure discussion, i.e., that taxes are a way
of life, their Propositions I and II got turned around. With interest being tax-deductible, the
levered firm pays less tax on its income than an all–equity firm, and the equity holders enjoy
more in residual profits as portrayed in Figure 16.4.
As the firm issues more debt, its tax shield increases, and the government’s share of the pie
decreases, increasing the value of the equity holders.
The new Propositions I and II are as follows:
Proposition I, with taxes: All debt financing is optimal.
Proposition II, with taxes: The WACC of the firm falls as more debt is added.
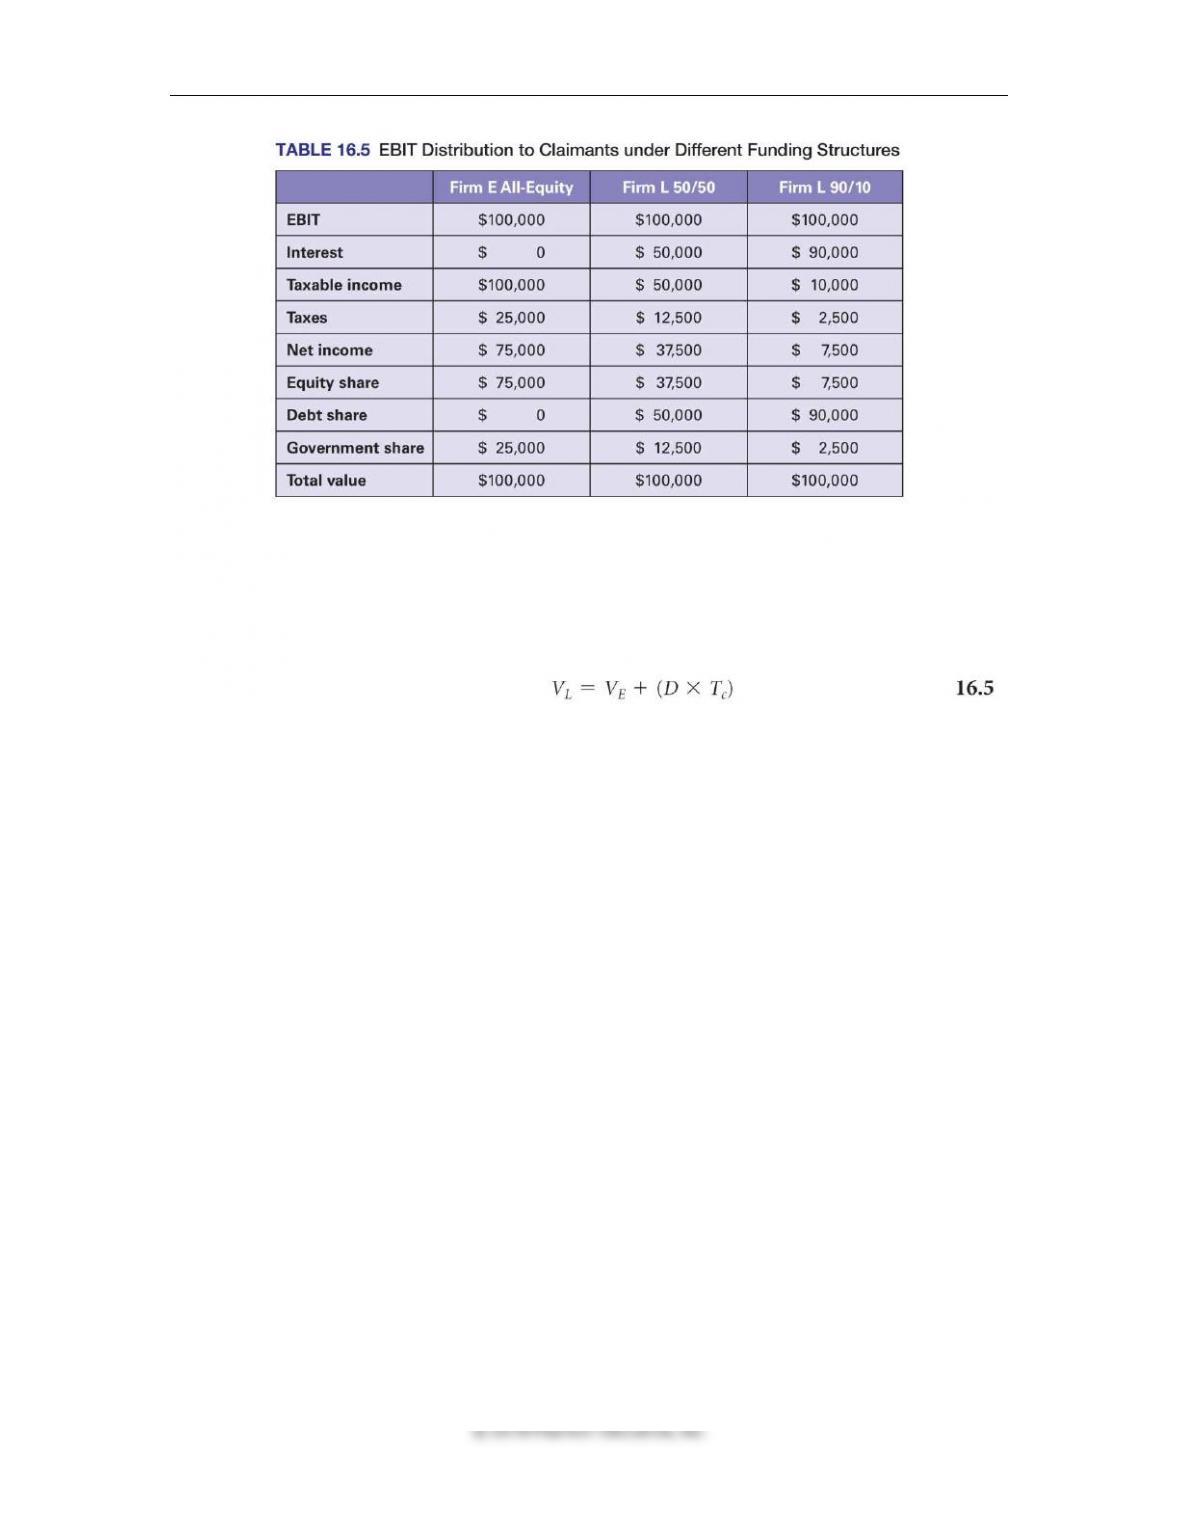
Debt and the Tax Shield: Table 16.5 shows the effect of increasing debt levels on the
distribution of a firm’s EBIT.
Chapter 16 ◼ Capital Structure 529
Note that as the firm’s debt level goes from 0% to 90%, with EBIT staying constant at $100,000,
government’s share of EBIT (taxes) dwindles from $25,000 to $2,500, thereby increasing the
share of debt and equity holders from $75,000 to $97,500.
Equation 16.5 sums up M&Ms Proposition I in a world with corporate taxes as follows:
It shows that the value of a levered firm is greater than the value of an unlevered firm by the
amount of the tax shield from selling debt, i.e., D*Tc.
530 Brooks ◼ Financial Management: Core Concepts, 4e
The WACC equation (with Tc > 0) shows that the cost of capital is reduced as the firm gets more
levered.
Example 3: Equity value in a levered company
An all-equity firm has a value of $8 million dollars and is currently being taxed 34% on its EBIT.
The WACC for the company is currently at 16%. The current CEO who has just learned about
M&Ms capital structure theory wants to sell $4 million worth of debt to take advantage of the
tax shield on interest and accordingly increase the value of the firm for the equity holders. Is he
justified in doing so? Please explain.
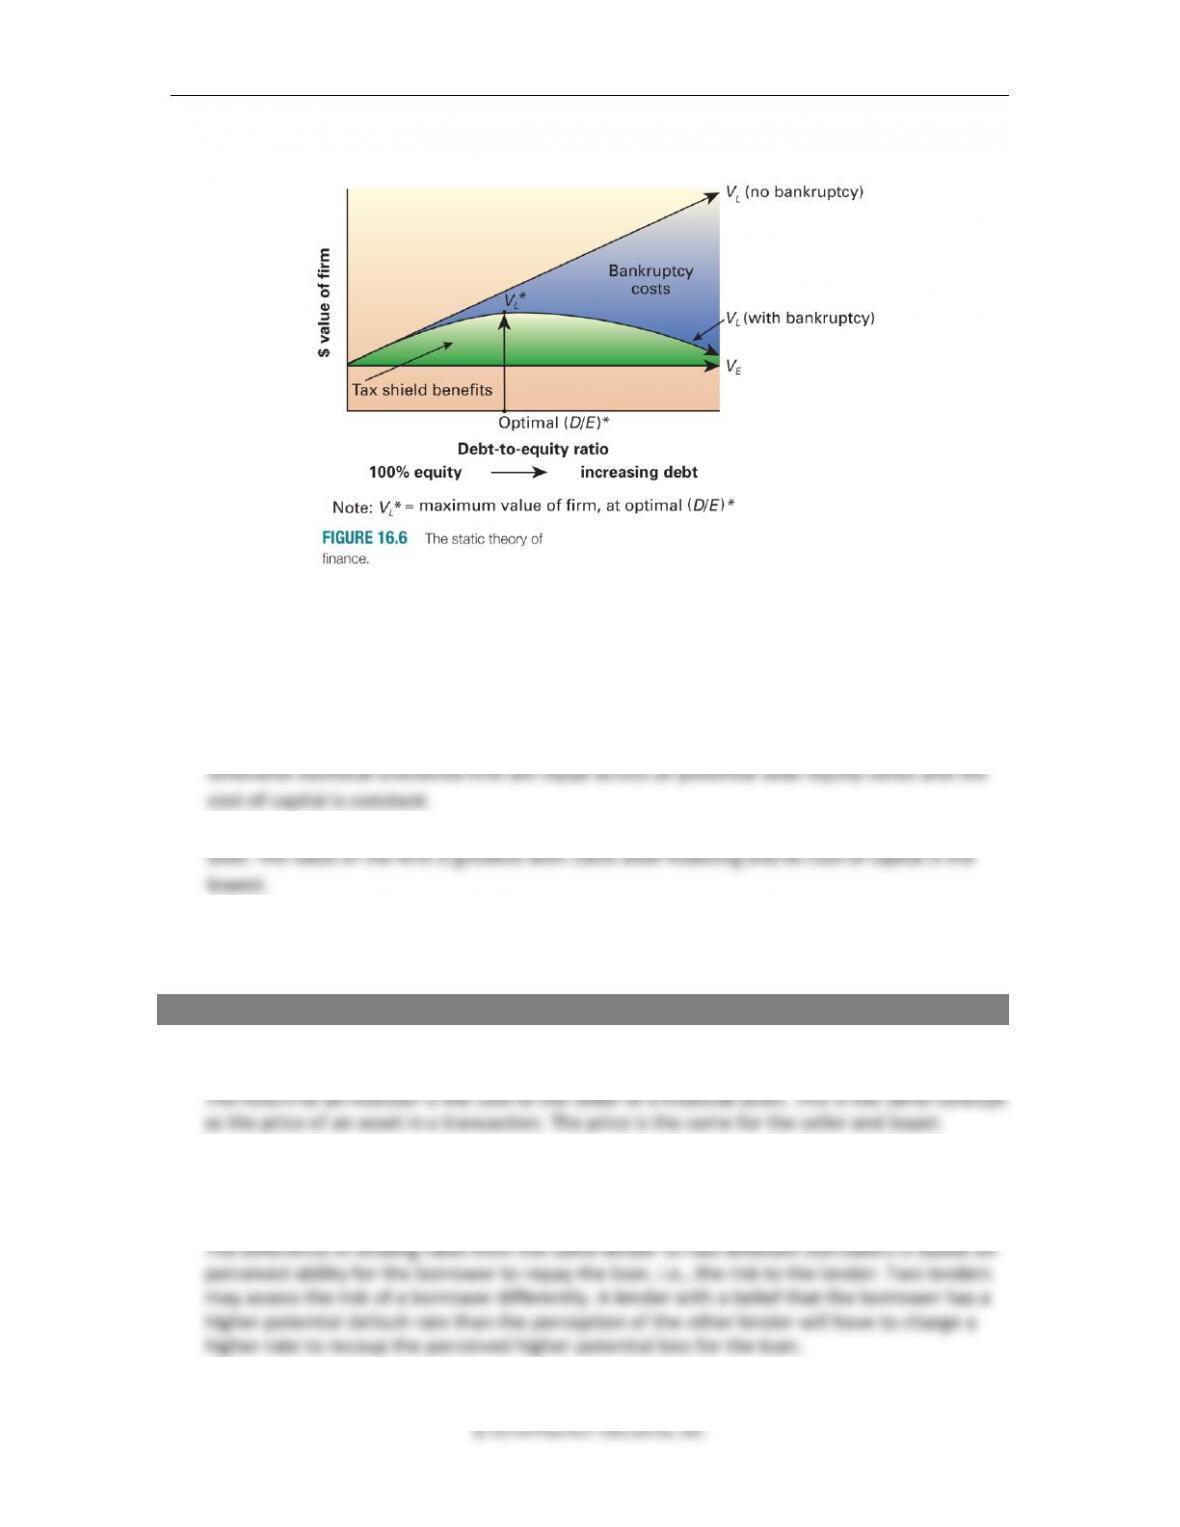
16.6 The Static Theory of Capital Structure (Slides 16-34 to 16-37)
So if increasing debt levels leads to increasing firm values, why do firms not attempt to go for
maximum debt? The answer is bankruptcy risk.
Bankruptcy is the risk of losing the firm due to inability of a firm to pay its debt and other
obligations. At bankruptcy, the value of equity is equal to zero, and the value of the firm’s assets
is equal to or probably less than its liabilities. Bankruptcy entails both direct and indirect costs.
Direct costs include the legal and administrative fees necessary to settle the claims of creditors
etc.
Indirect costs of bankruptcy, called financial distress costs, include lost sales, loss of valuable
employees, loss of consumer confidence, and loss of profitable opportunities while facing
bankruptcy.
The greater the amount of debt carried by a firm, the greater the chance of bankruptcy and
therefore the higher the potential financial distress costs.
Chapter 16 ◼ Capital Structure 531
Static Theory of Capital Structure
The optimal capital structure (i.e., D/E)* comes at the point where the additional tax-shield
benefit of adding one more dollar of debt financing is equal to the direct and indirect cost of
bankruptcy from that extra dollar of debt as shown in Figure 16.6.
The three scenarios discussed in this chapter lead to the following conclusions:
1. No taxes, no bankruptcy. Debt is irrelevant because the values of levered firms and
2. Taxes, no bankruptcy. The value of a firm increases by the amount of the tax shield due to
3. Taxes, bankruptcy. The value of a firm is maximized and its cost of capital is minimized at
the point where the marginal benefit of financial leverage (the tax shield) equals the
marginal cost of bankruptcy (financial distress costs).
Questions
1. What is the difference between the return to an investor or lender and the cost to the
borrower?
2. Why would one lender charge different rates to different borrowers for the same loan?
Why would two different lenders charge different rates to the same borrower for the
same loan?
© 2018 Pearson Education, Inc.
10. In a world of taxes and no bankruptcy, why is a company’s optimal capital structure all
debt? What happens when a company adds bankruptcy to the world of taxes with regard
to the optimal capital structure?
11. In the static theory of capital structure, what is static?
12. In the static theory of capital structure, how do you find a firm’s optimal capital structure?
In other words, what benefit are you receiving as you add debt, and what cost are you
incurring when you add debt?
534 Brooks ◼ Financial Management: Core Concepts, 4e
Prepping for Exams
1. b
2. c
Problems
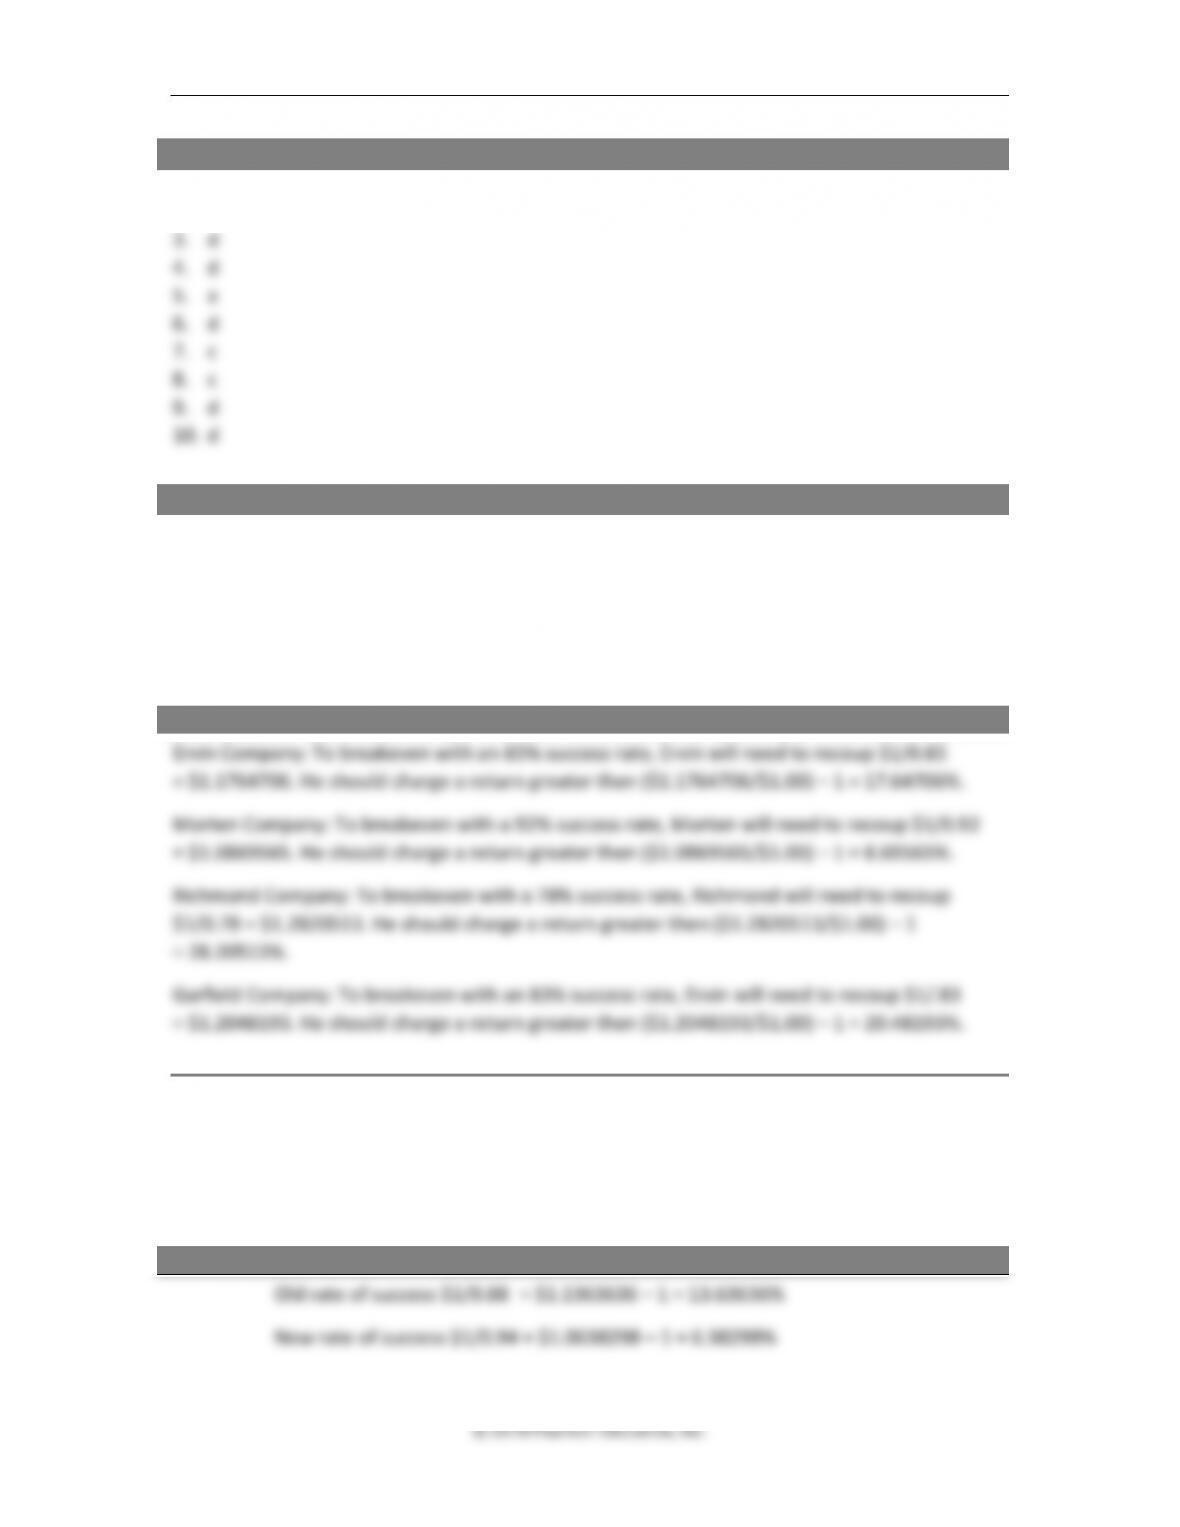
1. Different loan rates. Winthrop Enterprises is a holding company (a firm that owns all or
most of some other companies’ outstanding stock). Winthrop has four subsidiaries. Each
subsidiary borrows capital from the parent company for projects. Ervin Company is
successful with its projects 85% of the time, Morten Company 92% of the time, Richmond
Company 78% of the time, and Garfield Company 83% of the time. What loan rates should
Winthrop Enterprises charge each subsidiary for loans?
ANSWER
2. Different loan rates. Keith Peterson is the CFO of Springfield Soups and Sauces. The
company’s typical success rate for new products is 88%. Keith wants to improve this success
rate to 94%. What loan improvement (in terms of rates) would do that for Springfield Soups
and Sauces?
ANSWER

Chapter 16 ◼ Capital Structure 535
© 2018 Pearson Education, Inc.
Loan rate improvement: 7.253385%


Chapter 16 ◼ Capital Structure 537
© 2018 Pearson Education, Inc.
$450,000X + $250,000X – $250,000 = $300,000
X = 78.571429%