488 Brooks ◼ Financial Management: Core Concepts, 4e
© 2018 Pearson Education, Inc.
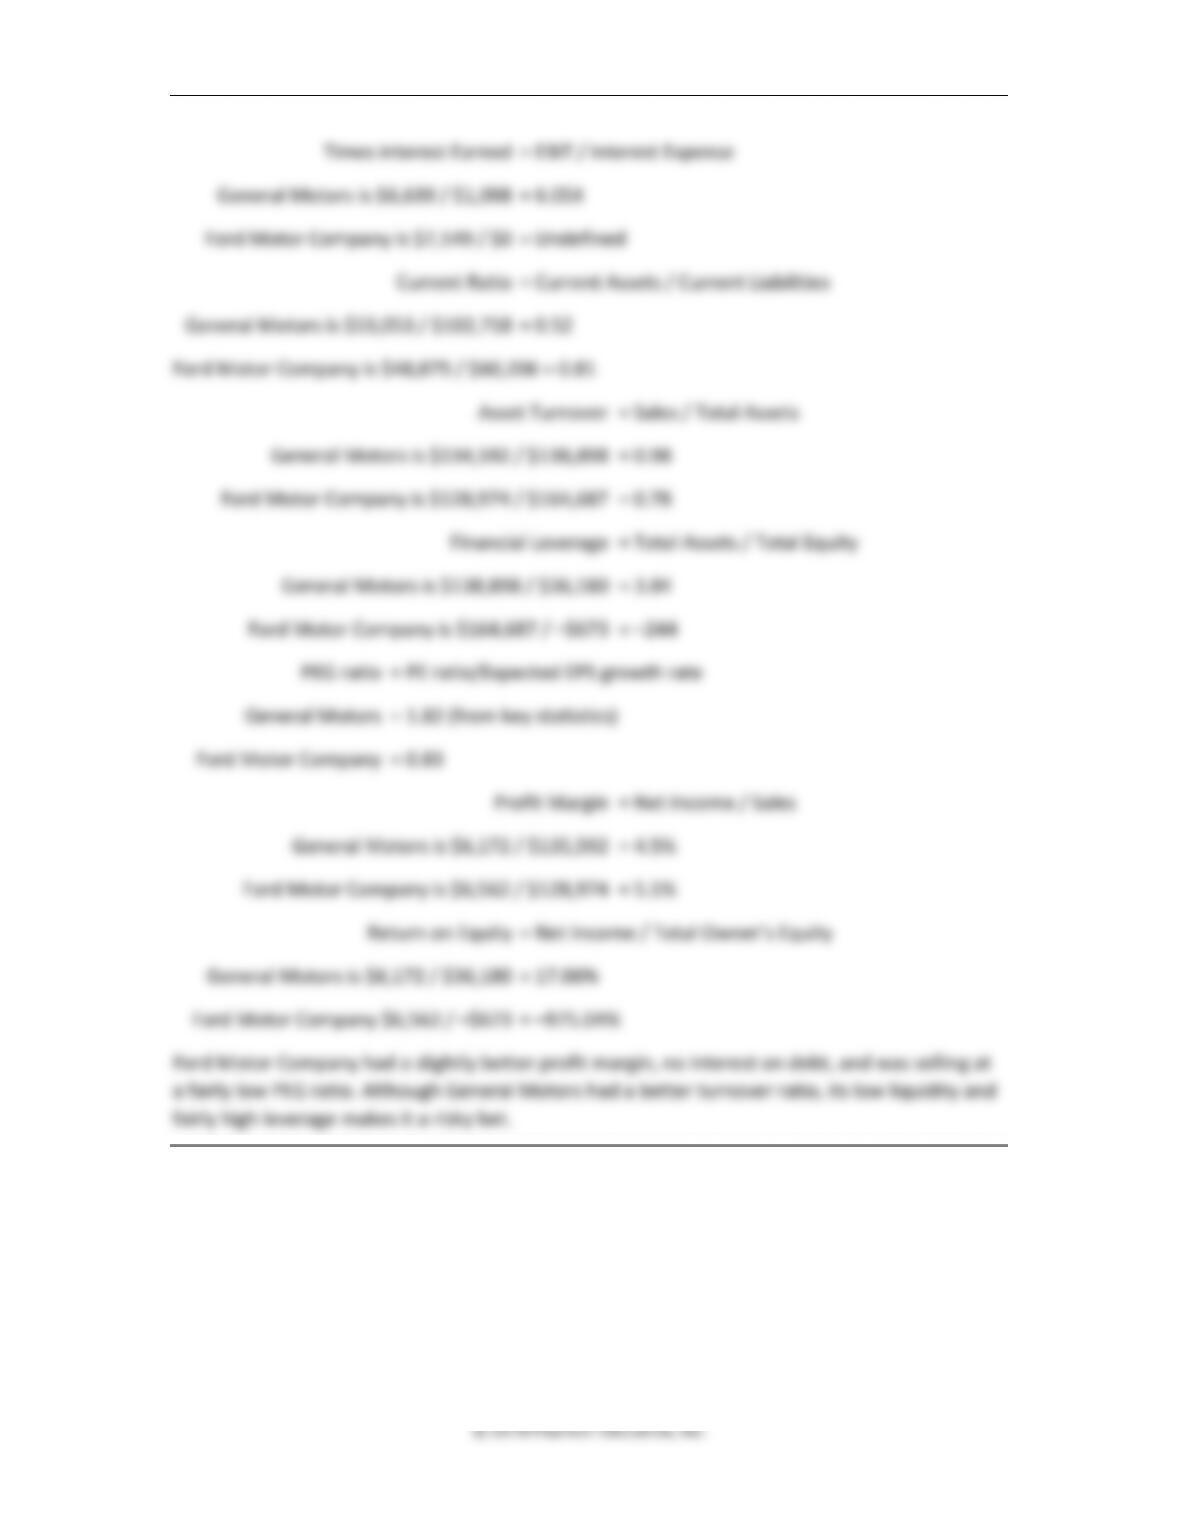
Times interest Earned = EBIT / Interest Expense
General Motors is $6,639 / $1,098 = 6.05X
Ford Motor Company is $7,149 / $0 = Undefined
Current Ratio = Current Assets / Current Liabilities
General Motors is $53,053 / $102,718 = 0.52
Ford Motor Company is $48,875 / $60,206 = 0.81
Asset Turnover = Sales / Total Assets
General Motors is $134,592 / $138,898 = 0.98
Ford Motor Company is $128,974 / $164,687 = 0.78
Financial Leverage = Total Assets / Total Equity
General Motors is $138,898 / $36,180 = 3.84
Ford Motor Company is $164,687 / –$673 = –244
PEG ratio = PE ratio/Expected EPS growth rate
General Motors = 1.82 (from key statistics)
Ford Motor Company = 0.83
Profit Margin = Net Income / Sales
General Motors is $6,172 / $135,592 = 4.5%
Ford Motor Company is $6,562 / $128,974 = 5.1%
Return on Equity = Net Income / Total Owner’s Equity
General Motors is $6,172 / $36,180 = 17.06%
Ford Motor Company $6,562 / –$673 = –975.04%
Ford Motor Company had a slightly better profit margin, no interest on debt, and was selling at
a fairly low PEG ratio. Although General Motors had a better turnover ratio, its low liquidity and
fairly high leverage makes it a risky bet.
Chapter 14 ◼ Financial Ratios and Firm Performance 489
Solutions for Advanced Problems for Spreadsheet Application
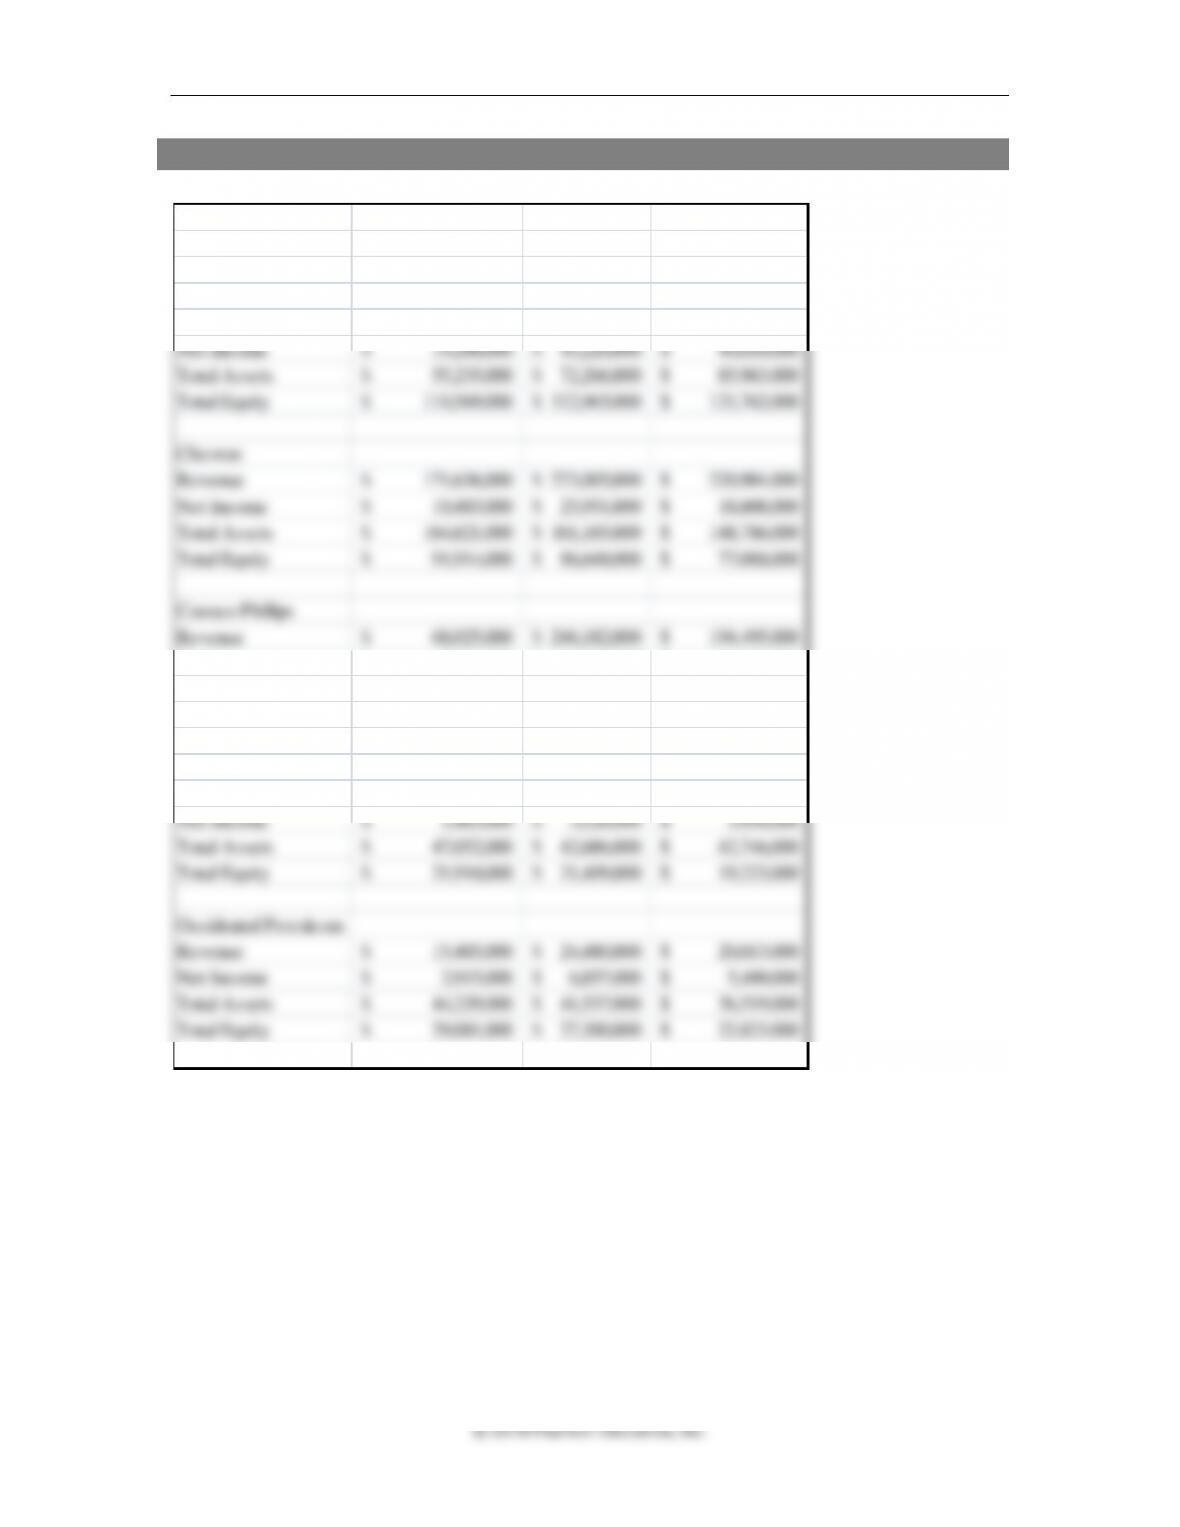
1. DuPont analysis. (Note: we used data for 2007–2009)
Oil Companies
DuPont Analysis
Company Data 2009 2008 2007
Exxon Mobil
Revenue 310,586,000$ 477,359,000$ 404,552,000$
Net Income 19,280,000$ 45,220,000$ 40,610,000$
Total Assets 55,235,000$ 72,266,000$ 85,963,000$
Total Equity 110,569,000$ 112,965,000$ 121,762,000$
Chevron
Revenue 171,636,000$ 273,005,000$ 220,904,000$
Net Income 10,483,000$ 23,931,000$ 18,608,000$
Total Assets 164,621,000$ 161,165,000$ 148,786,000$
Total Equity 91,914,000$ 86,648,000$ 77,088,000$
Conoco Phillips
Revenue 68,025,000$ 246,182,000$ 194,495,000$
Net Income 7,011,000$ (16,988,000)$ 11,891,000$
Total Assets 79,019,000$ 142,865,000$ 177,757,000$
Total Equity 55,991,000$ 55,165,000$ 88,983,000$
Marathon Oil
Revenue 54,139,000$ 78,569,000$ 65,207,000$
490 Brooks ◼ Financial Management: Core Concepts, 4e
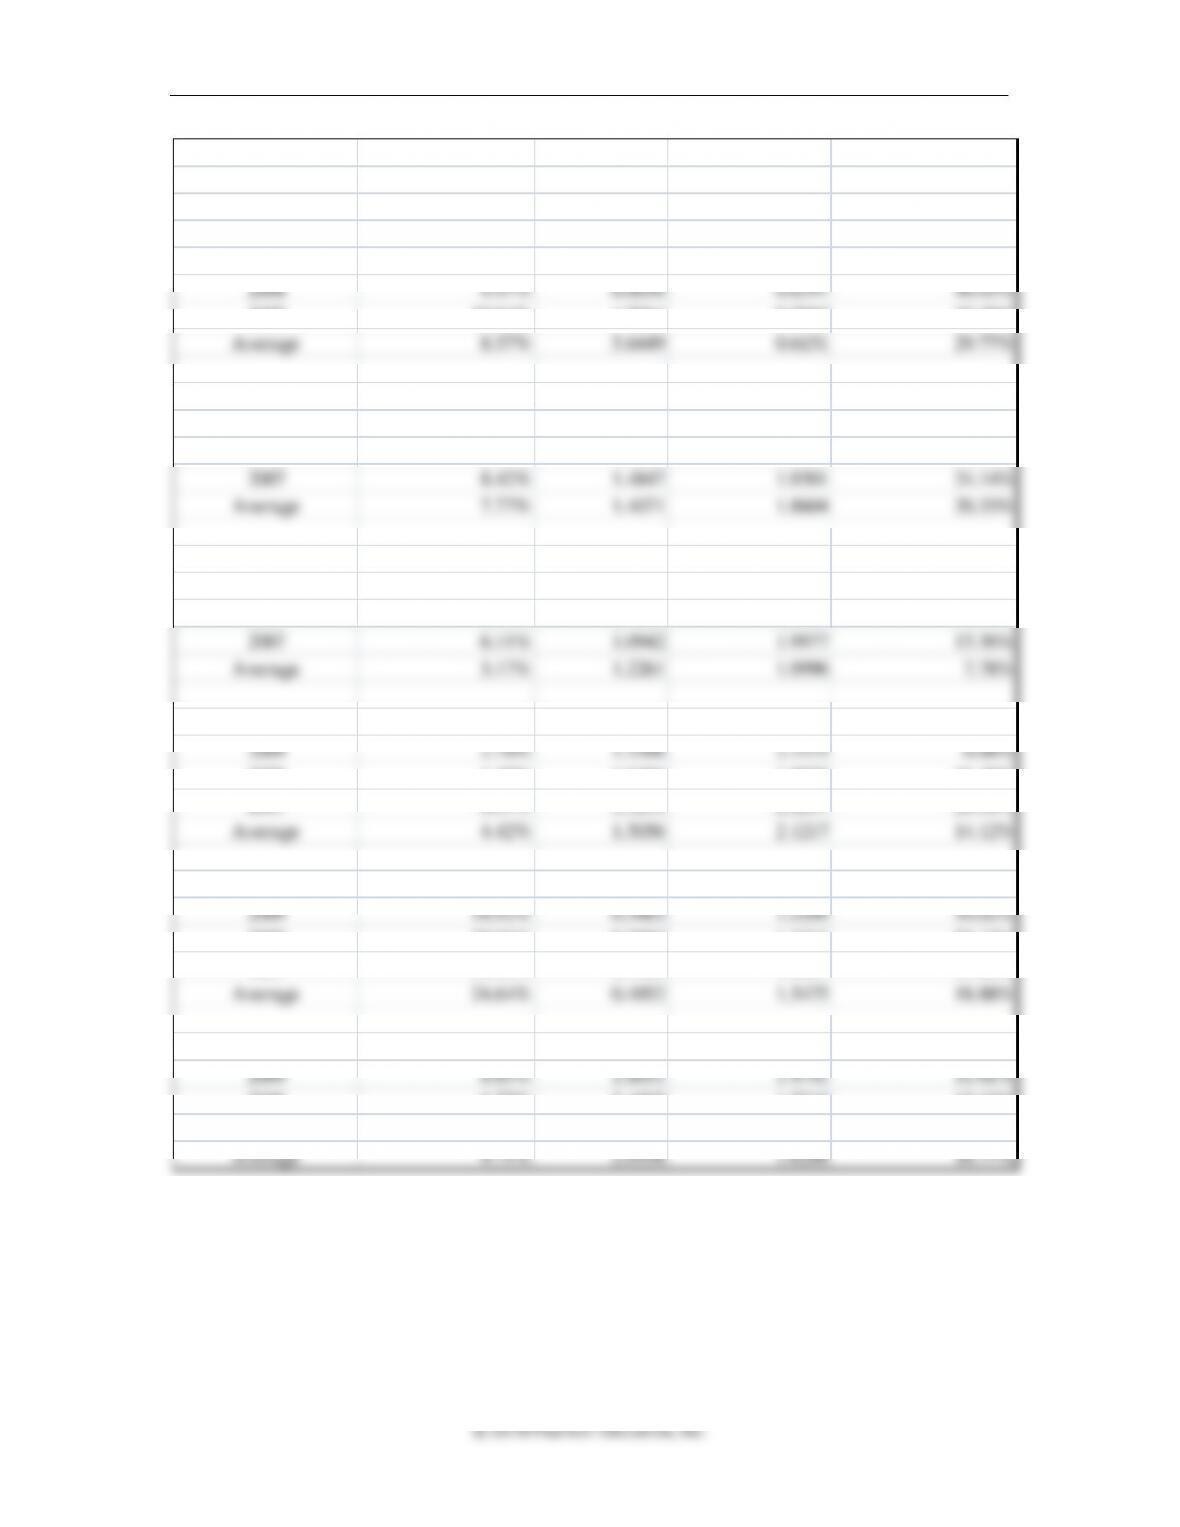
Table Of Ratios
2009
Company Operating Efficiency
Asset Mgmt Effi
Financial Leverage Return on Equity
Exxon Mobil
2009 6.21% 5.6230 0.4996 17.44%
2008 9.47% 6.6056 0.6397 40.03%
2007 10.04% 4.7061 0.7060 33.35%
Average 8.57% 5.6449 0.6151 29.77%
Chevron
2009 6.11% 1.0426 1.7910 11.41%
2008 8.77% 1.6939 1.8600 27.62%
2007 8.42% 1.4847 1.9301 24.14%
Average 7.77% 1.4071 1.8604 20.33%
Conoco Phillips
2009 10.31% 0.8609 1.4113 12.52%
2008 -6.90% 1.7232 2.5898 -30.79%
Average 3.17% 1.2261 1.9996 7.78%
Marathon Oil
2009 2.70% 1.1506 2.1475 6.68%
2008 4.49% 1.8406 1.9938 16.48%
2007 6.07% 1.5255 2.2237 20.58%
Occidental Petroleum
2009 18.92% 0.3483 1.5209 10.02%
2008 28.01% 0.5894 1.5215 25.12%
2007 26.98% 0.5480 1.6001 23.66%
Industry
2009 8.85% 1.8051 1.4741 11.61%
2007 11.52% 1.8717 1.6915 23.02%
Average 9.71% 2.0558 1.6288 16.77%
492 Brooks ◼ Financial Management: Core Concepts, 4e
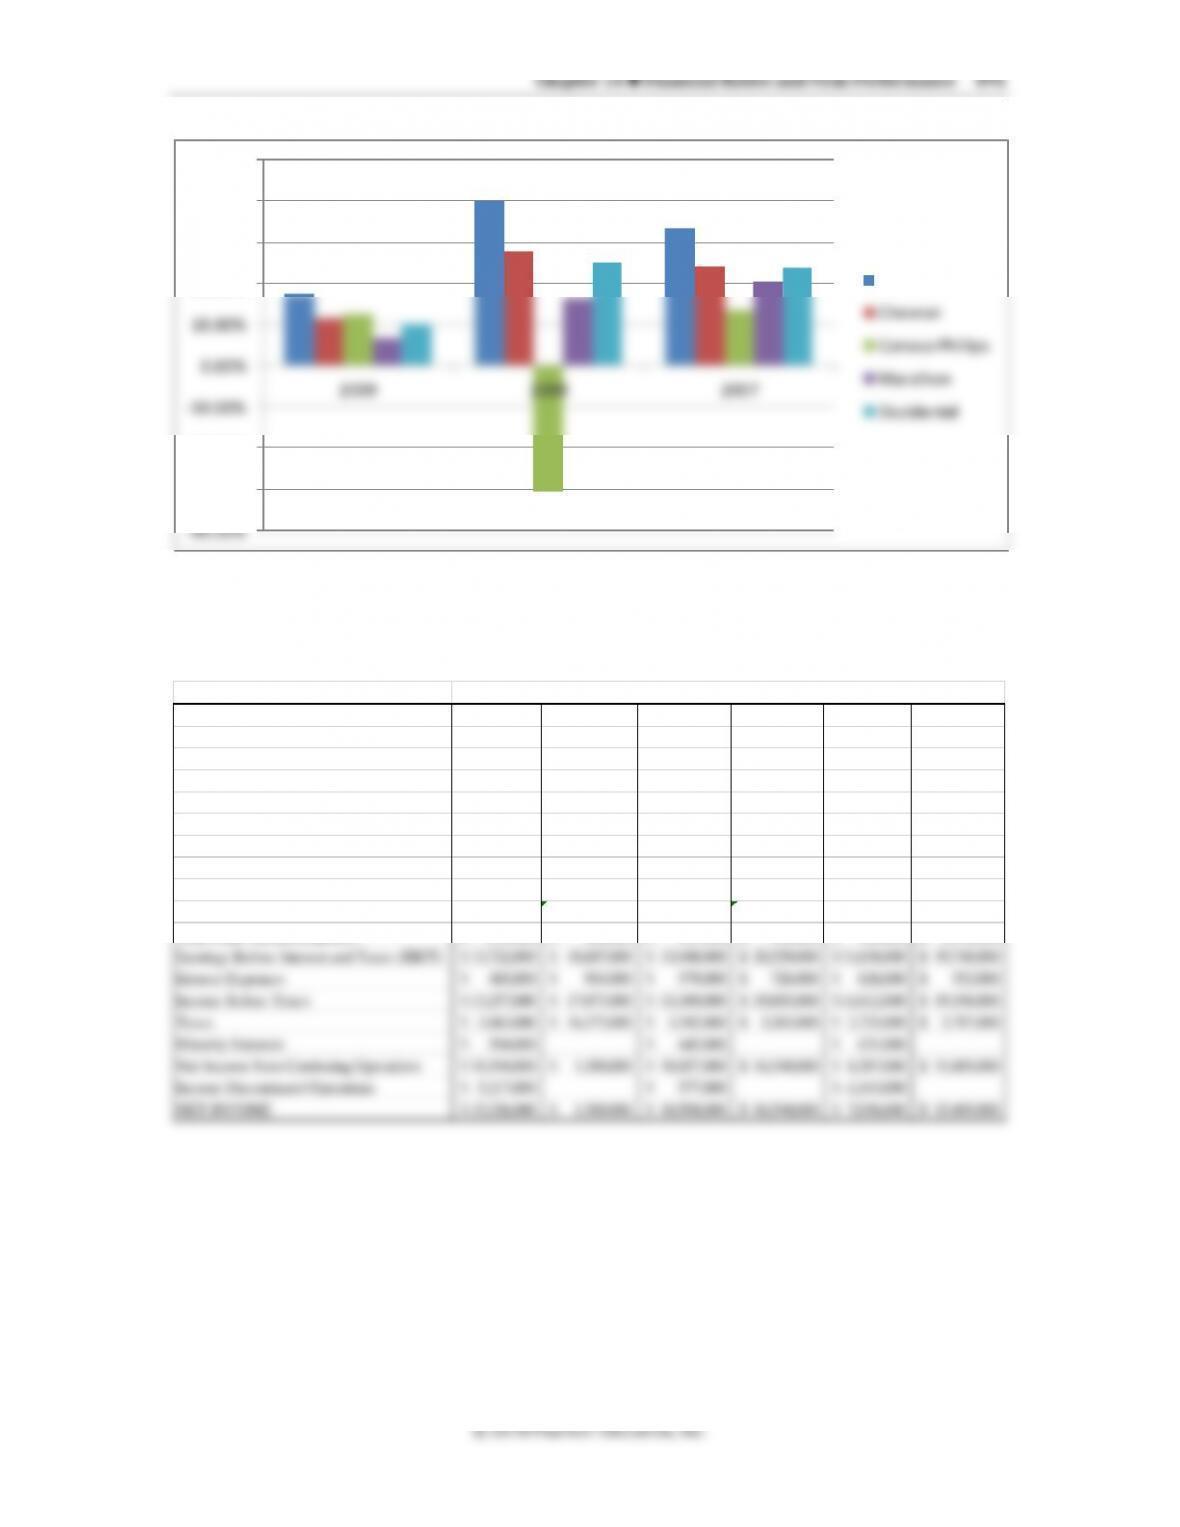
Common Size Income Statements PG 2017 JNJ 2017 PG 2016 JNJ 2016 PG 2015 JNJ 2015
Total Revenue 100.00% 100.00% 100.00% 100.00% 100.00% 100.00%
Cost of Revenue 50.01% 33.16% 50.40% 30.16% 52.38% 30.73%
Gross Profit 49.99% 66.84% 49.60% 69.84% 47.62% 69.27%
Operating Expenses
Research and Development 13.81% 12.65% 12.91%
Selling, General and Administrative 28.54% 28.02% 29.02% 27.74% 32.01% 30.26%
Non–Recurring 0.94% 0.72% 1.05%
Operating Income 21.45% 24.07% 20.58% 28.72% 15.62% 25.05%
Total Other Income/Expenses –0.36% 0.26% 0.78% –0.16% 0.83% 3.13%
Earnings Before Interest and Taxes (EBIT) 21.09% 24.34% 21.36% 28.56% 16.45% 28.18%
Interest Expenses 0.71% 1.22% 0.89% 1.01% 0.88% 0.79%
Income Before Taxes 20.38% 23.12% 20.47% 27.55% 15.56% 27.39%
Taxes 4.71% 21.42% 5.12% 4.54% 3.85% 5.40%
Minority Interests 0.91% 0.98% 0.89%
Net Income from Continuing Operations 15.67% 1.70% 15.36% 23.01% 11.71% 21.99%
Income Discontinued Operations 8.02% 0.00% 0.88% –1.62%
NET INCOME 23.56% 1.70% 16.09% 23.01% 9.95% 21.99%
Chapter 14 ◼ Financial Ratios and Firm Performance 493
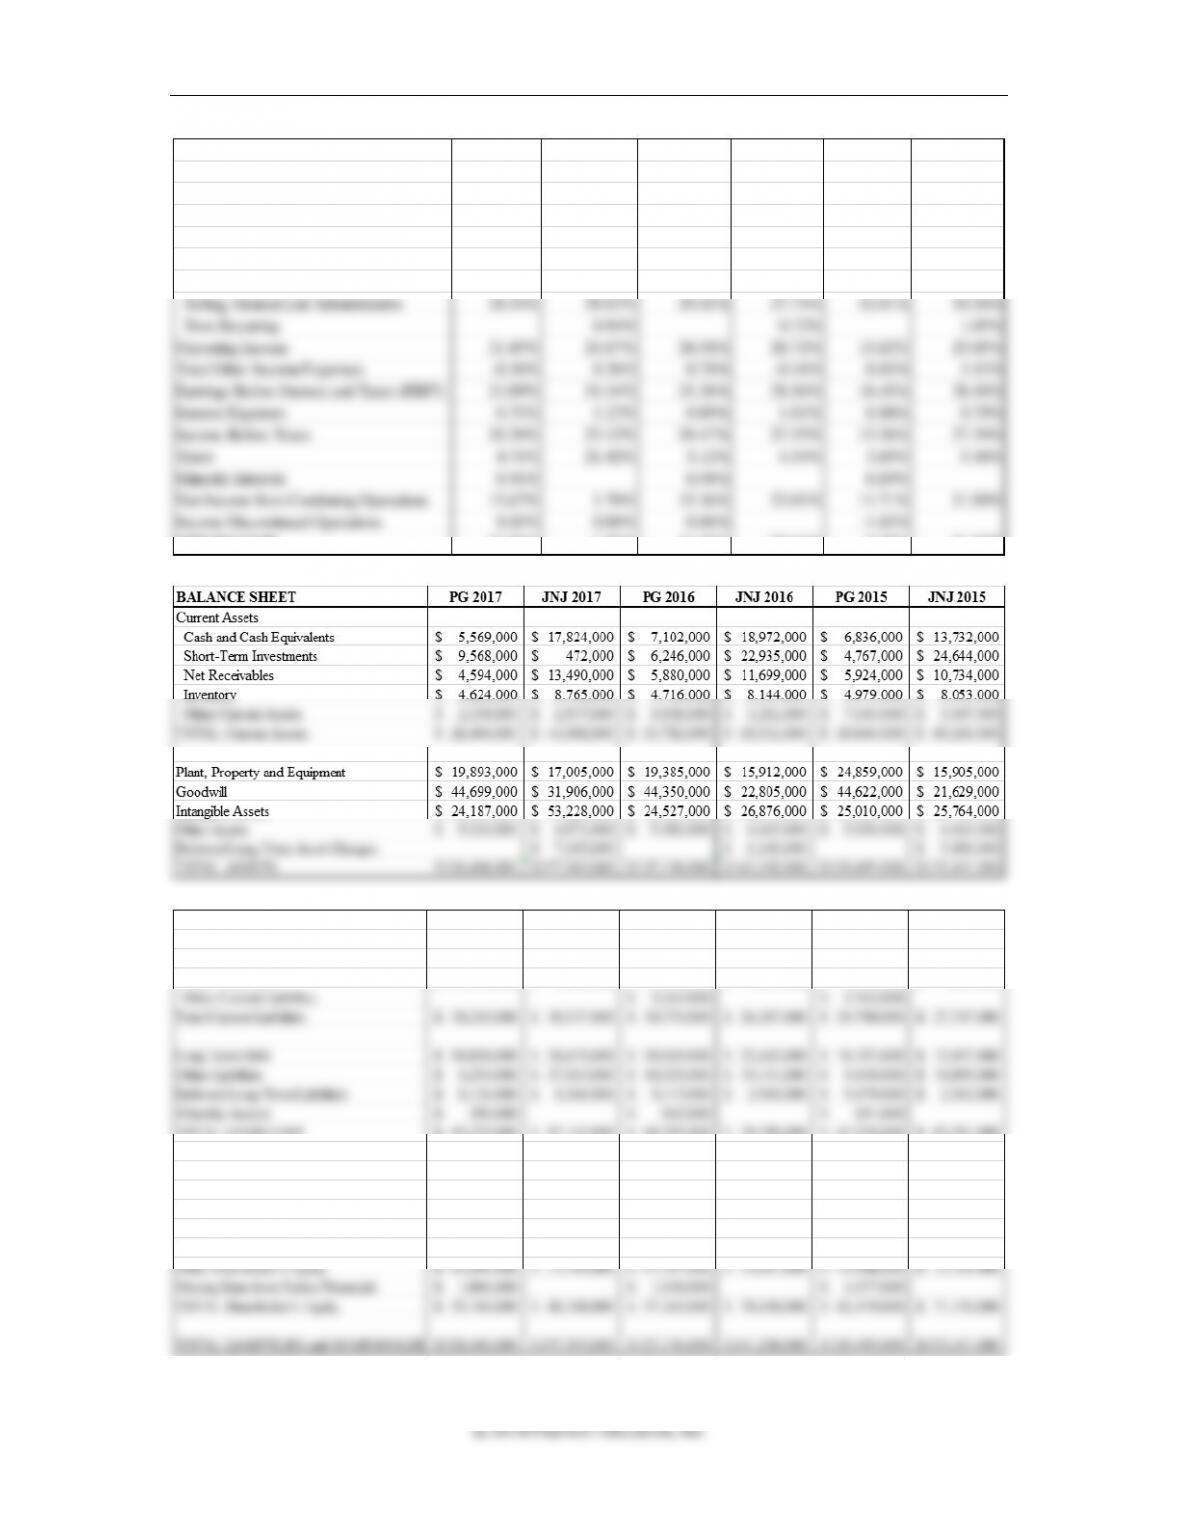
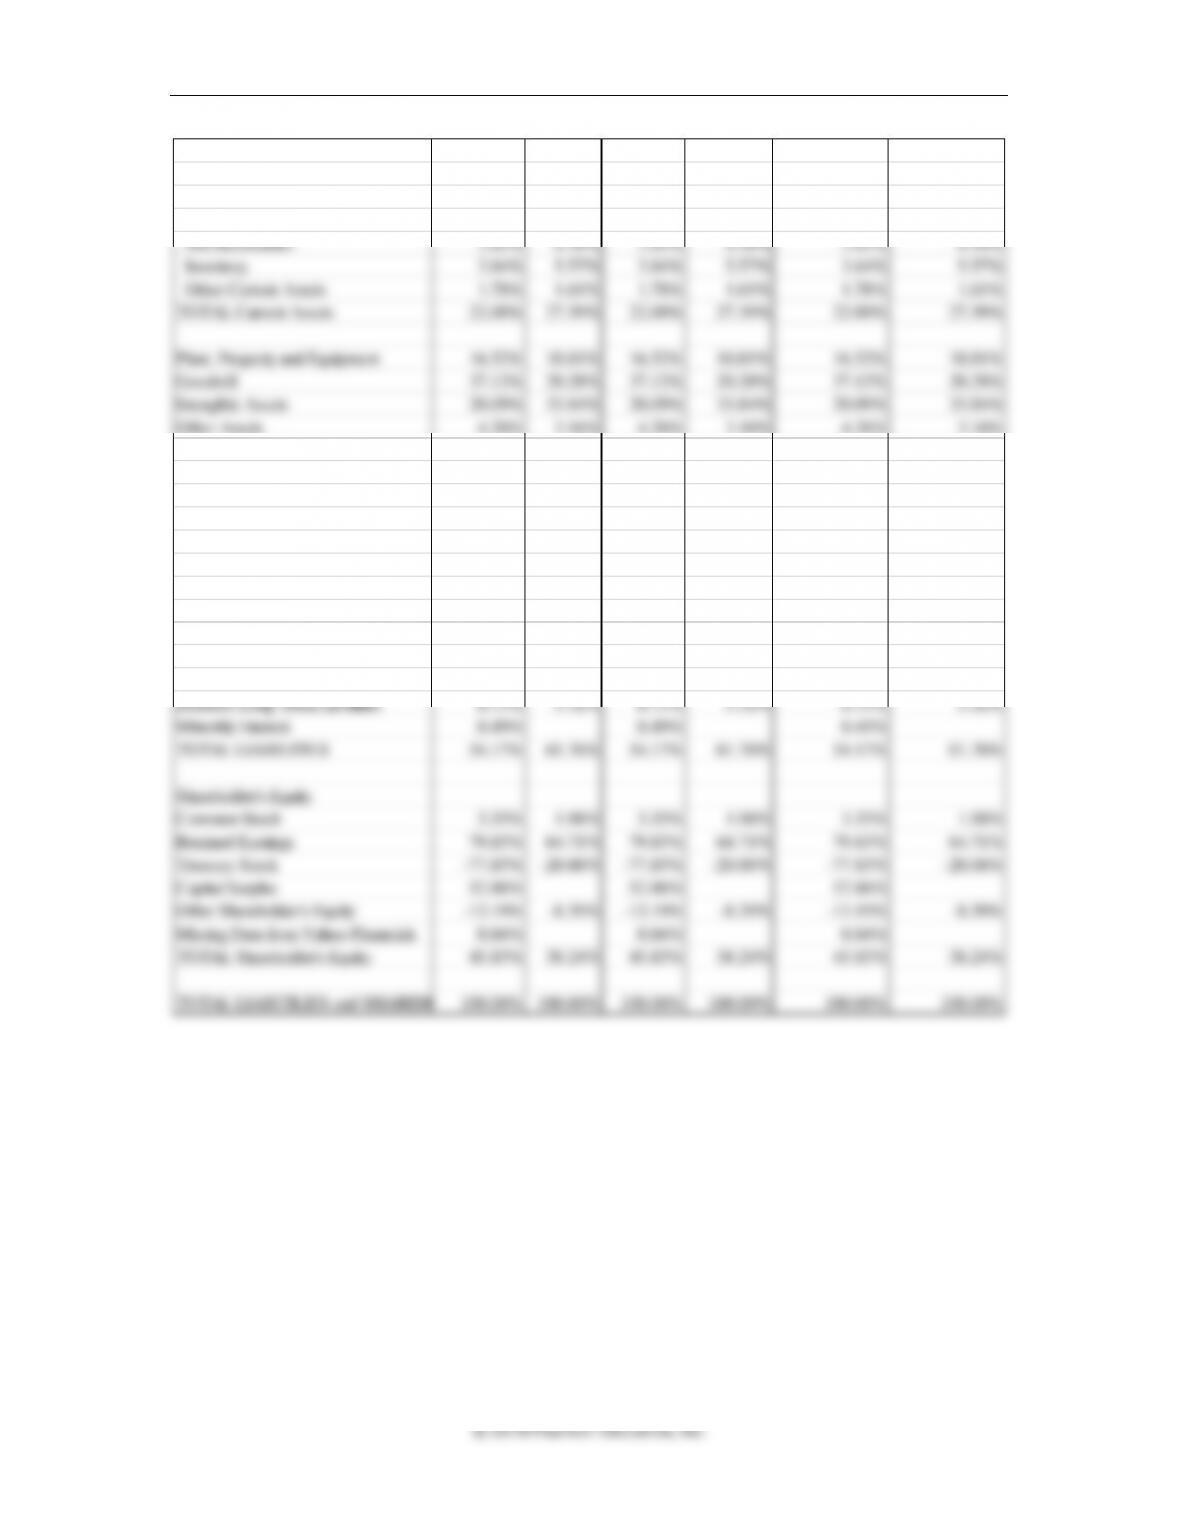
Common Size Balance Sheets PG 2017 JNJ 2017 PG 2016 JNJ 2016 PG 2015 JNJ 2015
Current Assets
Cash and Cash Equivalents 4.63% 11.33% 4.63% 11.33% 4.63% 11.33%
Short-Term Investments 7.95% 0.30% 7.95% 0.30% 7.95% 0.30%
Net Receivables 3.82% 8.58% 3.82% 8.58% 3.82% 8.58%
Inventory 3.84% 5.57% 3.84% 5.57% 3.84% 5.57%
Other Current Assets 1.78% 1.61% 1.78% 1.61% 1.78% 1.61%
TOTAL Current Assets 22.00% 27.39% 22.00% 27.39% 22.00% 27.39%
Plant, Property and Equipment 16.52% 10.81% 16.52% 10.81% 16.52% 10.81%
Goodwill 37.12% 20.28% 37.12% 20.28% 37.12% 20.28%
Intangible Assets 20.09% 33.84% 20.09% 33.84% 20.09% 33.84%
Other Assets 4.26% 3.16% 4.26% 3.16% 4.26% 3.16%
Deferred Long–Term Asset Changes 4.52% 4.52% 4.52%
TOTAL ASSETS 100.00% 100.00% 100.00% 100.00% 100.00% 100.00%
Current Liabilities
Accounts Payable 13.83% 16.93% 13.83% 16.93% 13.83% 16.93%
Short-Term Debt 11.26% 2.48% 11.26% 2.48% 11.26% 2.48%
Other Current Liabilities
Total Current Liabilities 25.09% 19.41% 25.09% 19.41% 25.09% 19.41%
Long–Term Debt 14.98% 19.50% 14.98% 19.50% 14.98% 19.50%
Other Liabilities 6.86% 17.52% 6.86% 17.52% 6.86% 17.52%
Deferred Long–Term Liabilities 6.75% 5.32% 6.75% 5.32% 6.75% 5.32%
Minoritiy Interest 0.49% 0.49% 0.49%
TOTAL Shareholder’s Equity 45.83% 38.24% 45.83% 38.24% 45.83% 38.24%
TOTAL LIABITILIES and SHAREHO
100.00% 100.00% 100.00% 100.00% 100.00% 100.00%
494 Brooks ◼ Financial Management: Core Concepts, 4e
Solutions to Mini-Case
Cranston Dispensers, Inc.: Part 2
This case requires students to prepare and interpret a statement of cash flows or sources and
uses, common-size statements, and financial ratios for a straightforward manufacturing firm,
which is based on a composite of firms in the dispenser and container industries. Students will
use the DuPont identity to isolate areas of strength and weakness. Finally, students are asked to
deduce, based on what they can observe in the statements, what internal variances may have
occurred.
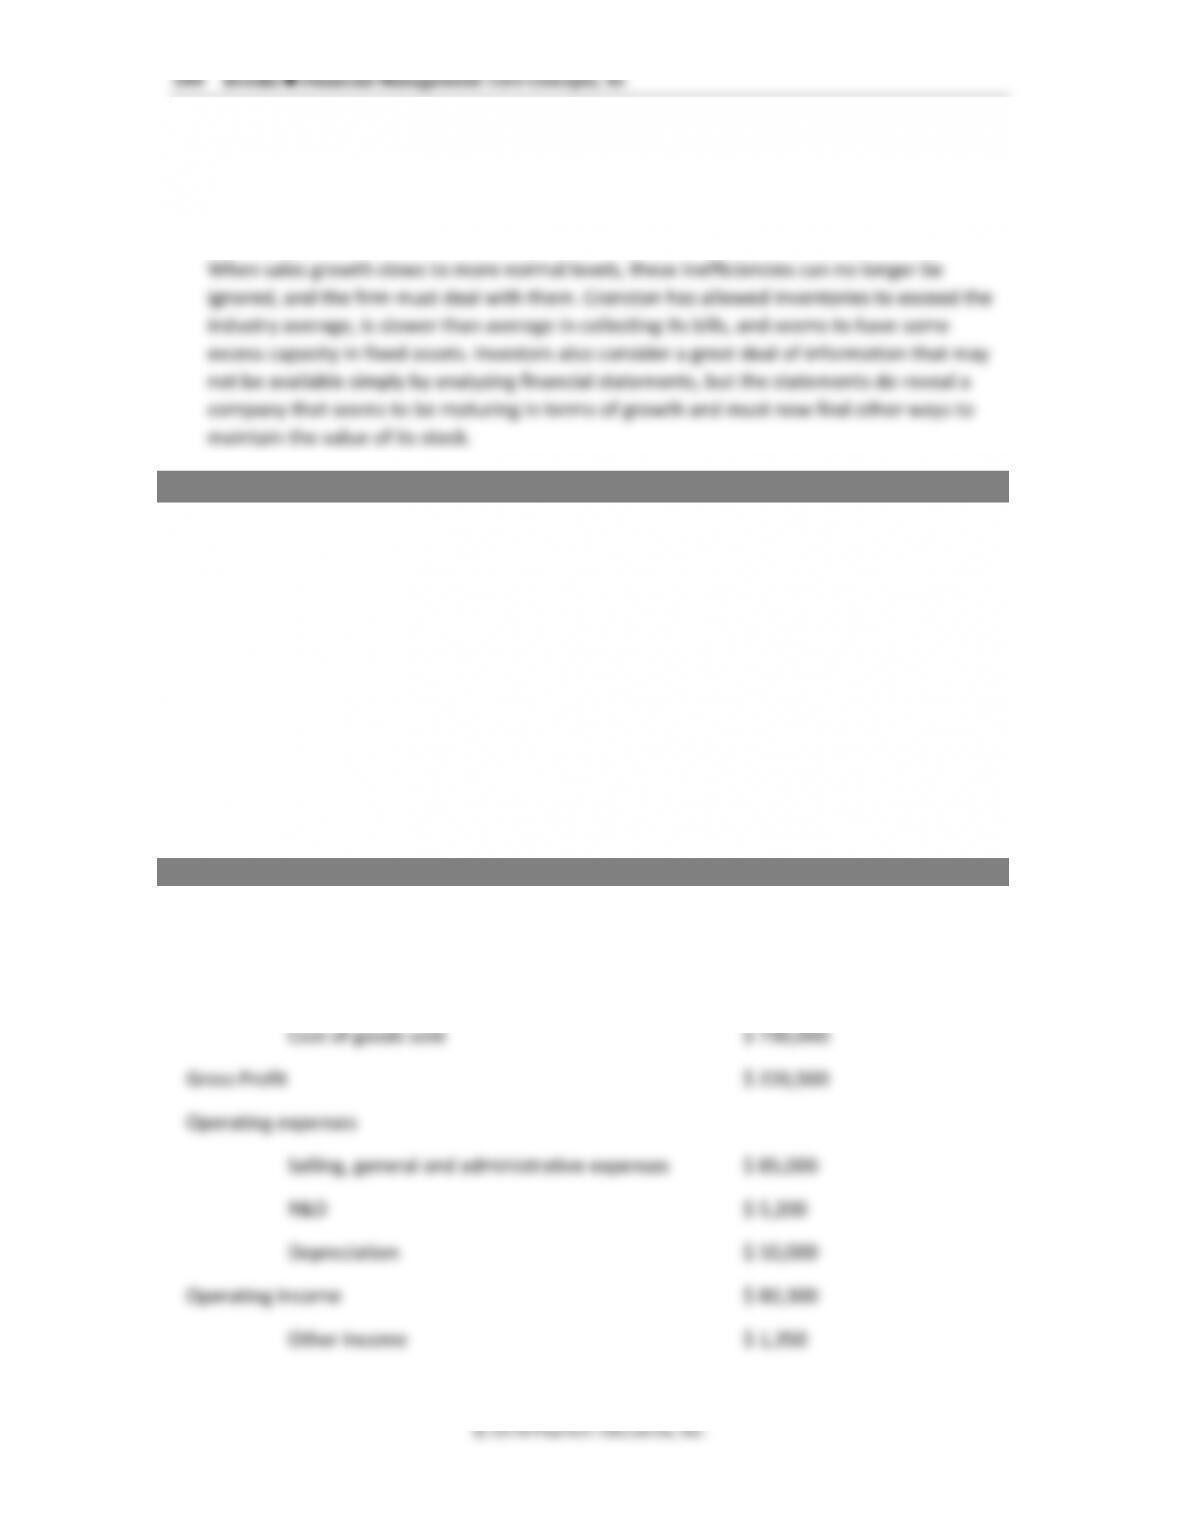
1. Following are Cranston’s common-size income statements and balance sheets for 2016
and 2015. Prepare common-size income statement and balance sheet for 2017.
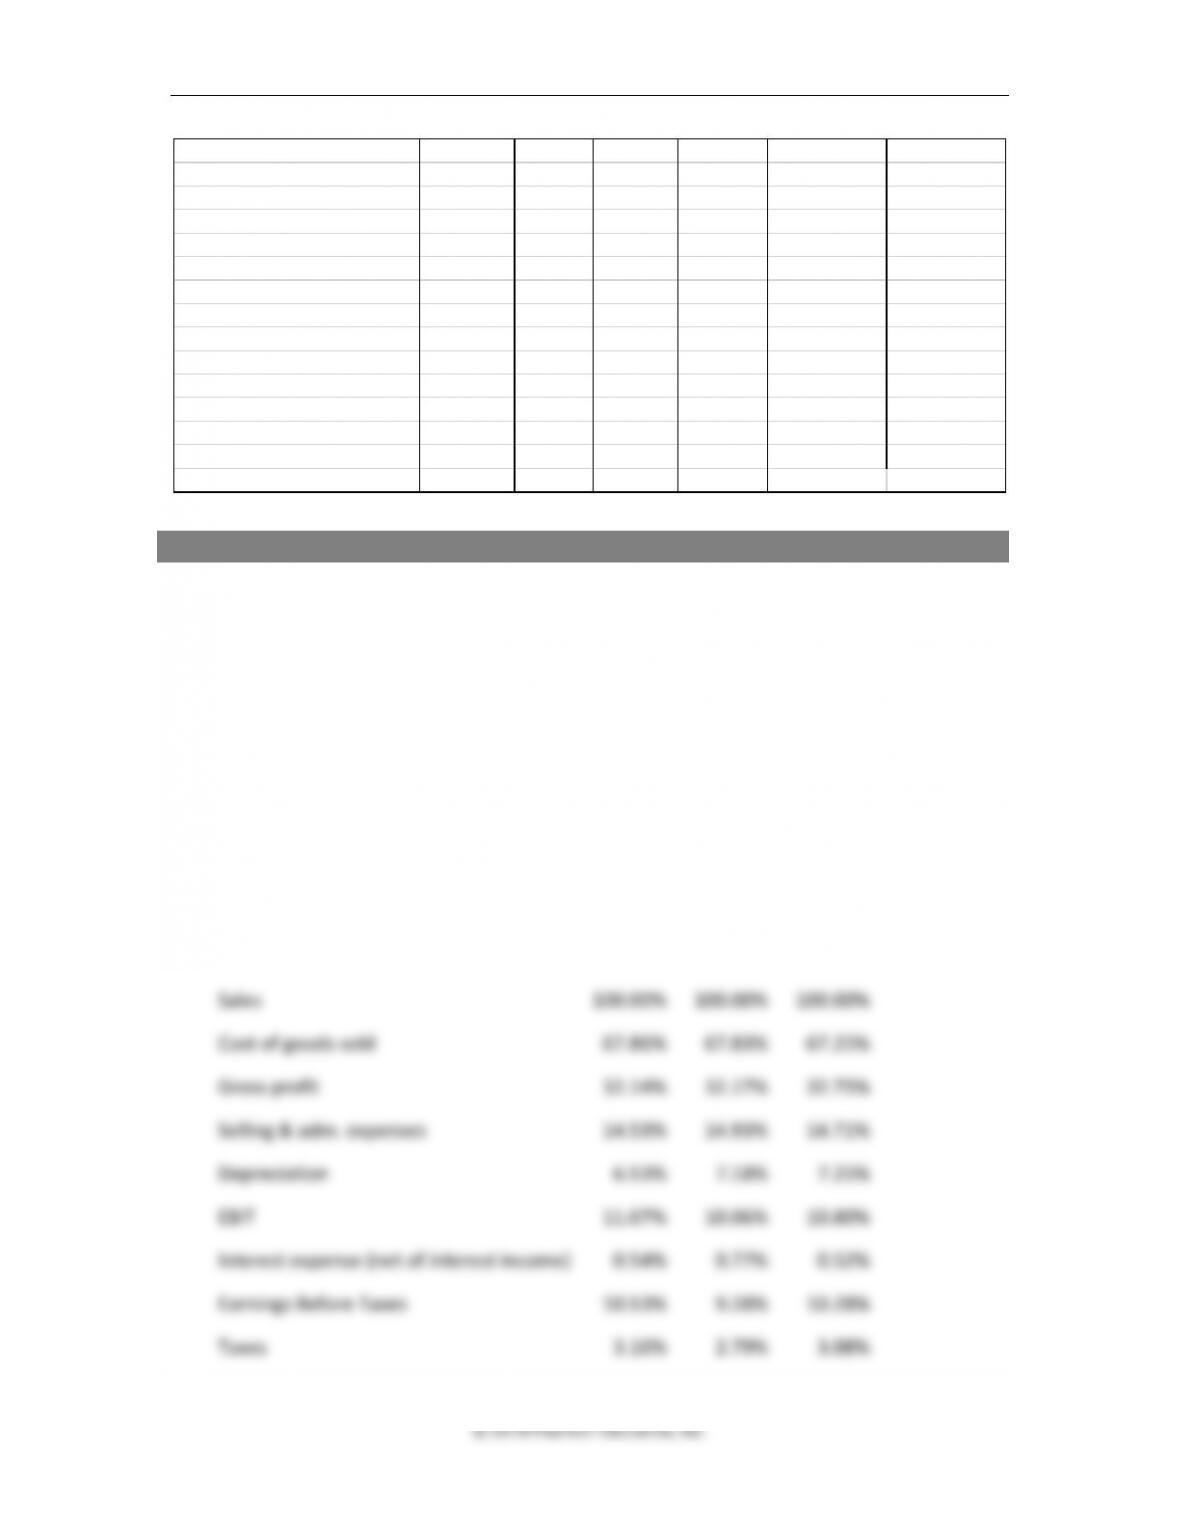
Common size statements
Income statements
2017
2016
2015
Sales
100.00%
100.00%
100.00%
Cost of goods sold
67.86%
67.83%
67.25%
Gross profit
32.14%
32.17%
32.75%
Selling & adm. expenses
14.53%
14.93%
14.71%
Depreciation
6.53%
7.18%
7.25%
EBIT
11.07%
10.06%
10.80%
Interest expense (net of interest income)
0.54%
0.77%
0.52%
Earnings Before Taxes
10.53%
9.28%
10.28%
Taxes
3.16%
2.79%
3.08%
KEY Financial Ratios (Table 14.7) PG 2017 JNJ 2017 PG 2016 JNJ 2016 PG 2015 JNJ 2015
Gross Margin Ratio 49.99% 66.84% 49.60% 69.84% 47.62% 69.27%
Inventory Turnover 7.04 2.89 6.98 2.66 7.44 2.67
Current Ratio 0.88 1.41 1.10 2.47 1.00 2.17
Return on Assets 12.73% 0.83% 8.27% 11.71% 5.43% 11.55%
Return on Equity 27.77% 2.16% 18.33% 23.49% 11.27% 21.66%
Debt to Equity 1.18 1.61 1.22 1.01 1.07 0.88
Earnings Per Share 6.11$ 0.49$ 4.19$ 6.17$ 2.80$ 5.75$
Chapter 14 ◼ Financial Ratios and Firm Performance 495
Net Income
7.37%
6.50%
7.20%
Assets
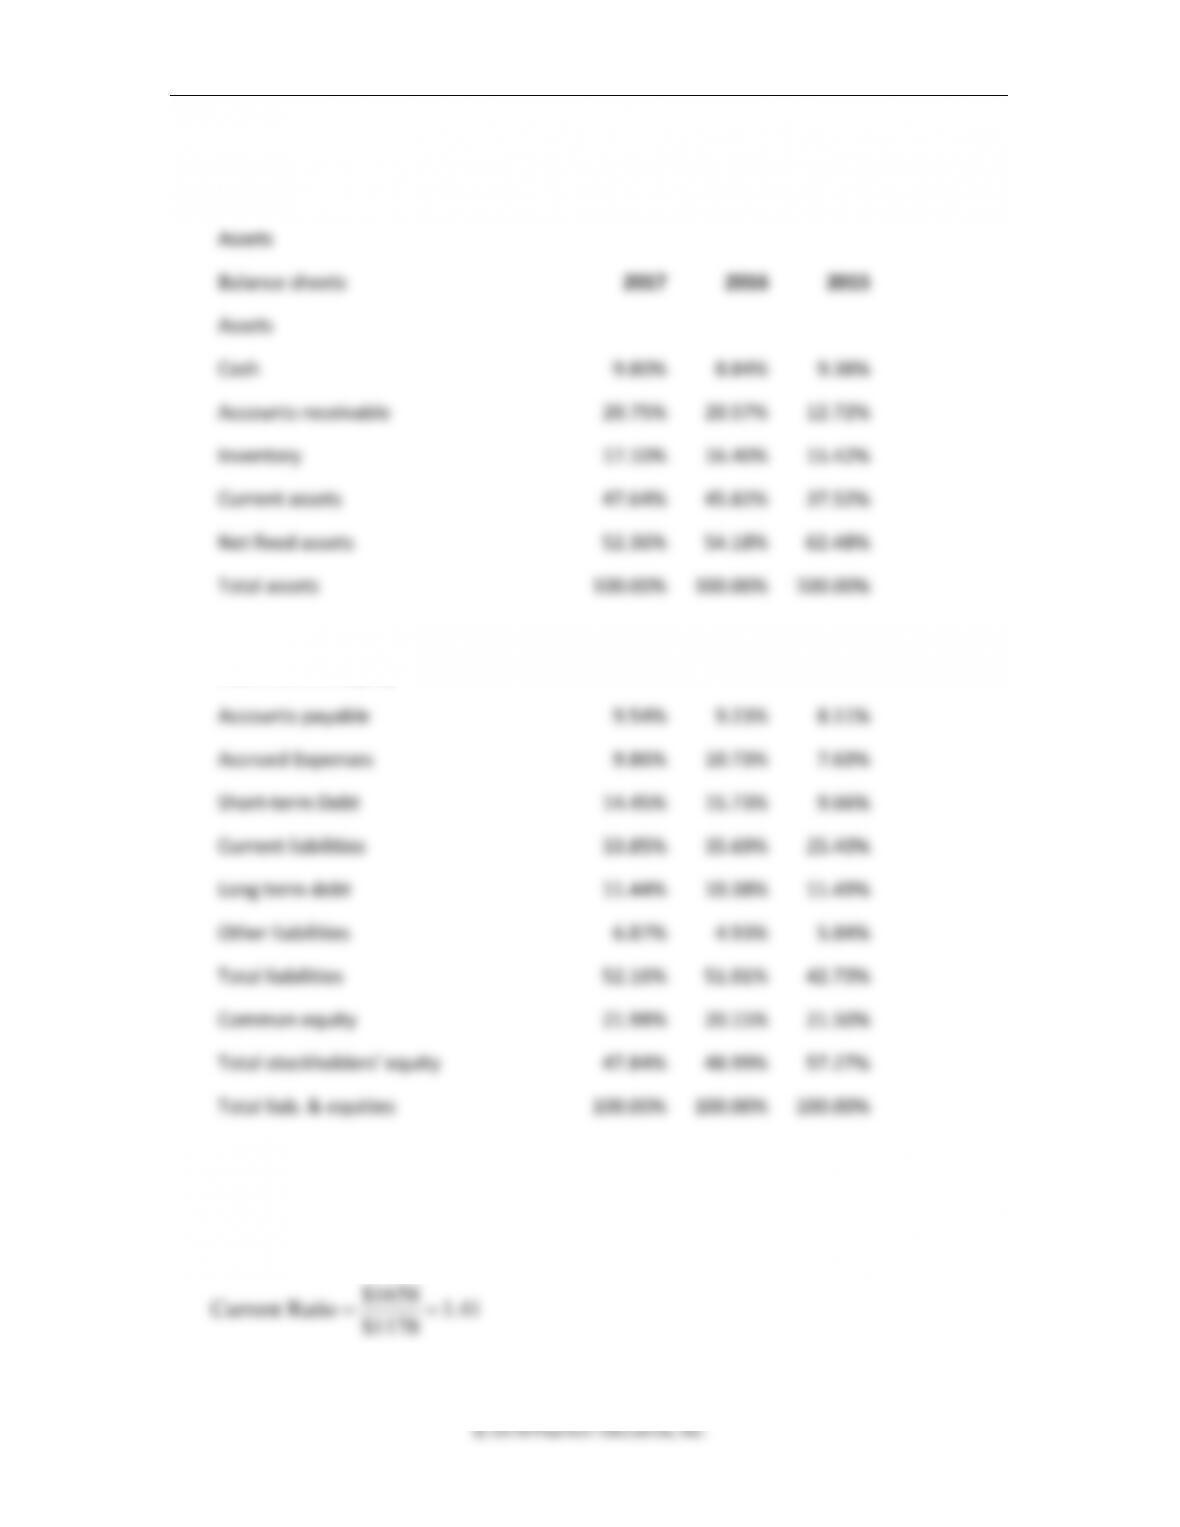
Balance sheets
2017
2016
2015
Assets
Cash
9.80%
8.84%
9.38%
Accounts receivable
20.75%
20.57%
12.72%
Inventory
17.10%
16.40%
15.42%
Current assets
47.64%
45.82%
37.52%
Net fixed assets
52.36%
54.18%
62.48%
Total assets
100.00%
100.00%
100.00%
Liabilities and Equity
Accounts payable
9.54%
9.23%
8.11%
Accrued Expenses
9.86%
10.73%
7.63%
Short-term Debt
14.45%
15.73%
9.66%
Current liabilities
33.85%
35.69%
25.40%
Long term debt
11.44%
10.38%
11.49%
Other liabilities
6.87%
4.93%
5.84%
Total liabilities
52.16%
51.01%
42.73%
Common equity
21.98%
20.15%
21.50%
Total stockholders’ equity
47.84%
48.99%
57.27%
Total liab. & equities
100.00%
100.00%
100.00%
2. Complete the 2017 table of financial ratios for Cranston.
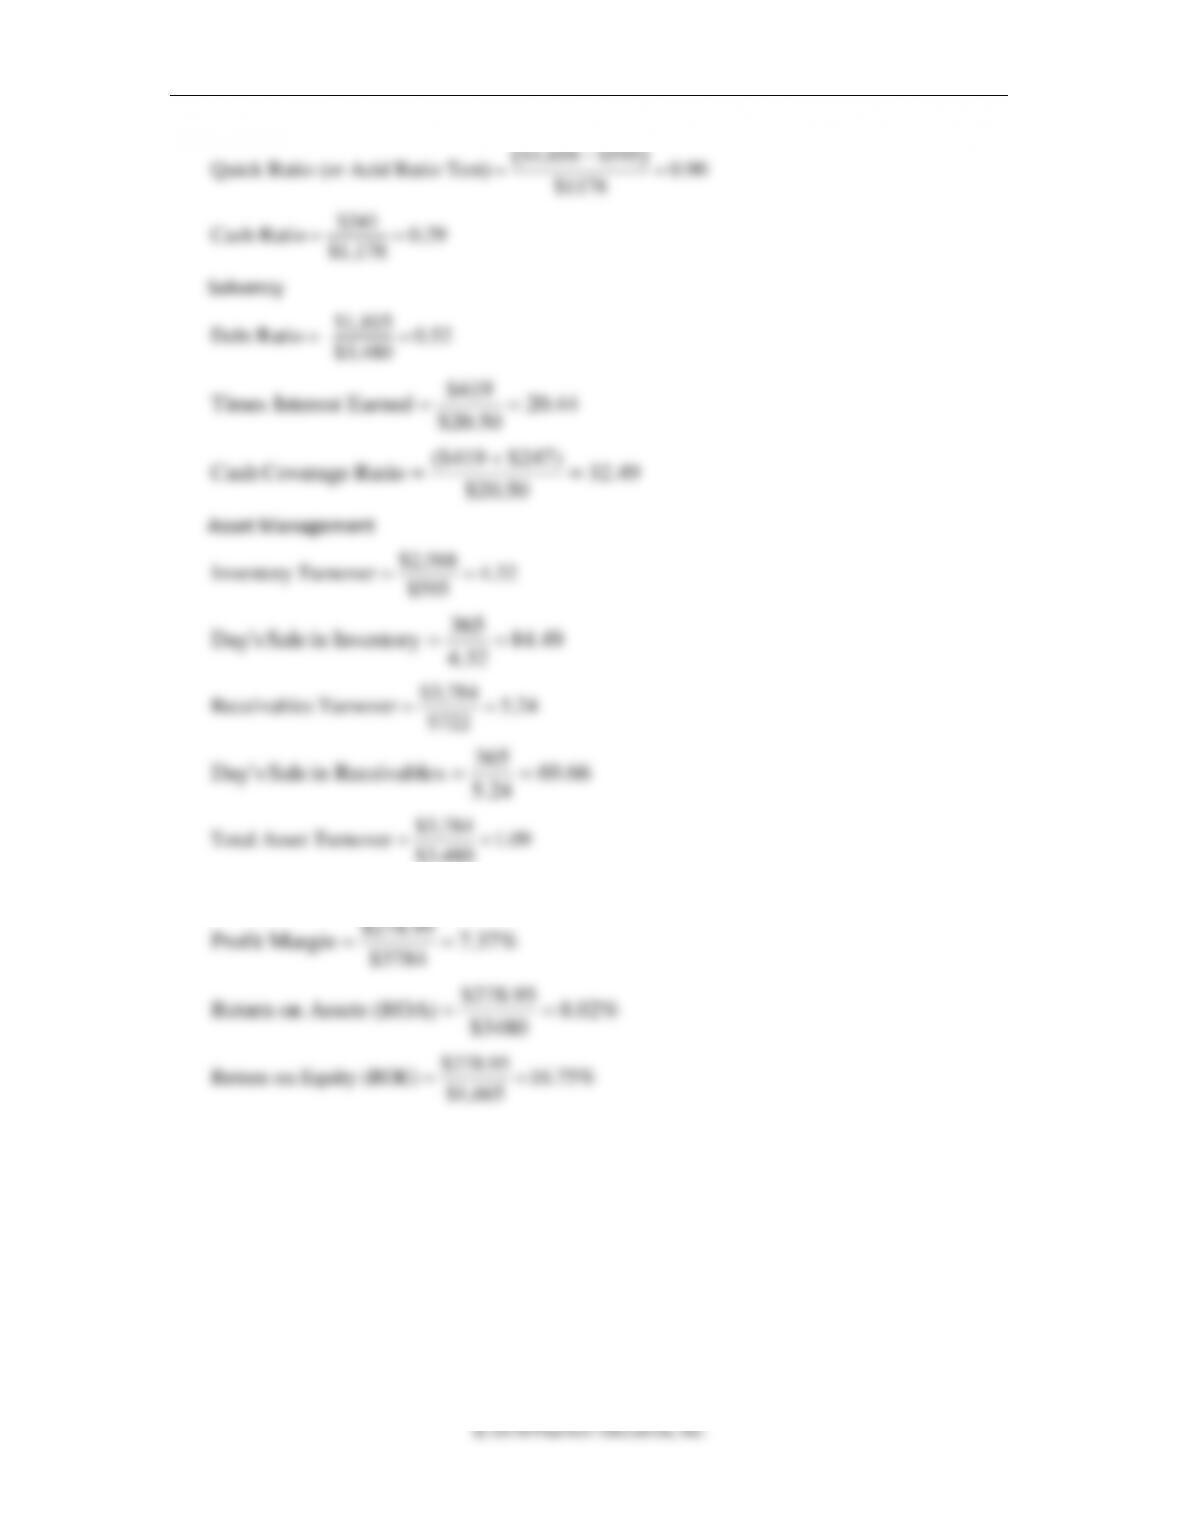
The 2017 financial ratios are computed as follows.
Liquidity
41.1
$1178
$1658
RatioCurrent ==
496 Brooks ◼ Financial Management: Core Concepts, 4e
© 2018 Pearson Education, Inc.
( )
$1,658 $595
Quick Ratio (or Acid Ratio Test) 0.90
$1178
−
==
$341
Cash Ratio 0.29
$1,178
==
Solvency
$1,815
Debt Ratio 0.52
$3,480
==
44.20
$20.50
$419
EarnedInterest Times ==
49.32
$20.50
)247$419($
Ratio CoverageCash =
+
=
Asset Management
$2,568
Inventory Turnover 4.32
$595
==
49.84
4.32
365
Inventoryin Sale sDay’ ==
$3,784
Receivables Turnover 5.24
$722
==
66.69
5.24
365
sReceivablein Sale sDay‘ ==
$3,784
Total Asset Turnover 1.09
$3,480
==
Profitability
%37.7
$3784
$278.95
MarginProfit ==
%02.8
$3480
$278.95
(ROA) Assetson Return ==
$278.95
Return on Equity (ROE) 16.75%
$1,665
==
Chapter 14 ◼ Financial Ratios and Firm Performance 497
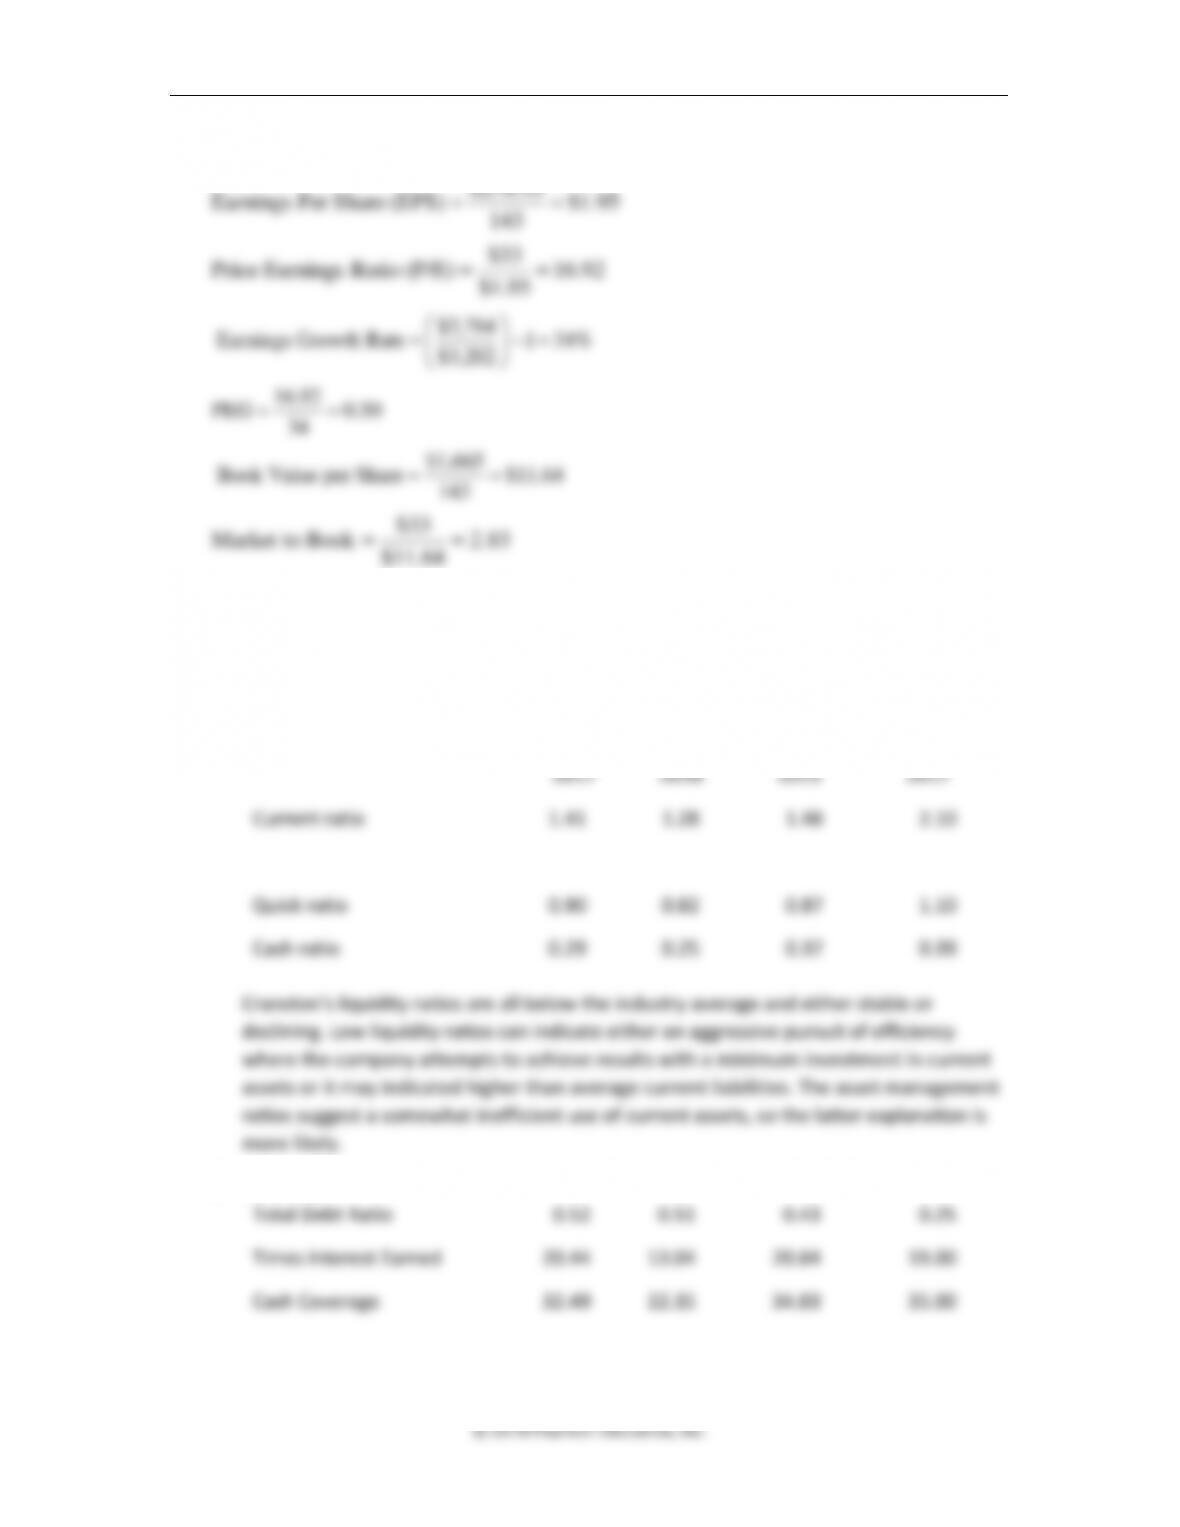
Market
95.1$
143
$278.95
(EPS) SharePer Earnings ==
92.16
$1.95
$33
(P/E) Ratio Earnings Price ==
$3,784
Earnings Growth Rate 1 34%
$3,202
= − =
16.92
PEG 0.50
34
==
$1,665
Book Value per Share $11.64
143
==
83.2
$11.64
$33
Book Market to ==
3. Use the common-size statements and the ratio analysis that you have prepared to
comment on Cranston’s:
a. Liquidity
Cranston
Industry
Liquidity
2017
2016
2015
2017
Current ratio
1.41
1.28
1.48
2.10
Quick ratio
0.90
0.82
0.87
1.10
Cash ratio
0.29
0.25
0.37
0.39
b. Solvency
Total Debt Ratio
0.52
0.51
0.43
0.25
Times Interest Earned
20.44
13.04
20.84
19.00
Cash Coverage
32.49
22.35
34.83
35.00
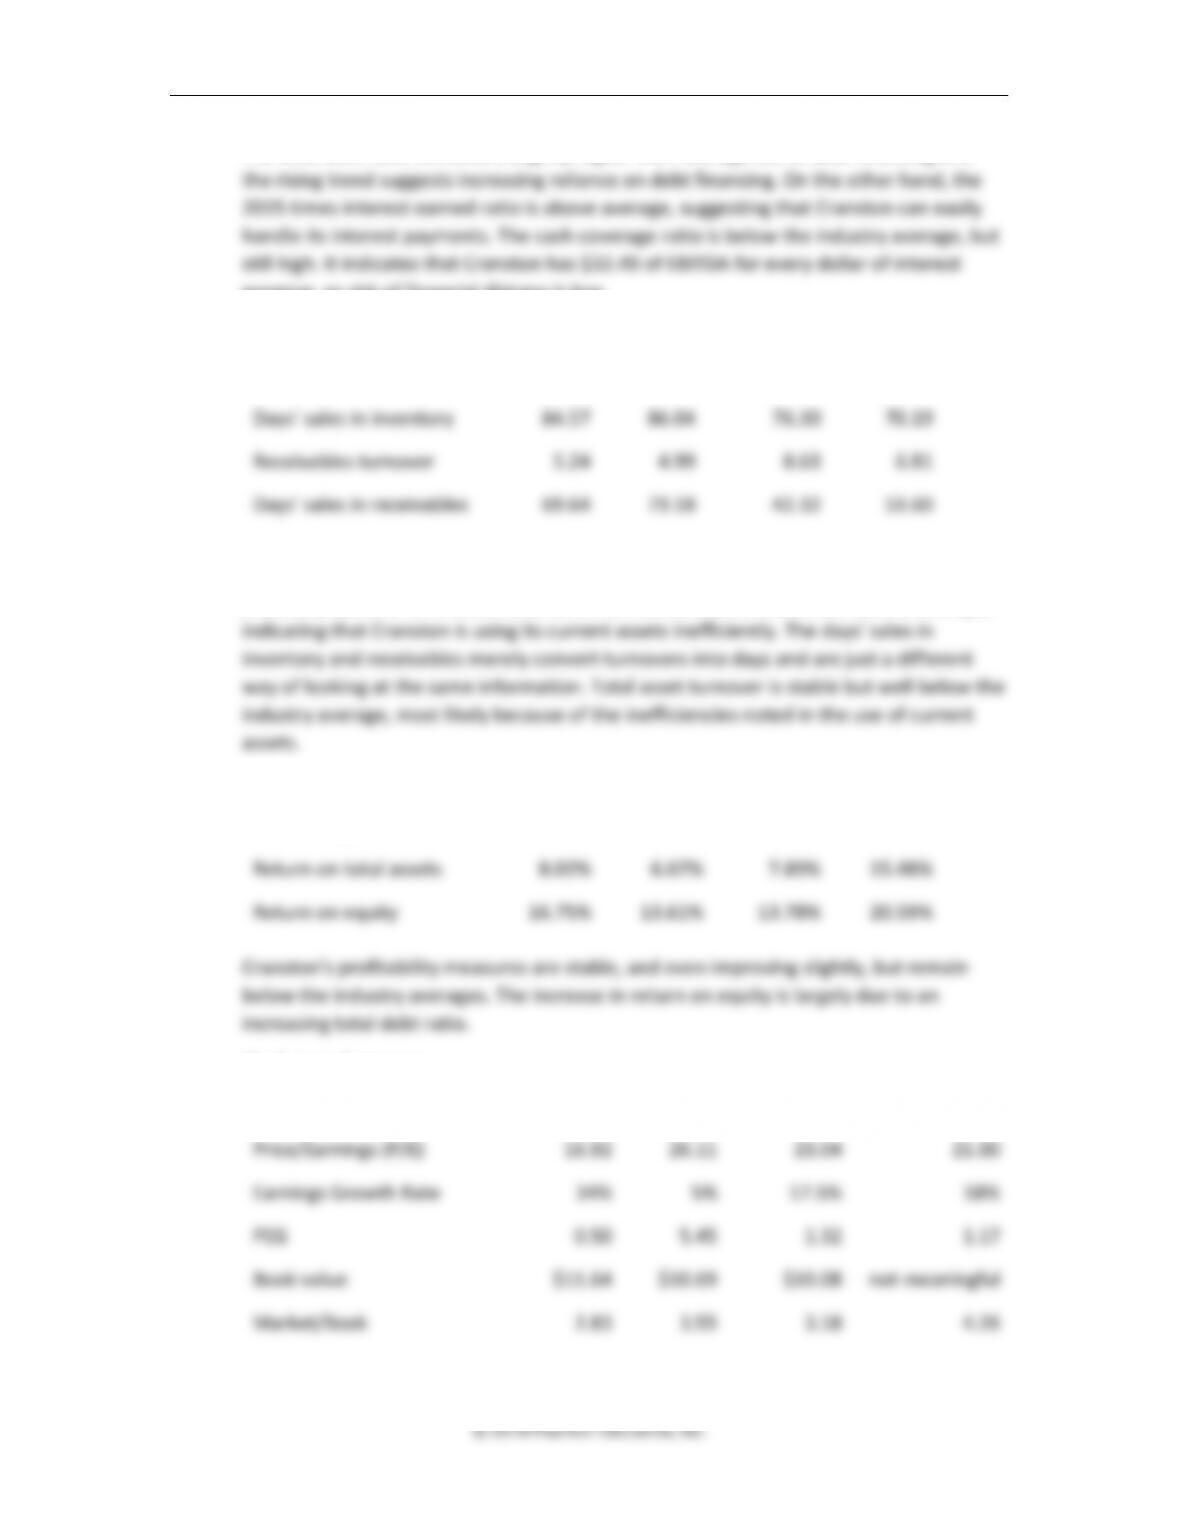
498 Brooks ◼ Financial Management: Core Concepts, 4e
The total debt ratio indicates a slightly higher than average use of debt financing and
expense, so risk of financial distress is low.
c. Asset management
Inventory Turnover
4.32
4.24
4.78
5.20
Days’ sales in inventory
84.57
86.04
76.30
70.19
Receivables turnover
5.24
4.99
8.63
6.81
Days’ sales in receivables
69.64
73.18
42.32
53.60
Total asset turnover
1.09
1.03
1.10
1.80
Inventory turnover and receivables turnover are both lower than the industry average,
d. Profitability
Profit Margin
7.37%
6.50%
7.20%
8.60%
Return on total assets
8.02%
6.67%
7.89%
15.48%
Return on equity
16.75%
13.61%
13.78%
20.59%
e. Market performance
Earnings Per Share (EPS)
$1.95
$1.46
$1.39
not meaningful
Price/Earnings (P/E)
16.92
26.11
23.04
21.00
Earnings Growth Rate
34%
5%
17.5%
18%
PEG
0.50
5.45
1.32
1.17
Book value
$11.64
$10.69
$10.08
not meaningful
Market/Book
2.83
3.55
3.18
4.26
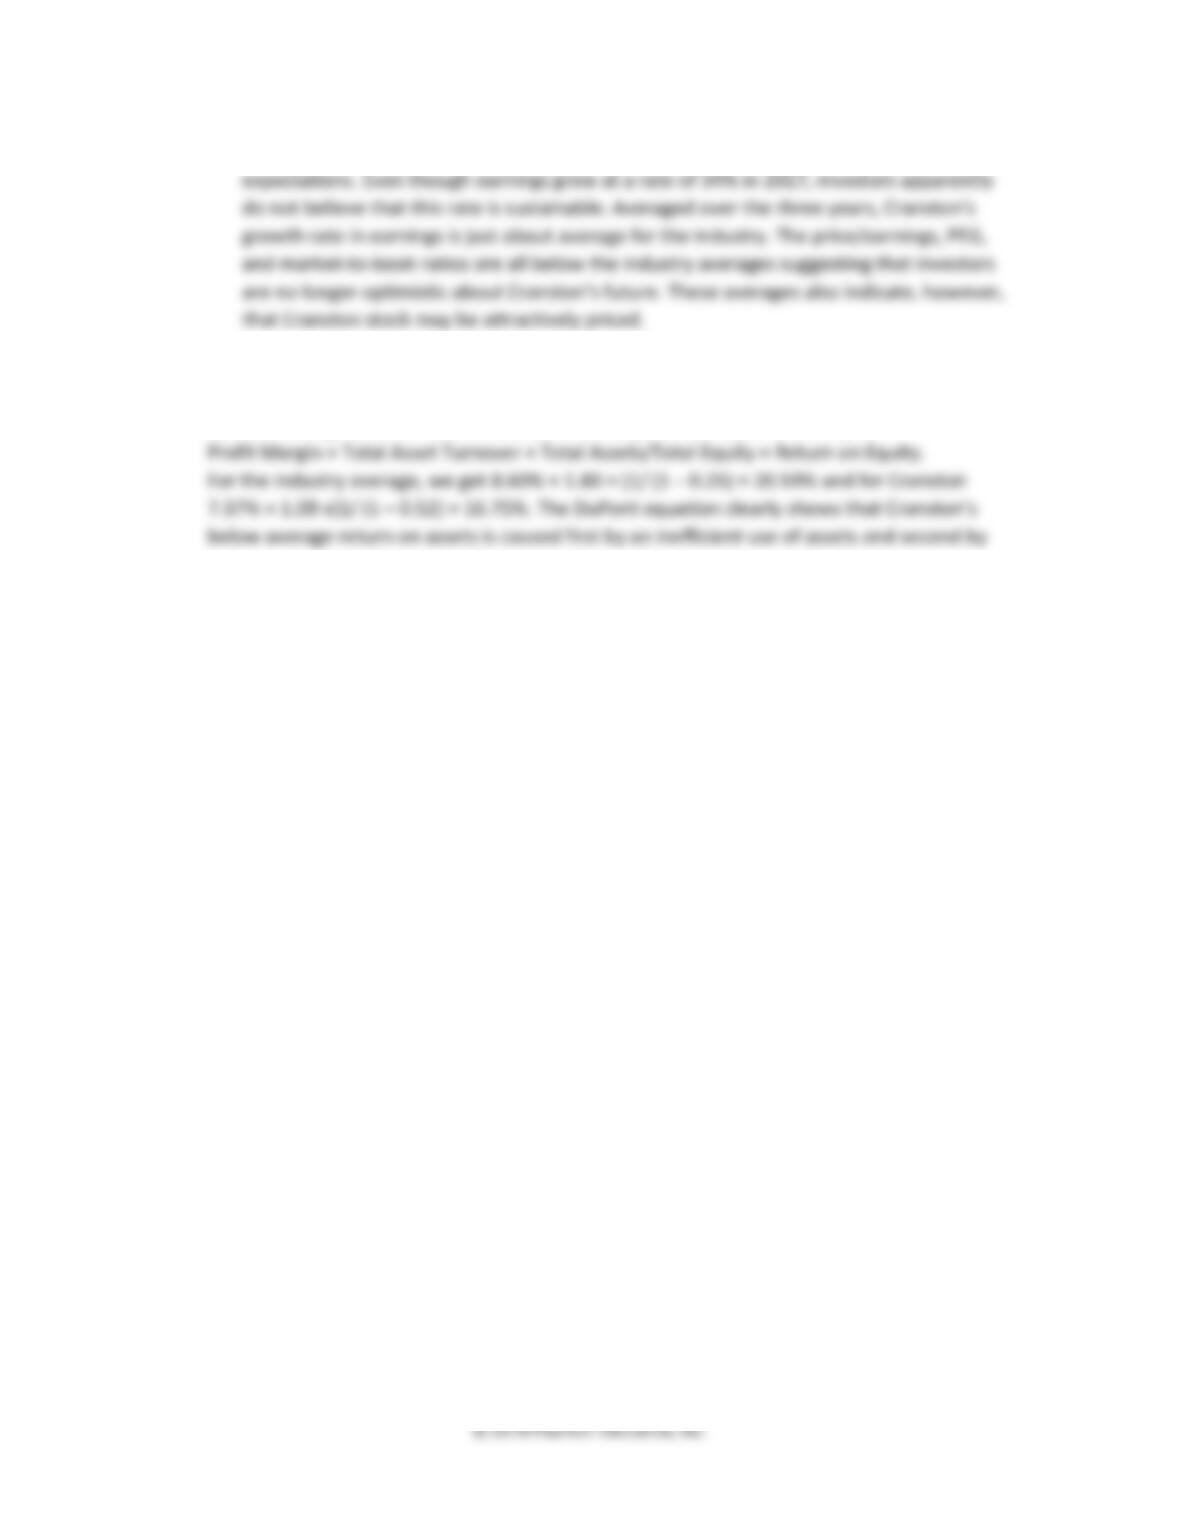
Chapter 14 ◼ Financial Ratios and Firm Performance 499
Cranston’s market performance shows that the market measures results against
4. Express Cranston’s ROE in terms of the DuPont identity. Which ratios are contributing to
Cranston’s below-average ROE?
By substituting ratios for raw numbers, we can express the Dupont identity as
below average profit margins. Cranston makes up for, or perhaps masks, these
shortcomings by using more debt than the average company in its industry.
Chapter 14 ◼ Financial Ratios and Firm Performance 501
EBIT
$ 81,650
Interest Expense
$ 3,540
Taxable Income
$ 78,110
Taxes
$ 27,339
Net Income
$ 50,772
Shares Outstanding (‘000s)
16,740
EPS
$ 3.03
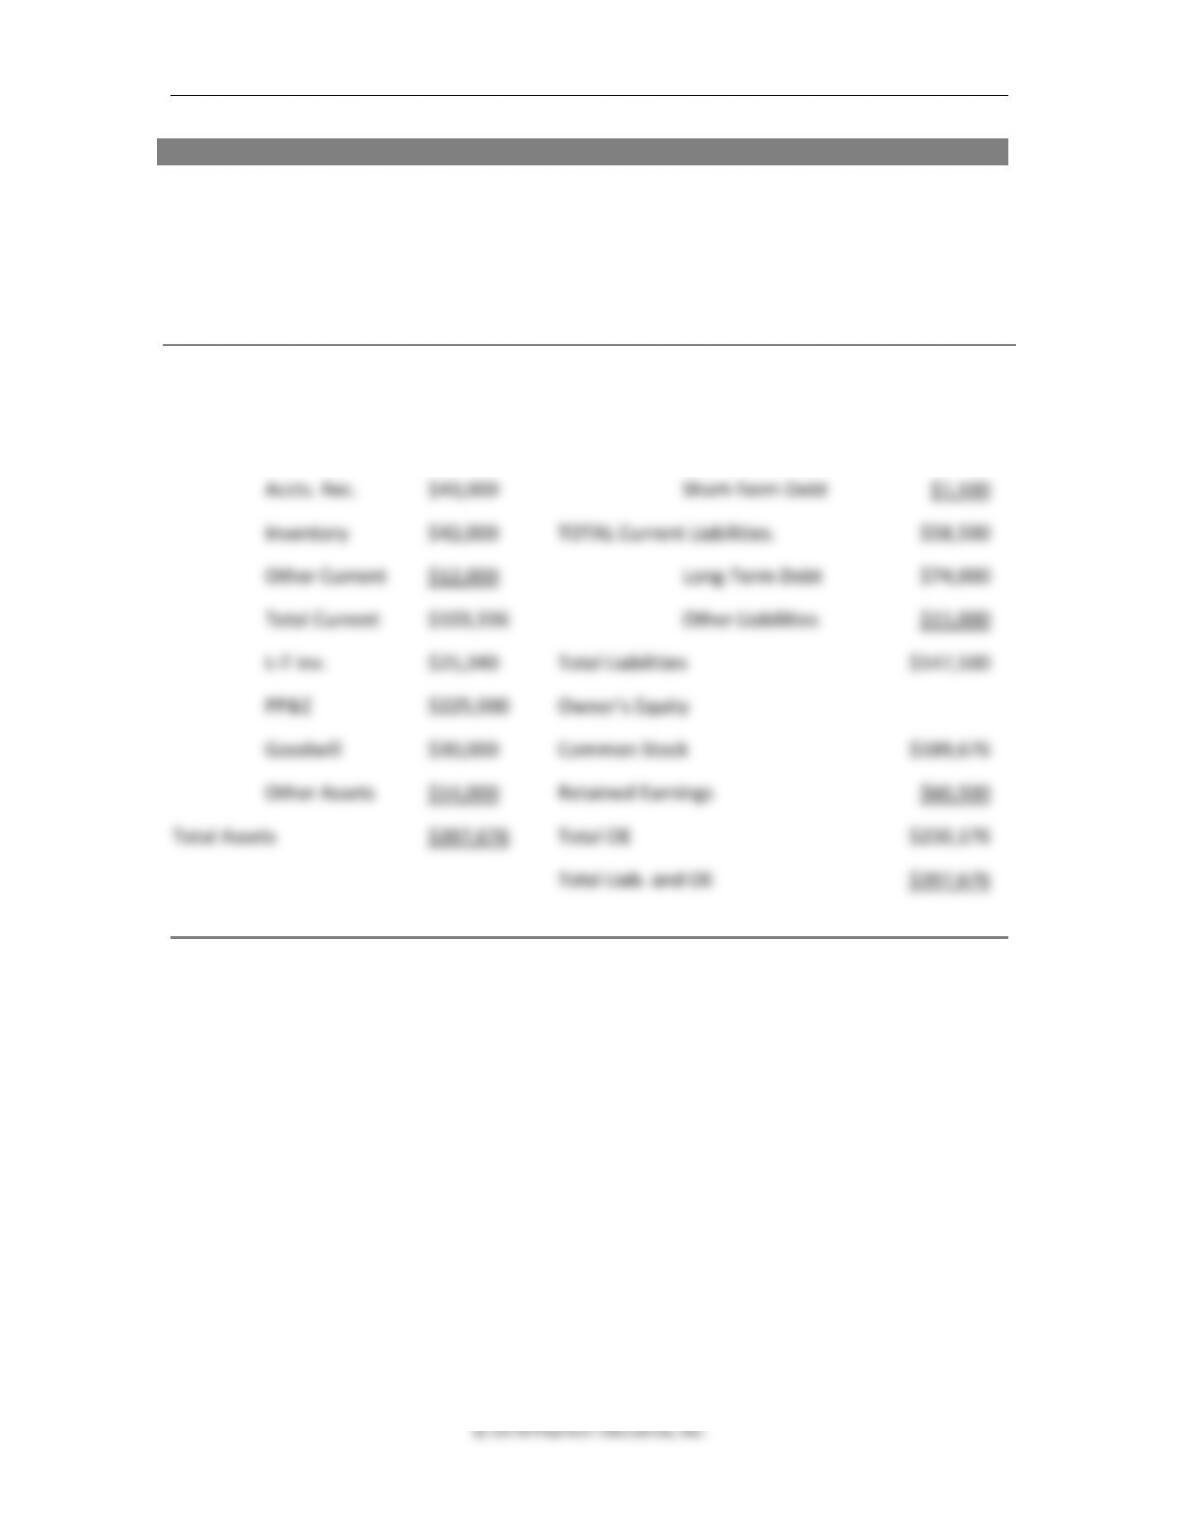
2. Constructing a Balance Sheet. Construct Tri-Mark, Inc.’s 2017 year-end balance sheet using
the asset, liability, and equity accounts listed below:
Retained Earnings $60,500,000
Accounts Payable $57,000,000
Accounts Receivable $43,000,000
Common Stock $189,676,000
Cash $6,336,000
Short Term Debt $1,500,000
Inventory $42,000,000
Goodwill $30,000,000
Long Term Debt $74,000,000
Other Non-Current Liabilities $15,000,000
PP&E $225,000,000
Other Non-Current Assets $14,000,000
Long-Term Investments $25,340,000
Other Current Assets $12,000,000
502 Brooks ◼ Financial Management: Core Concepts, 4e
ANSWER (Slides 14-35 to 14-36)
Tri-mark Products Inc.
Balance Sheet as at year ended
31st December 2017 (‘000s)
Assets:
Liabilities:
Current Assets
Current Liabilities
Cash
$6,336
Accounts Payable
$57,000
Accts. Rec.
$43,000
Short-Term Debt
$1,500
Inventory
$42,000
TOTAL Current Liabilities.
$58,500
Other Current
$12,000
Long-Term Debt
$74,000
Total Current
$103,336
Other Liabilities
$15,000
L-T Inv.
$25,340
Total Liabilities
$147,500
PP&E
$225,000
Owner’s Equity
Goodwill
$30,000
Common Stock
$189,676
Other Assets
$14,000
Retained Earnings
$60,500
Total Assets
$397,676
Total OE
$250,176
Total Liab. and OE
$397,676
504 Brooks ◼ Financial Management: Core Concepts, 4e
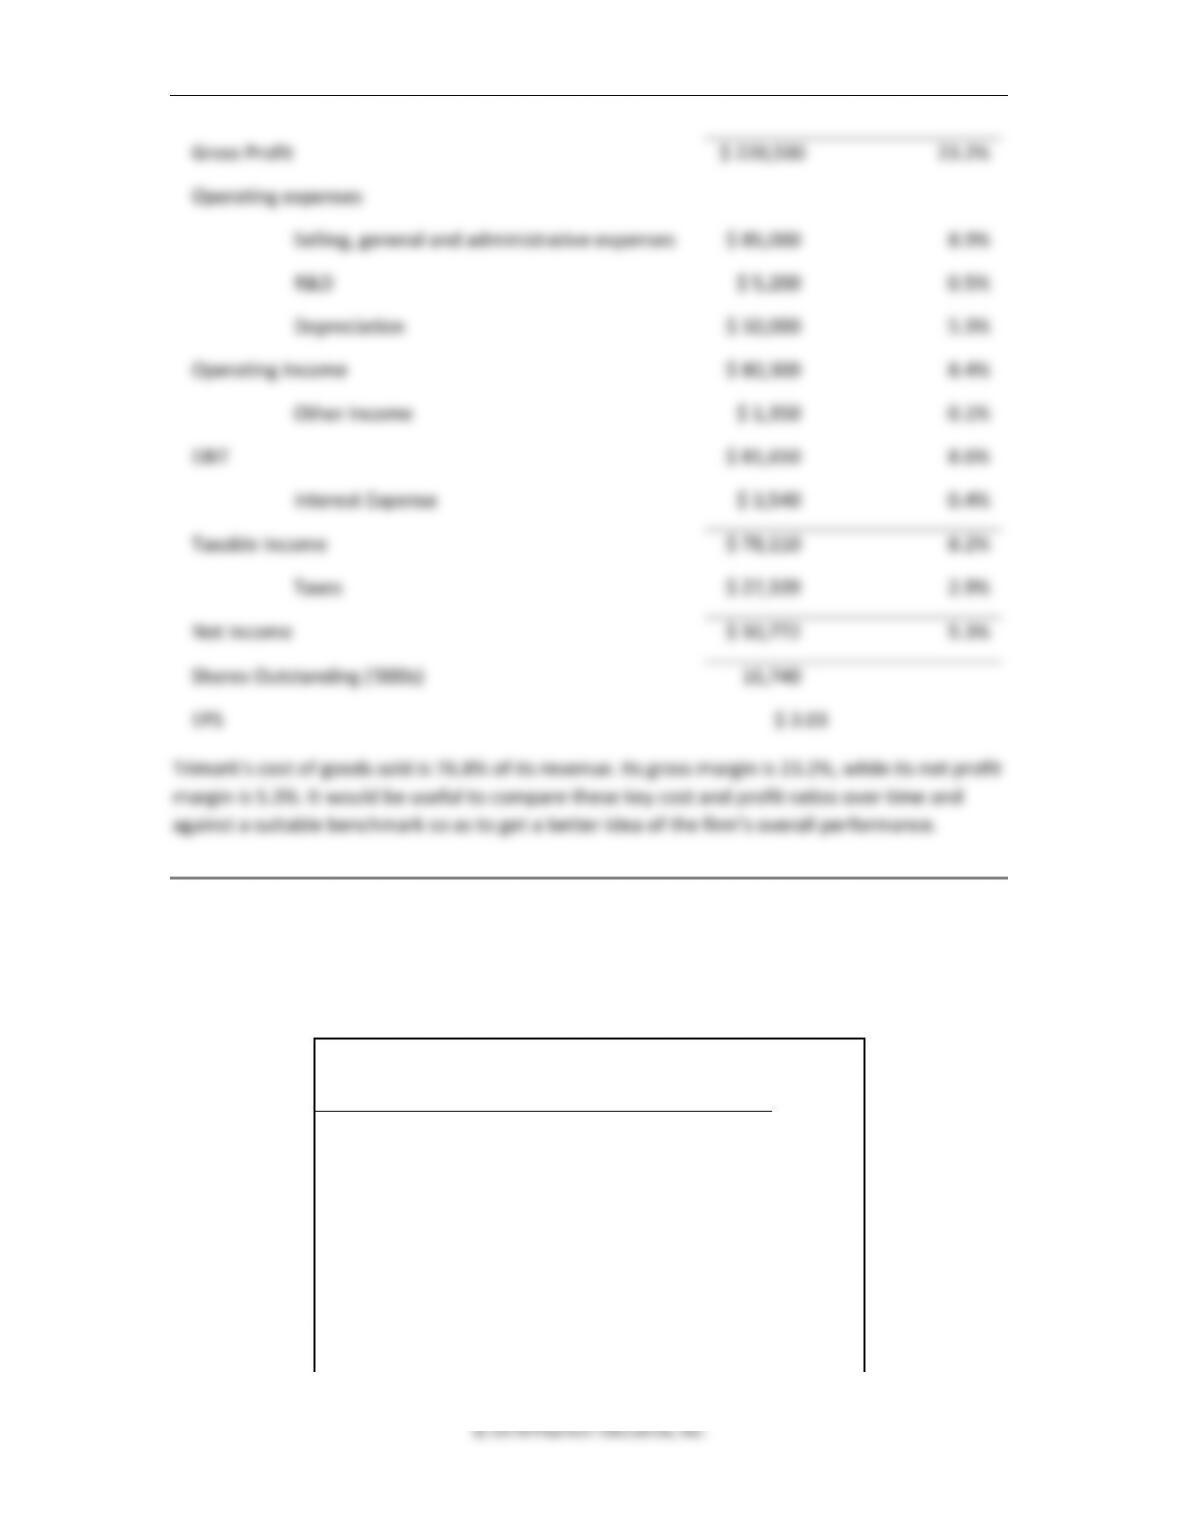
Gross Profit
$ 220,500
23.2%
Operating expenses
Selling, general and administrative expenses
$ 85,000
8.9%
R&D
$ 5,200
0.5%
Depreciation
$ 50,000
5.3%
Operating Income
$ 80,300
8.4%
Other Income
$ 1,350
0.1%
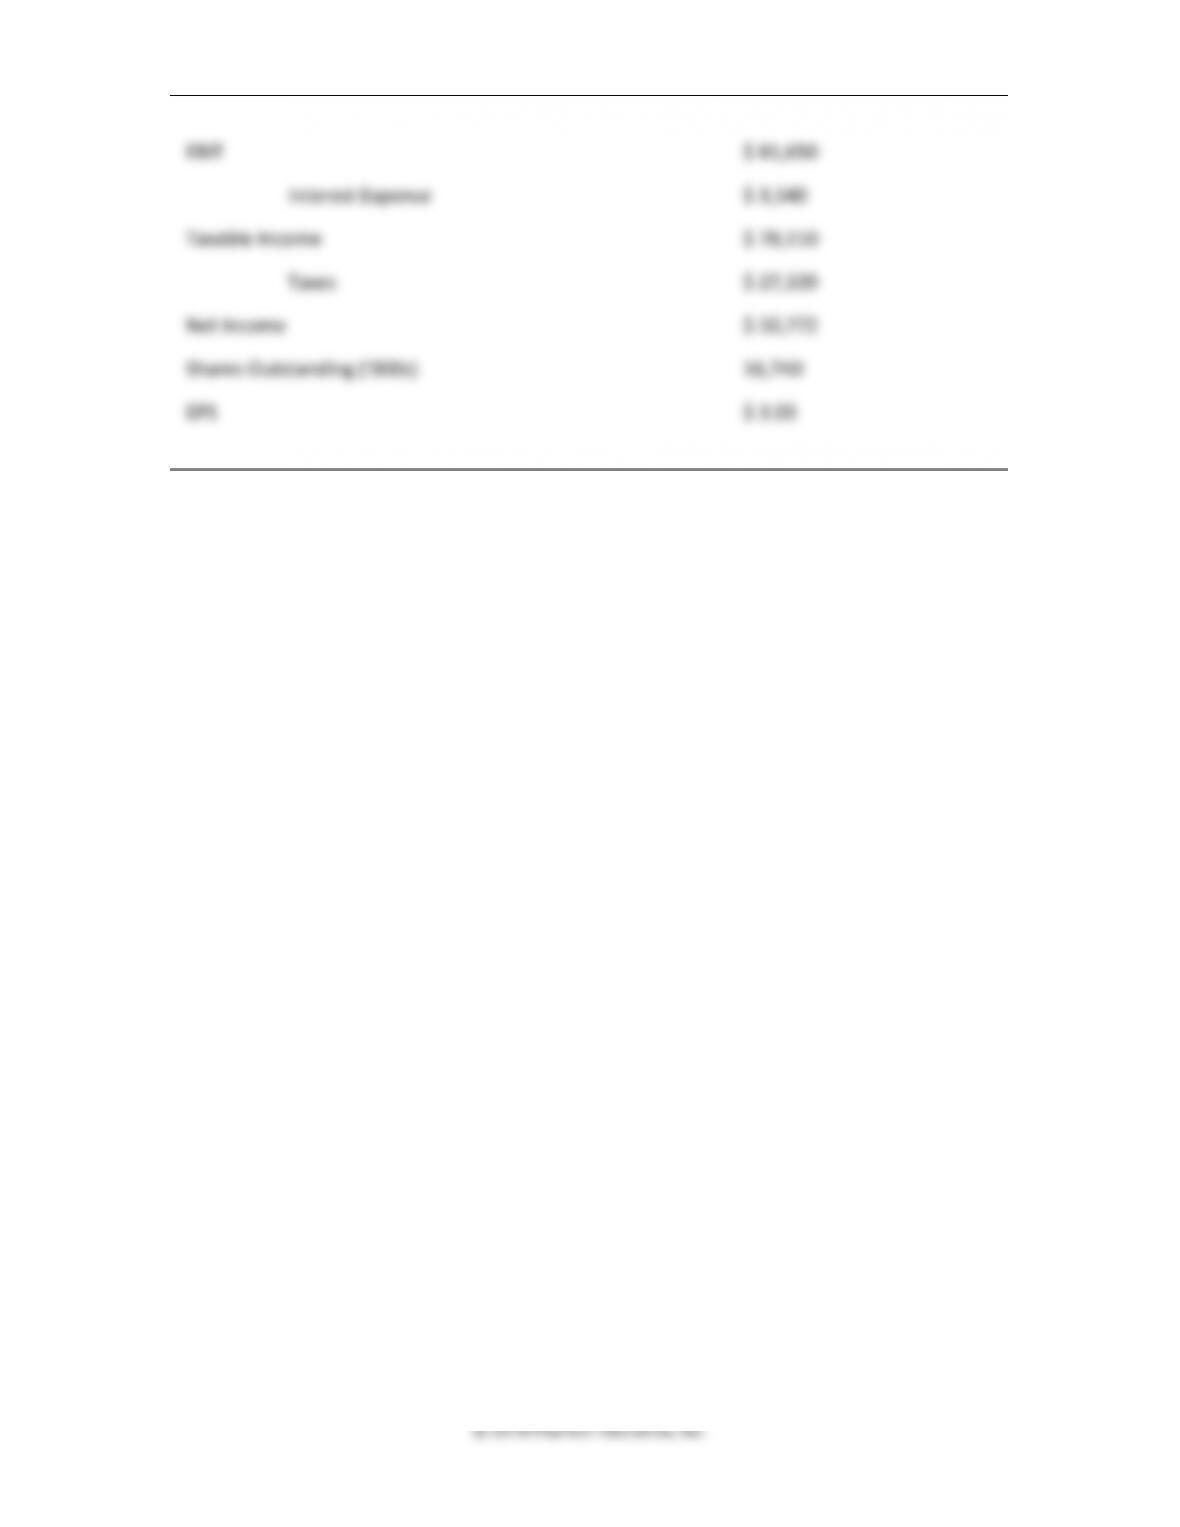
EBIT
$ 81,650
8.6%
Interest Expense
$ 3,540
0.4%
Taxable Income
$ 78,110
8.2%
Taxes
$ 27,339
2.9%
Net Income
$ 50,772
5.3%
Shares Outstanding (‘000s)
16,740
EPS
$ 3.03
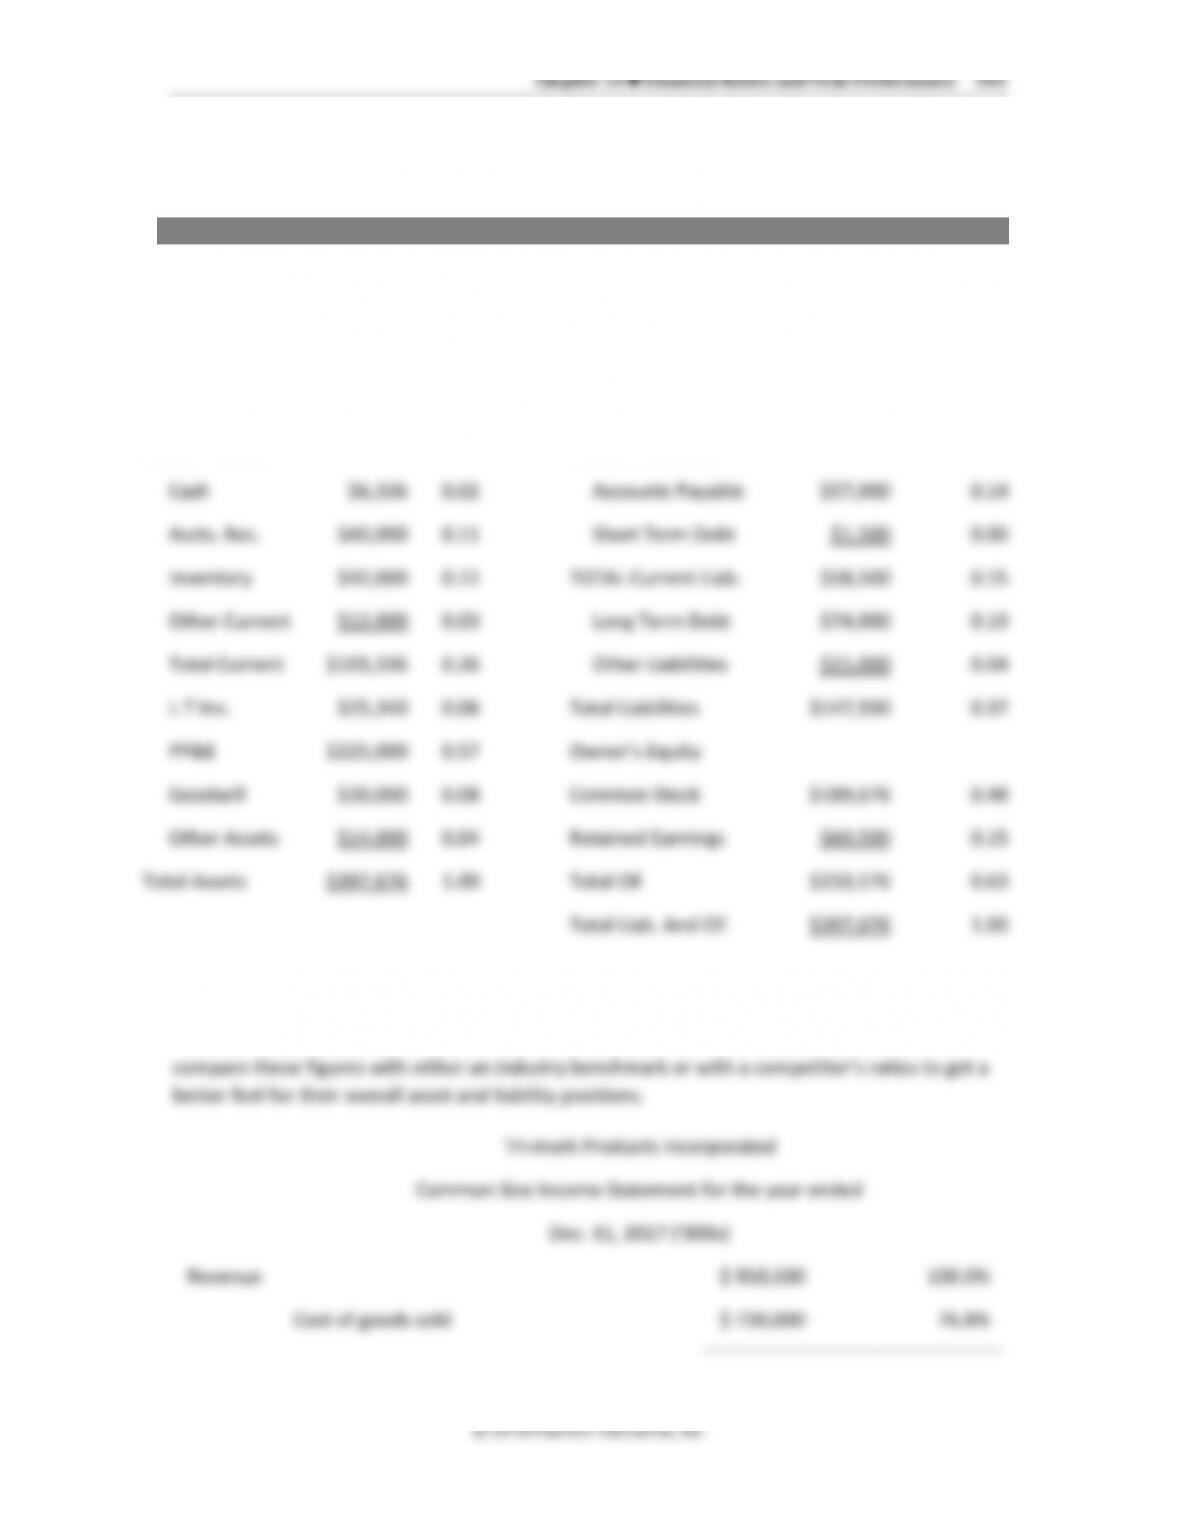
4. Compute and analyze financial ratios. Using the 2017 income statement and balance sheet
of Trimark Products, Inc., as constructed in Problems 1 and 2 above, compute its financial
ratios. How is the firm doing relative to its industry in the areas of liquidity, asset
management, leverage, and profitability?
Ratio
Industry
Average
Current Ratio
2.200
Quick Ratio (or Acid Test Ratio)
1.500
Cash Ratio
0.135
Debt Ratio
0.430
Cash Coverage
10.600
Day’s Sales in Receivables
29.000
Chapter 14 ◼ Financial Ratios and Firm Performance 505
Total Asset Turnover
2.800
Inventory Turnover
20.100
Day’s Sales in Inventory
11.500
Receivables Turnover
32.000
Profit Margin
0.045
Return on Assets
0.126
Return on Equity
0.221
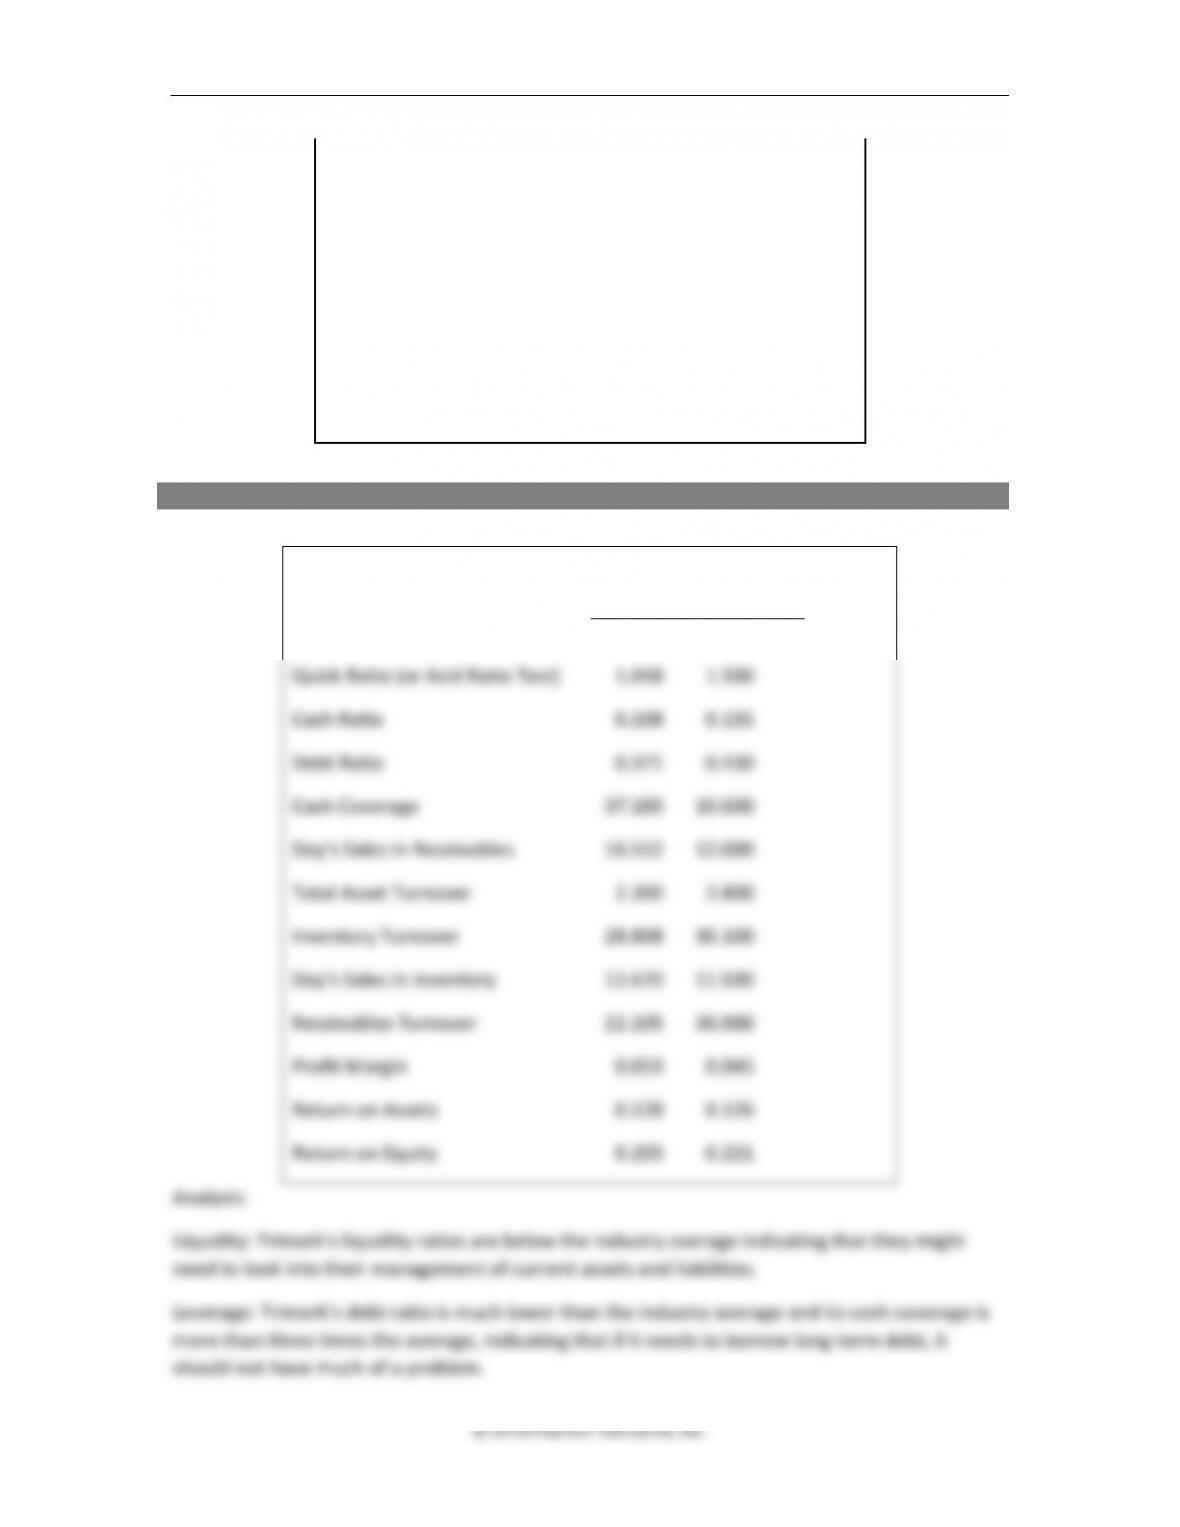
ANSWER (Slides 14-39 to 14-42)
Trimark
Industry
Average
Current Ratio
1.766
2.200
Quick Ratio (or Acid Ratio Test)
1.048
1.500
Cash Ratio
0.108
0.135
Debt Ratio
0.371
0.430
Cash Coverage
37.189
10.600
Day’s Sales in Receivables
16.512
12.000
Total Asset Turnover
2.390
2.800
Inventory Turnover
28.808
30.100
Day’s Sales in Inventory
12.670
11.500
Receivables Turnover
22.105
30.000
Profit Margin
0.053
0.045
Return on Assets
0.128
0.126
Return on Equity
0.203
0.221
506 Brooks ◼ Financial Management: Core Concepts, 4e
© 2018 Pearson Education, Inc.
Asset management: Trimark’s asset turnover ratios are all below the average. It needs to tighten
up collections, and manage its inventory more efficiently.
Profitability: Trimark has a good control on cost of goods sold. Its net profit margin is better than
the industry and so is its ROA. The industry, however, is returning a higher rate to the
shareholders on average, primarily due to the higher debt levels.
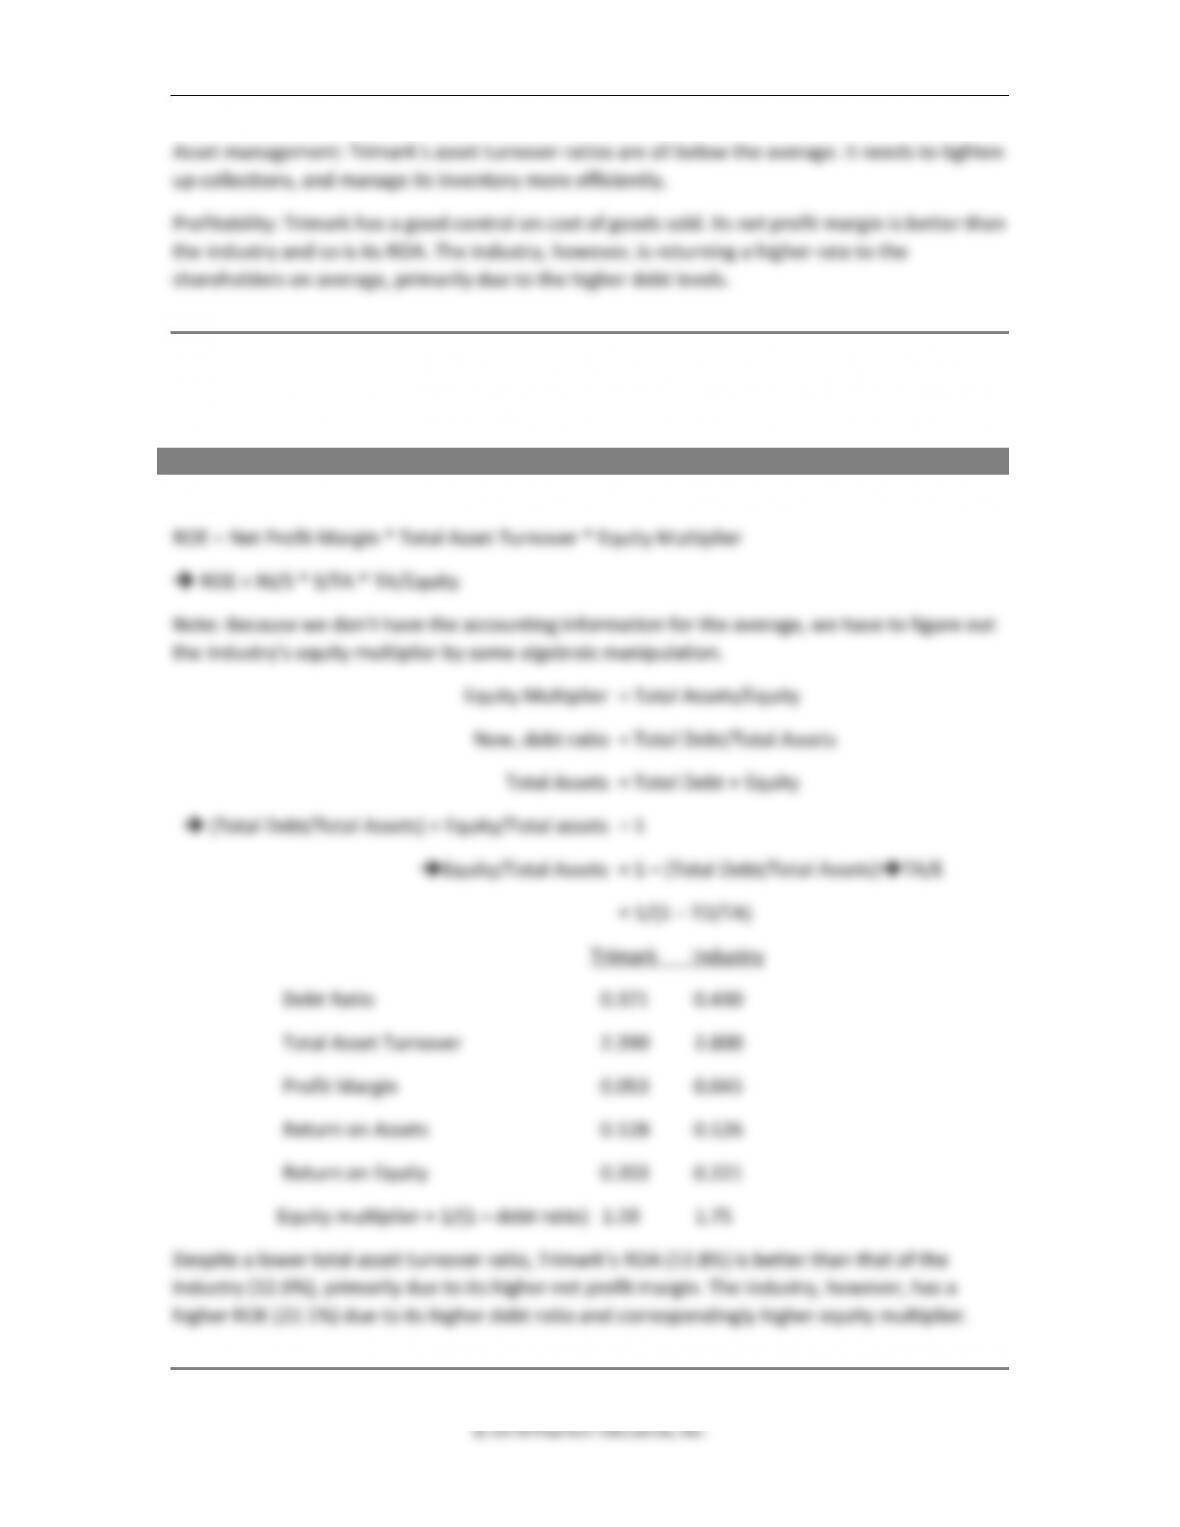
5. DuPont analysis. Based on the ratios calculated in Problem 4 above, and in conjunction with
the industry averages given, conduct a DuPont analysis on Trimark’s key profitability ratios.
ANSWER (Slides 14-43 to 14-45)
According to the DuPont breakdown, we have