468 Brooks ◼ Financial Management: Core Concepts, 4e
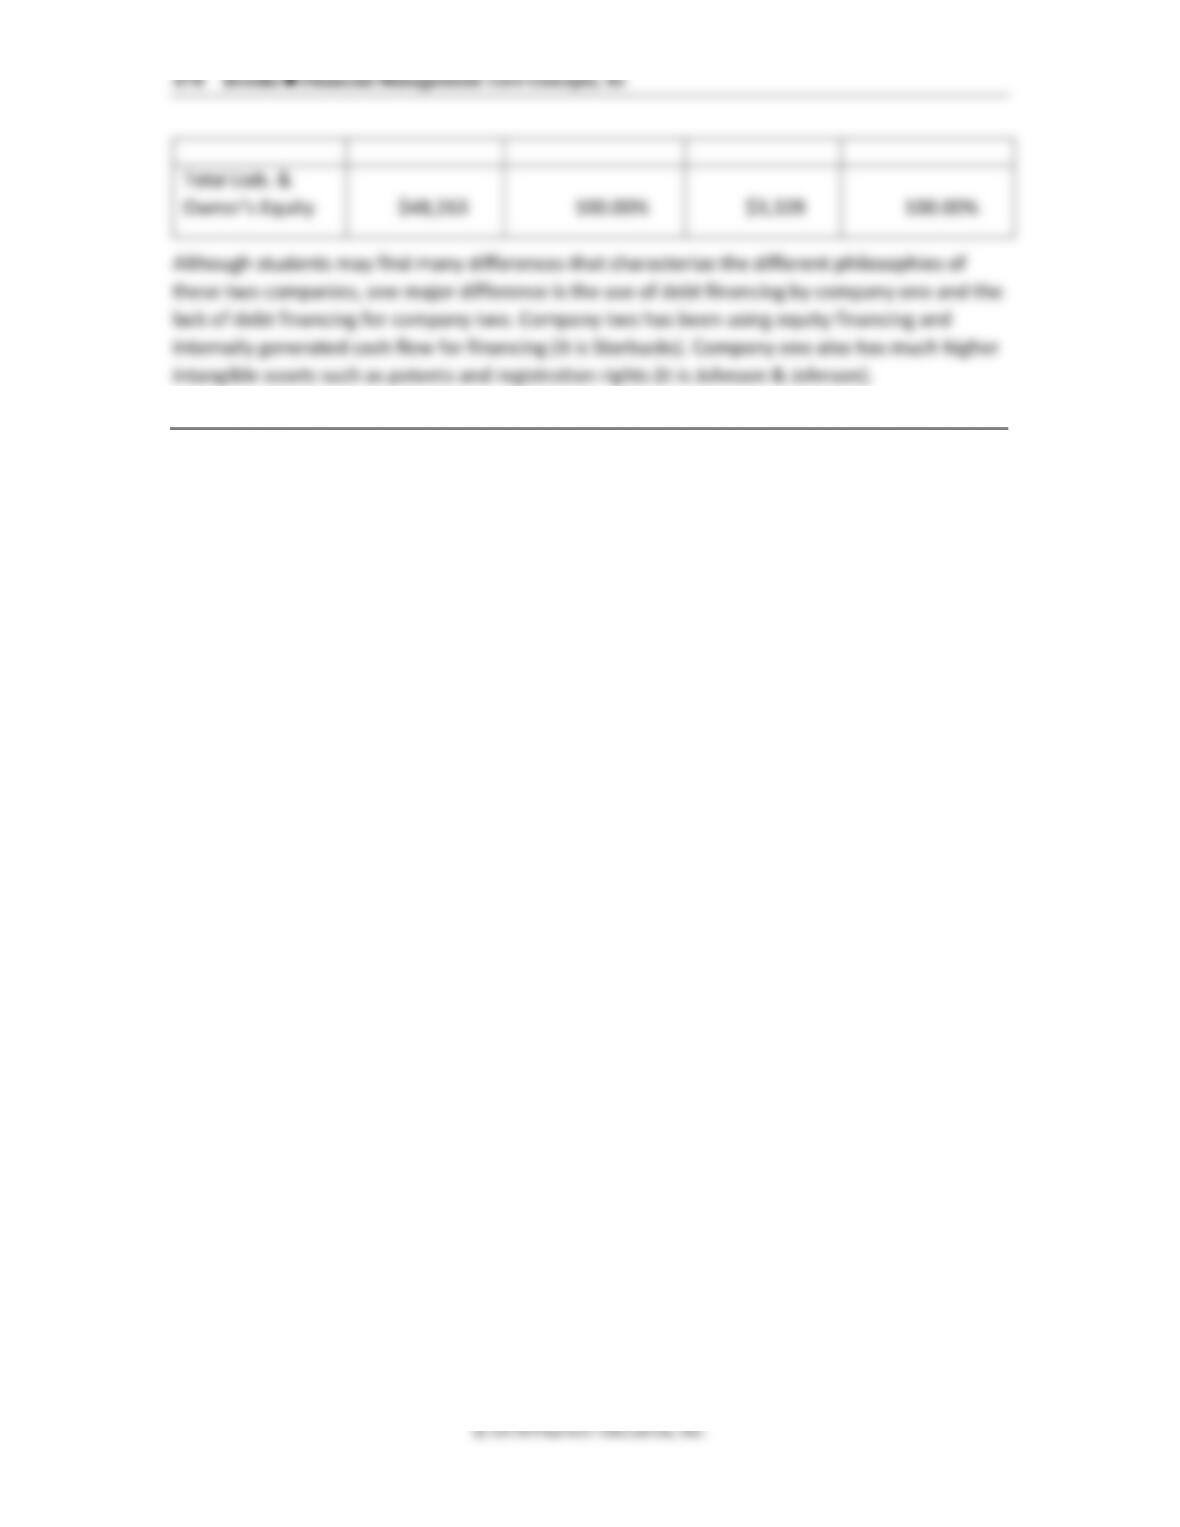
Total OE
$159,272
$121,947
$15,632
TOTAL LIAB & OE
$347,214
$365,469
$387,439
Chapter 14 ◼ Financial Ratios and Firm Performance 469
4. Balance sheet. Construct the Barron Pizza, Inc. balance sheet statement for
December 31, 2018, with the following information:
Retained earnings: $43,743
Accounts payable: $74,633
Accounts receivable: $34,836
Common stock: $119,901
Cash: $8,344
Short-term debt: $210
Inventory: $23,455
Goodwill: $48,347
Long-term debt: $80,207
Other noncurrent liabilities: $42,580
Plant, property, and equipment: $192,465
Other noncurrent assets: $16,838
Long-term investments: $22,331
Other current assets: $14,658
ANSWER
Barron Pizza Incorporated
Balance Sheet at 12/31/2018
Assets: Liabilities:
Current Assets Current Liabilities
470 Brooks ◼ Financial Management: Core Concepts, 4e
© 2018 Pearson Education, Inc.
Other Assets $ 16,838 Retained Earnings $ 43,743
Total Assets $361,274 Total OE $163,644
Total Liab. and OE $361,274
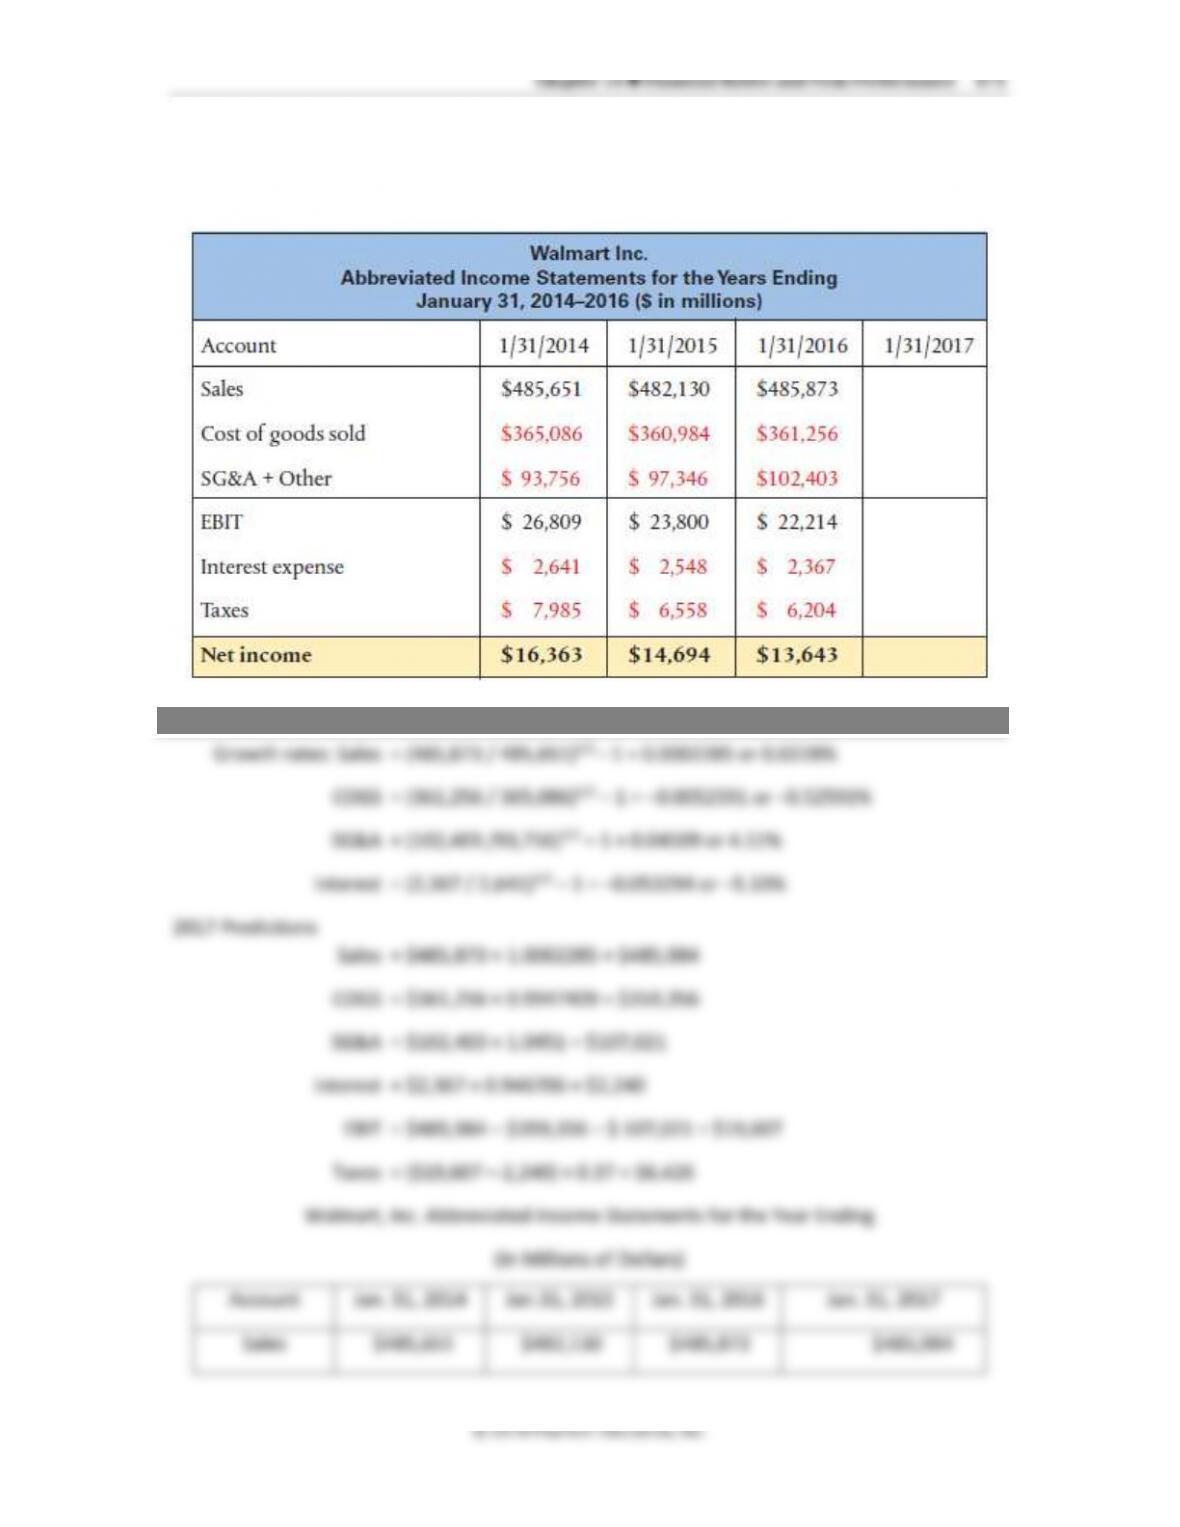
472 Brooks ◼ Financial Management: Core Concepts, 4e
Account
Jan. 31, 2014
Jan.31, 2015
Jan. 31, 2016
Jan. 31, 2017
COGS
$365,086
$360,984
$361,256
$359,356
SG&A
$93,756
$97,346
$102,403
$107,021
EBIT
$26,809
$23,800
$22,214
$19,607
Interest
$2,641
$2,548
$2,367
$2,240
Taxes
$7,985
$6,558
$6,204
$6,426
Net Income
$16,363
$14,694
$13,643
$10,941
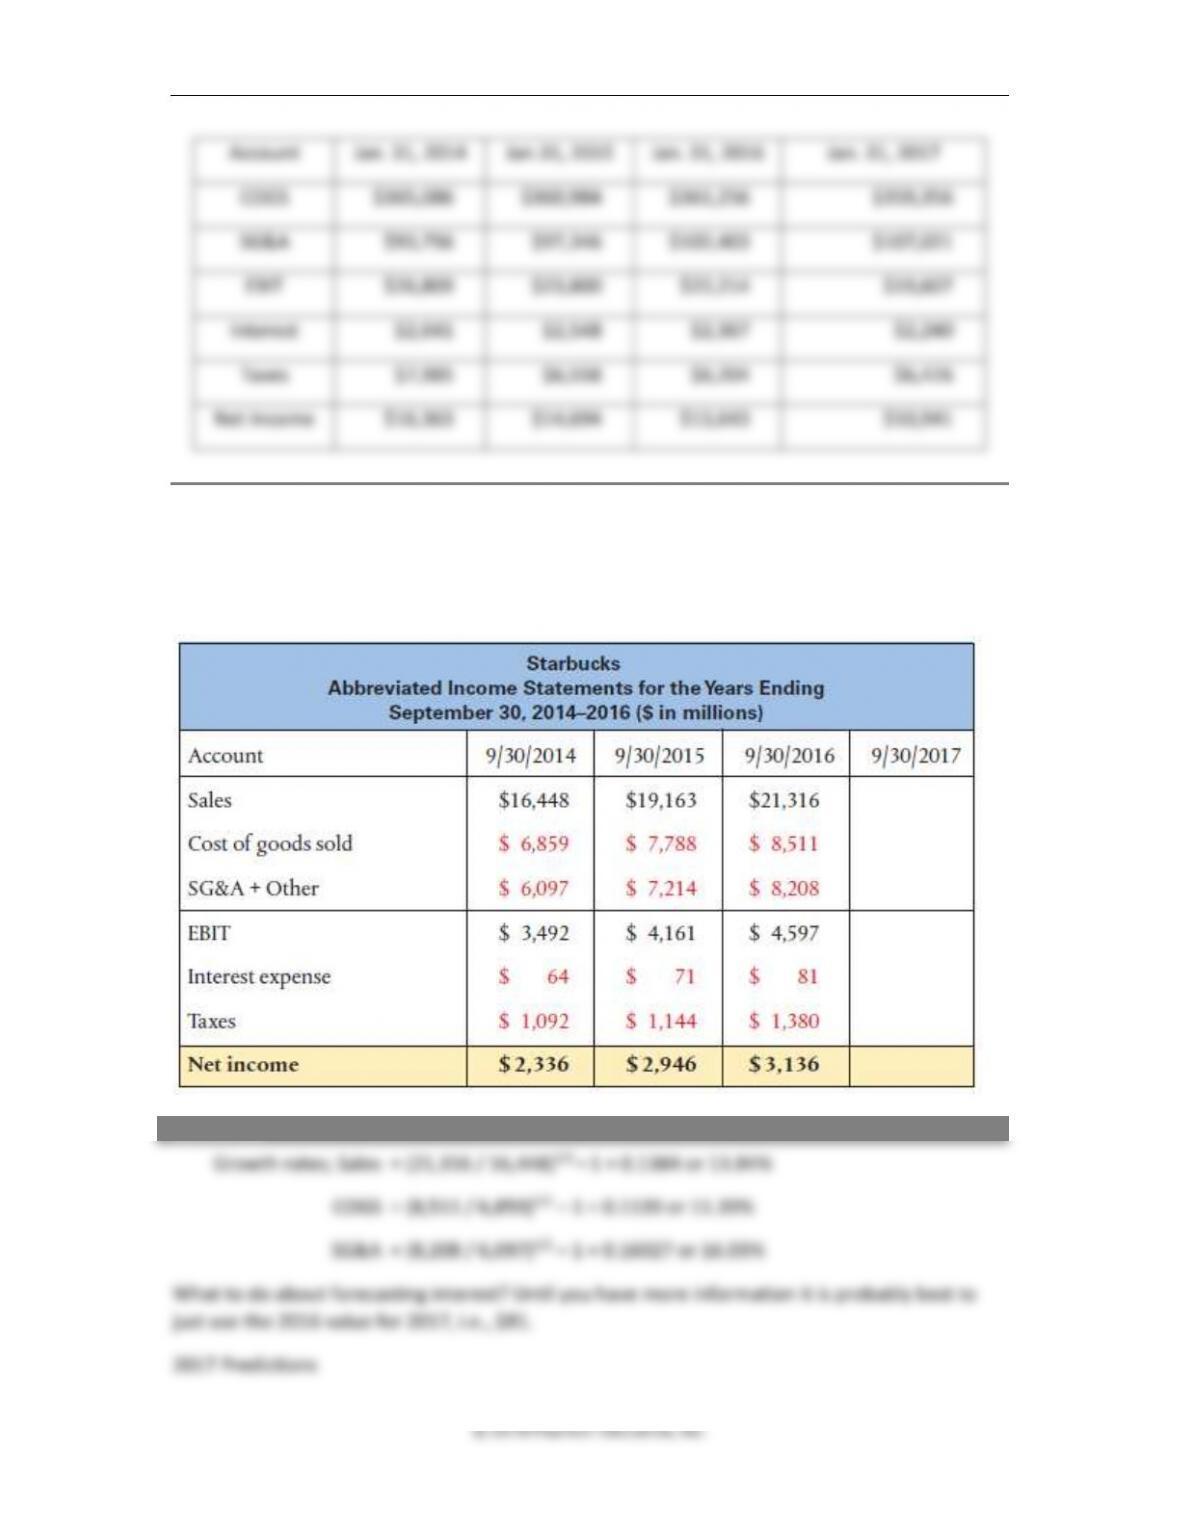
6. Predicting net income. Below are abbreviated income statements for Starbucks. Predict the
net income for the period ending September 31, 2017, by determining the growth rates of
sales, COGS, SG&A, and interest expense. Use a tax rate of 30%. Then look up the numbers
for Starbucks for 2017 and see how you did.
ANSWER
Chapter 14 ◼ Financial Ratios and Firm Performance 473
© 2018 Pearson Education, Inc.
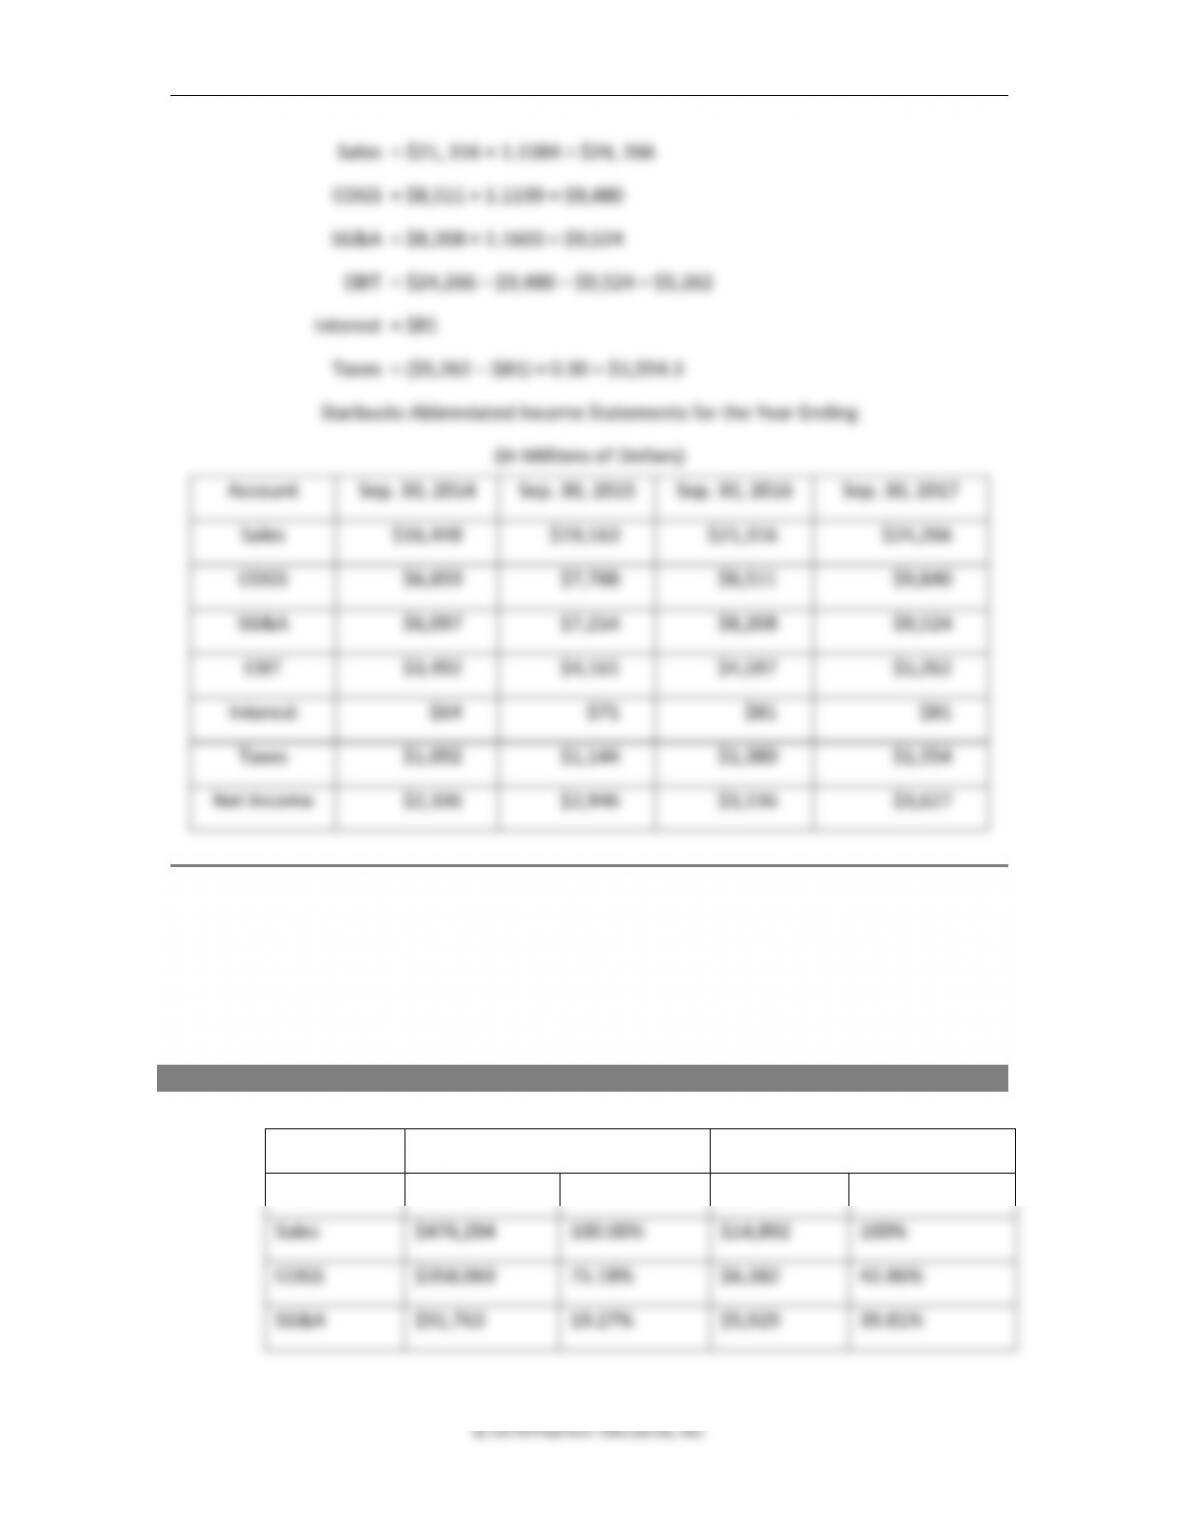
Sales = $21, 316 × 1.1384 = $24, 266
COGS = $8,511 × 1.1139 = $9,480
SG&A = $8,208 × 1.1603 = $9,524
EBIT = $24,266 – $9,480 – $9,524 = $5,262
Interest = $81
Taxes = ($5,262 – $81) × 0.30 = $1,554.3
Starbucks Abbreviated Income Statements for the Year Ending
(In Millions of Dollars)
Account
Sep. 30, 2014
Sep. 30, 2015
Sep. 30, 2016
Sep. 30, 2017
Sales
$16,448
$19,163
$21,316
$24,266
COGS
$6,859
$7,788
$8,511
$9,840
SG&A
$6,097
$7,214
$8,208
$9,524
EBIT
$3,492
$4,161
$4,597
$5,262
Interest
$64
$71
$81
$81
Taxes
$1,092
$1,144
$1,380
$1,554
Net Income
$2,336
$2,946
$3,136
$3,627
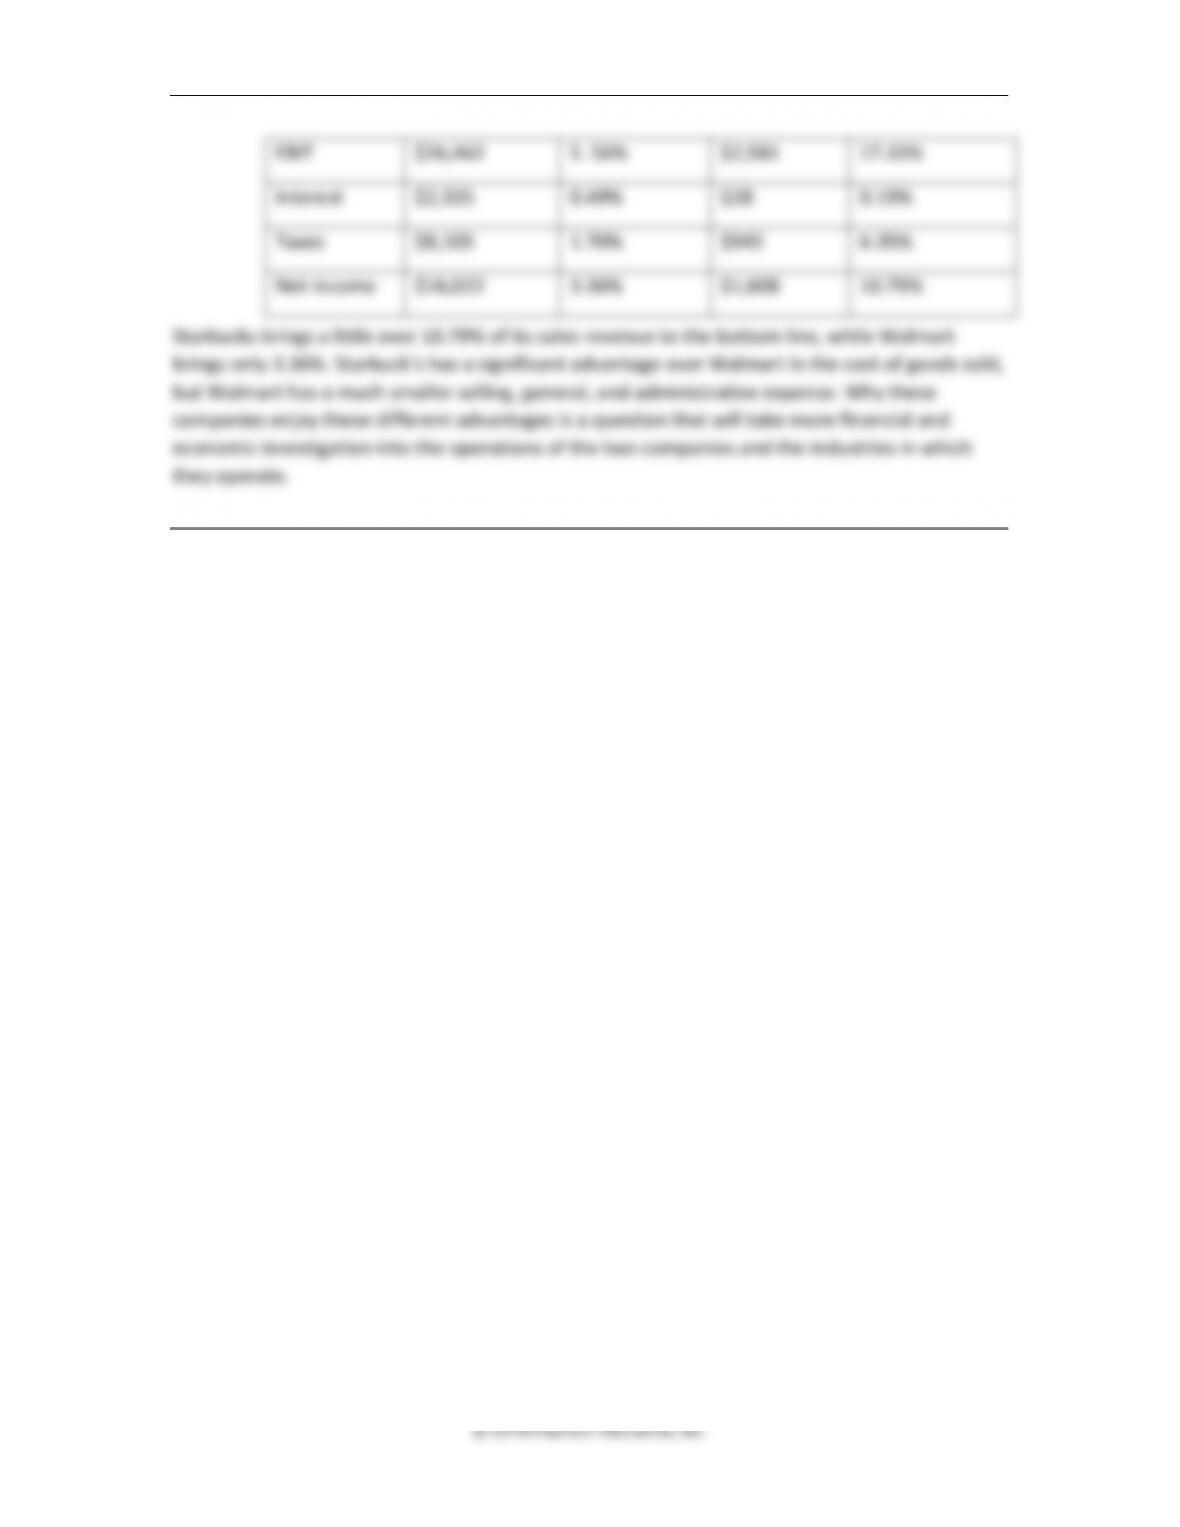
7. Common-size financial statements. Prepare common-size income statements for Walmart
and Starbucks using the January 2016 information for Walmart and your September 2016
information for Starbucks provided in Problems 5 and 6.Which company is doing a better
job of getting sales dollars to net income? Where is the one company having an advantage
over the other company in turning revenue into net income?
ANSWER
Walmart
Starbucks
Account
Jan. 31, 2016
Percent
Sep. 30, 2016
Percent
Sales
$476,294
100.00%
$14,892
100%
COGS
$358,069
75.18%
$6,382
42.86%
SG&A
$91,763
19.27%
$5,929
39.81%
474 Brooks ◼ Financial Management: Core Concepts, 4e
© 2018 Pearson Education, Inc.
EBIT
$26,462
5. 56%
$2,581
17.33%
Interest
$2,335
0.49%
$28
0.19%
Taxes
$8,105
1.70%
$945
6.35%
Net Income
$16,022
3.36%
$1,608
10.79%
Starbucks brings a little over 10.79% of its sales revenue to the bottom line, while Walmart
brings only 3.36%. Starbuck’s has a significant advantage over Walmart in the cost of goods sold,
but Walmart has a much smaller selling, general, and administrative expense. Why these
companies enjoy these different advantages is a question that will take more financial and
economic investigation into the operations of the two companies and the industries in which
they operate.
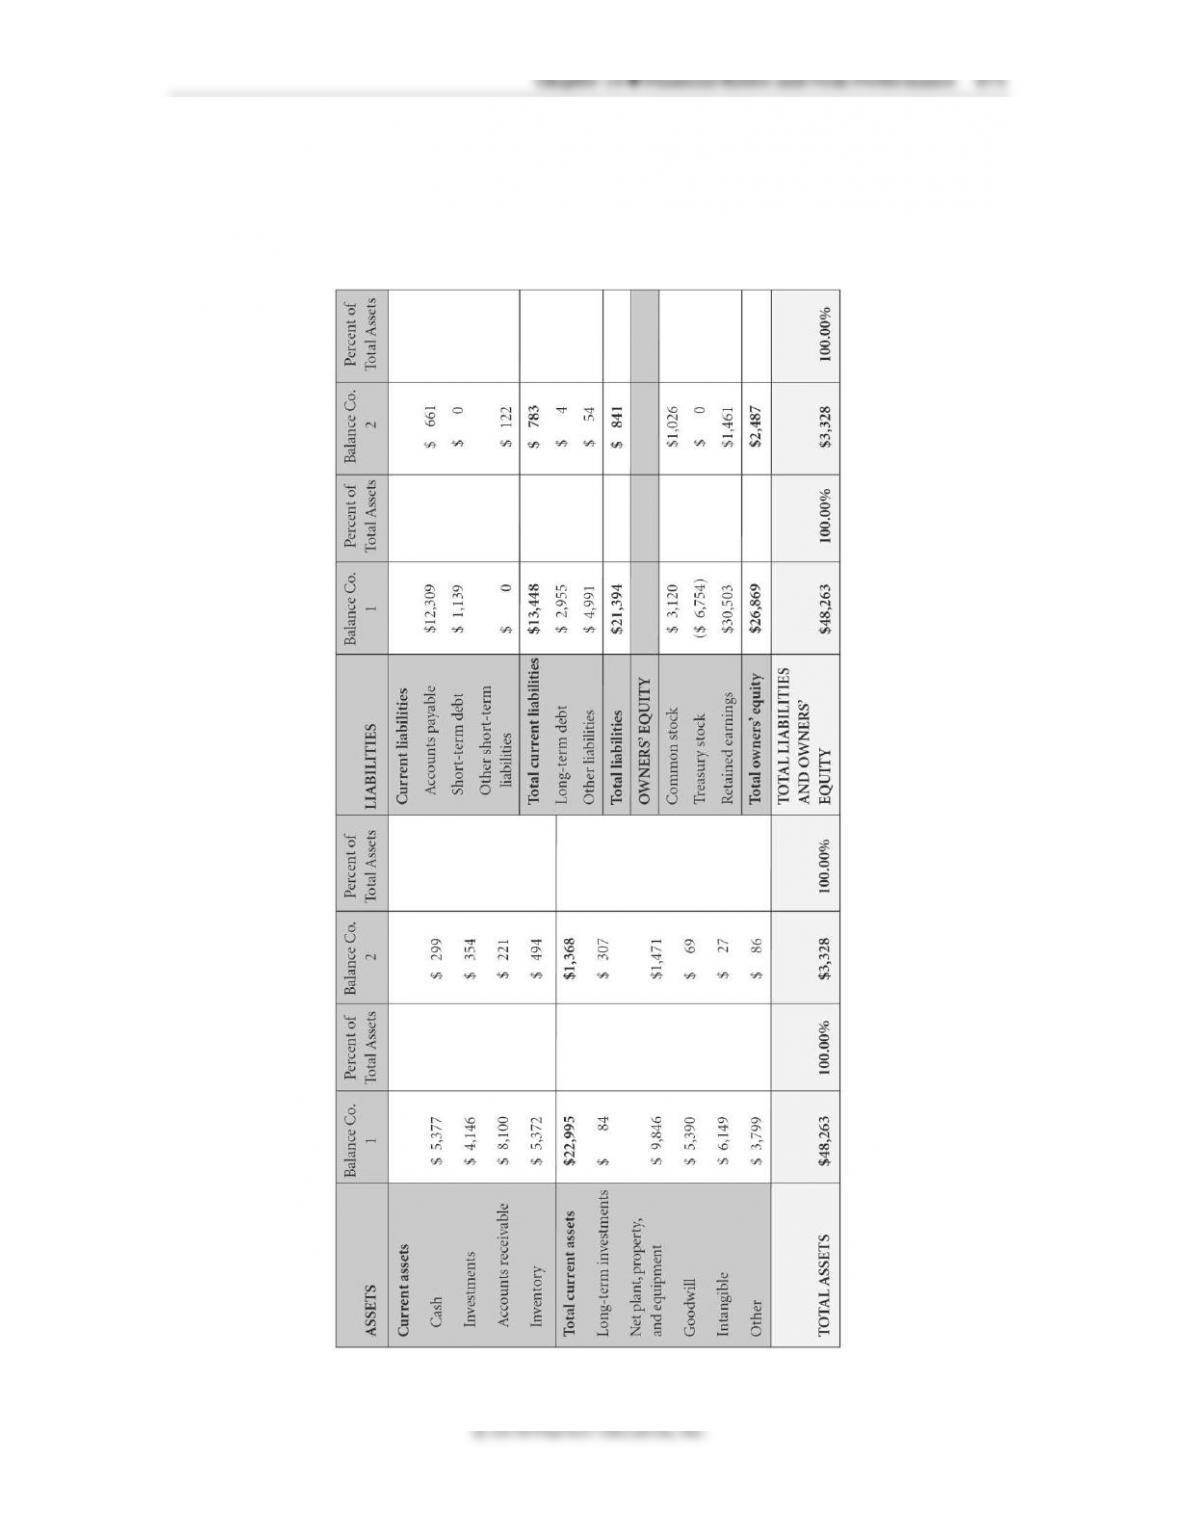

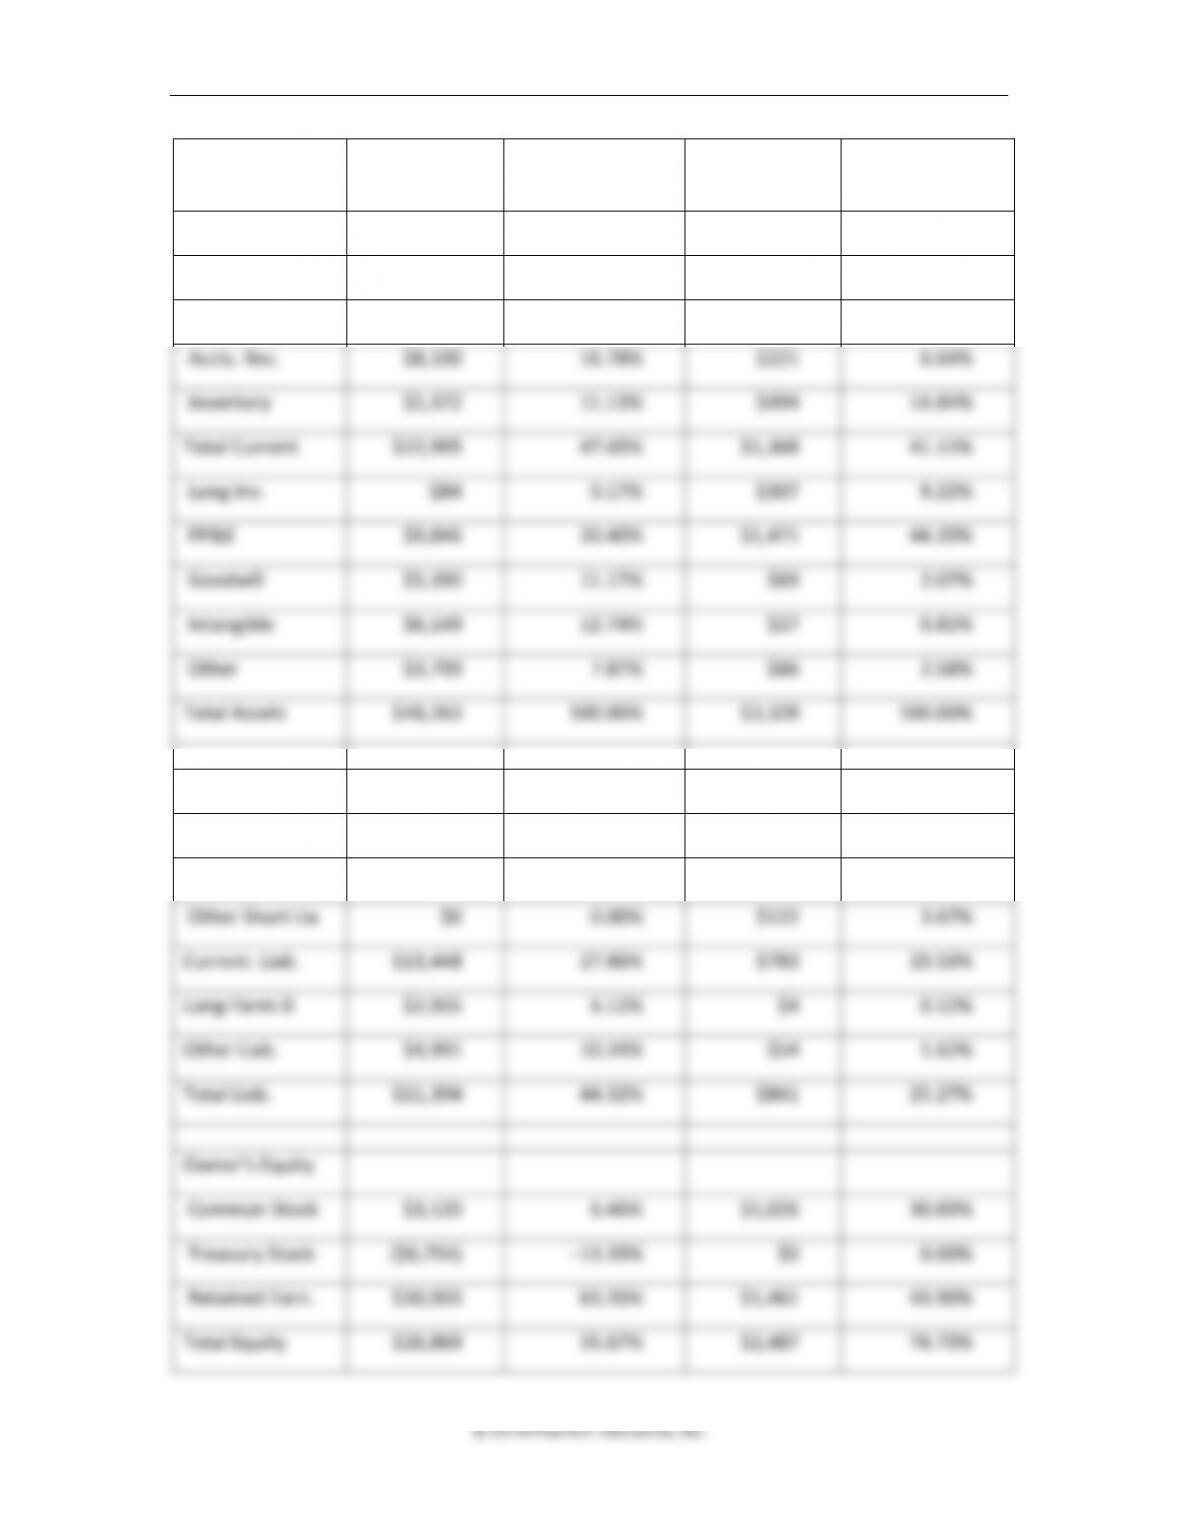
Chapter 14 ◼ Financial Ratios and Firm Performance 477
Account
B. Sheet Co. 1
Percentage of
Total Assets
B. Sheet Co. 2
Percentage of
Total Assets
Current Assets
Cash
$5,377
11.14%
$299
8.98%
Investments
$4,146
8.59%
$354
10.64%
Accts. Rec.
$8,100
16.78%
$221
6.64%
Inventory
$5,372
11.13%
$494
14.84%
Total Current
$22,995
47.65%
$1,368
41.11%
Long Inv.
$84
0.17%
$307
9.22%
PP&E
$9,846
20.40%
$1,471
44.20%
Goodwill
$5,390
11.17%
$69
2.07%
Intangible
$6,149
12.74%
$27
0.81%
Other
$3,799
7.87%
$86
2.58%
Total Assets
$48,263
100.00%
$3,328
100.00%
Liabilities
Accts. Pay.
$12,309
25.50%
$661
19.86%
Short –Term D
$1,139
2.36%
$0
0.00%
Other Short Lia
$0
0.00%
$122
3.67%
Current. Liab.
$13,448
27.86%
$783
23.53%
Long-Term D
$2,955
6.12%
$4
0.12%
Other Liab.
$4,991
10.34%
$54
1.62%
Total Liab.
$21,394
44.32%
$841
25.27%
Owner’s Equity
Common Stock
$3,120
6.46%
$1,026
30.83%
Treasury Stock
($6,754)
–13.39%
$0
0.00%
Retained Earn.
$30,503
63.20%
$1,461
43.90%
Total Equity
$26,869
55.67%
$2,487
74.73%
© 2018 Pearson Education, Inc.
Chapter 14 ◼ Financial Ratios and Firm Performance 479
For Problems 9 through 12, use the following data:
© 2018 Pearson Education, Inc.
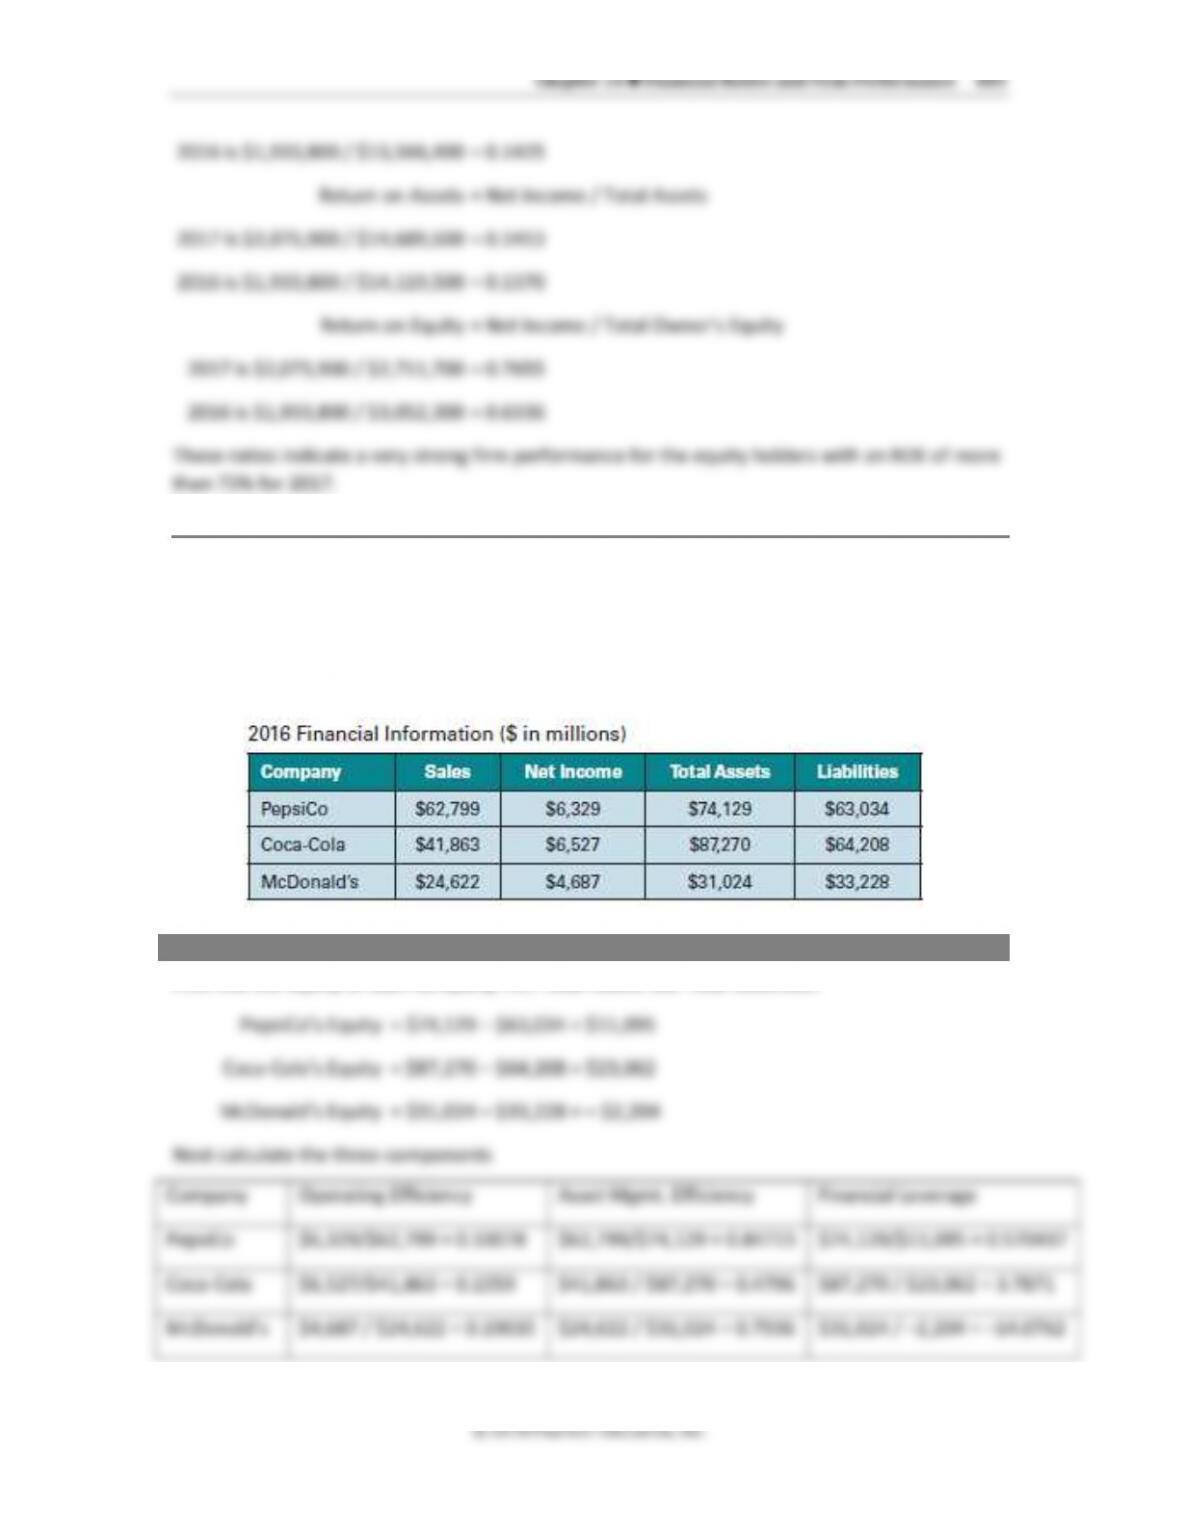
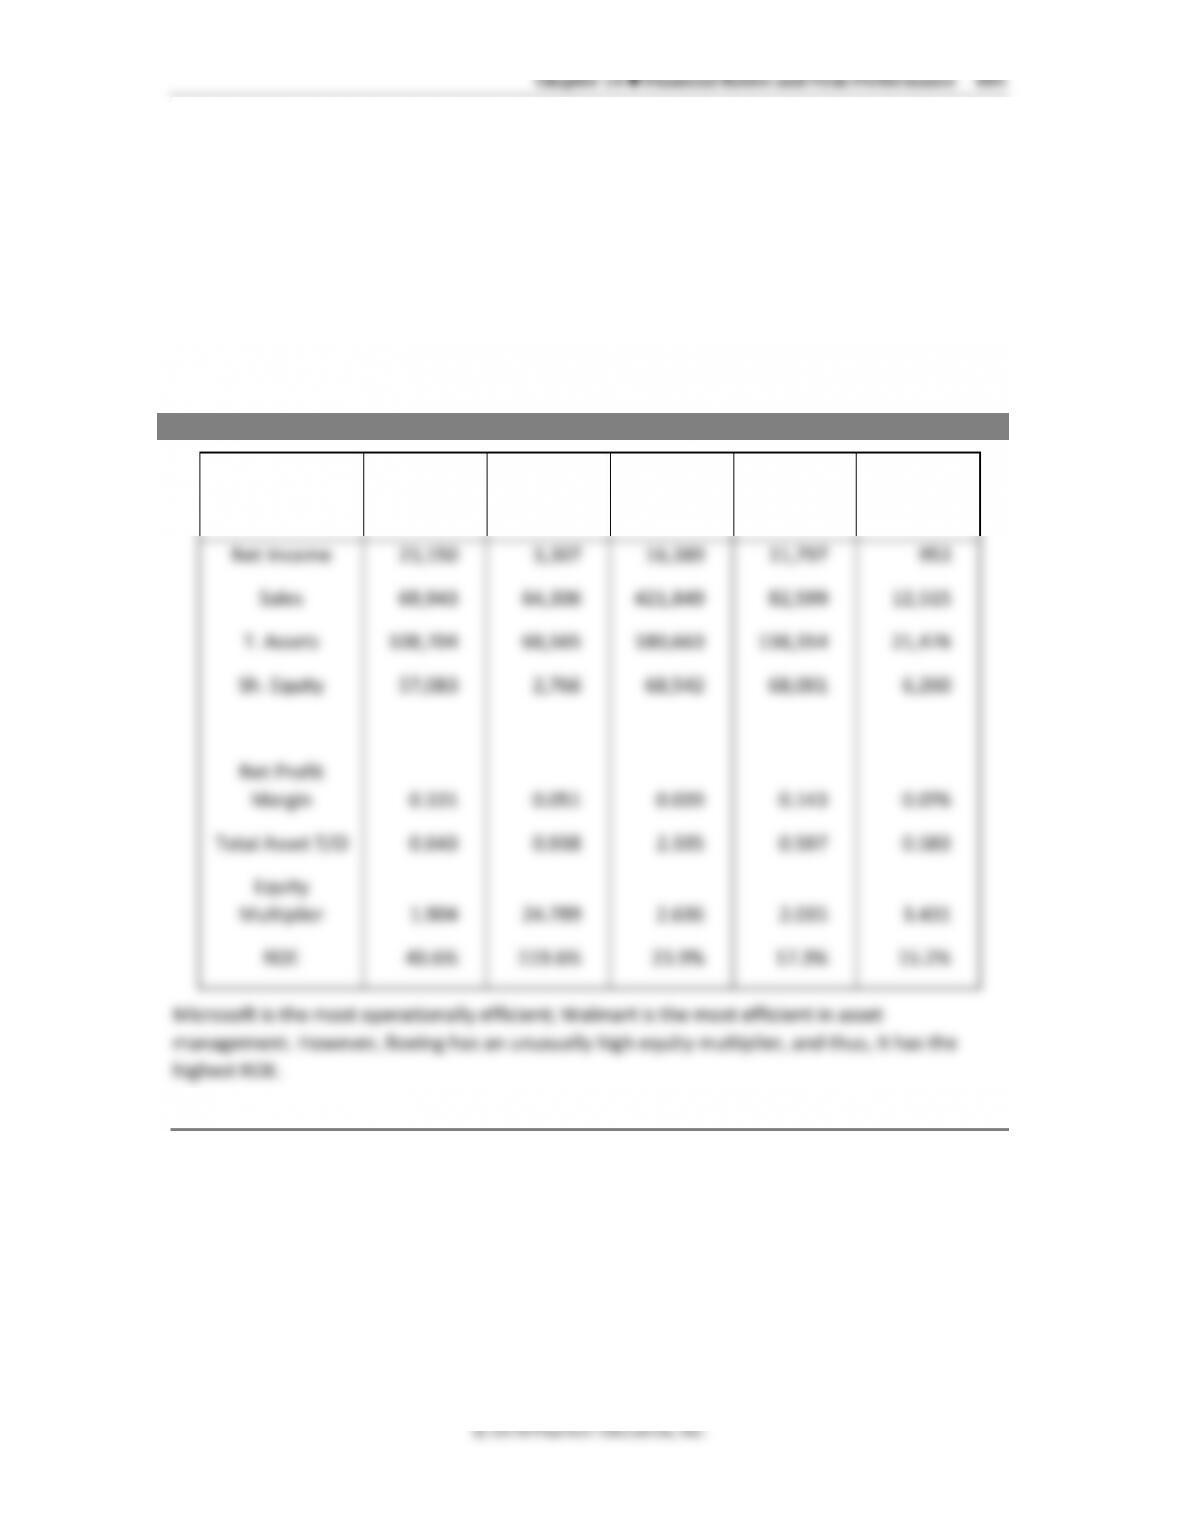
13. DuPont identity. For the following firms, find the return on equity using the three
components of the DuPont identity: operating efficiency, as measured by the profit margin
(net income/sales); asset management efficiency, as measured by asset turnover
(sales/total assets); and financial leverage, as measured by the equity multiplier (total
assets/total equity).
ANSWER
First find the equity of each company, i.e., Total Assets less Total Liabilities:
484 Brooks ◼ Financial Management: Core Concepts, 4e
© 2018 Pearson Education, Inc.
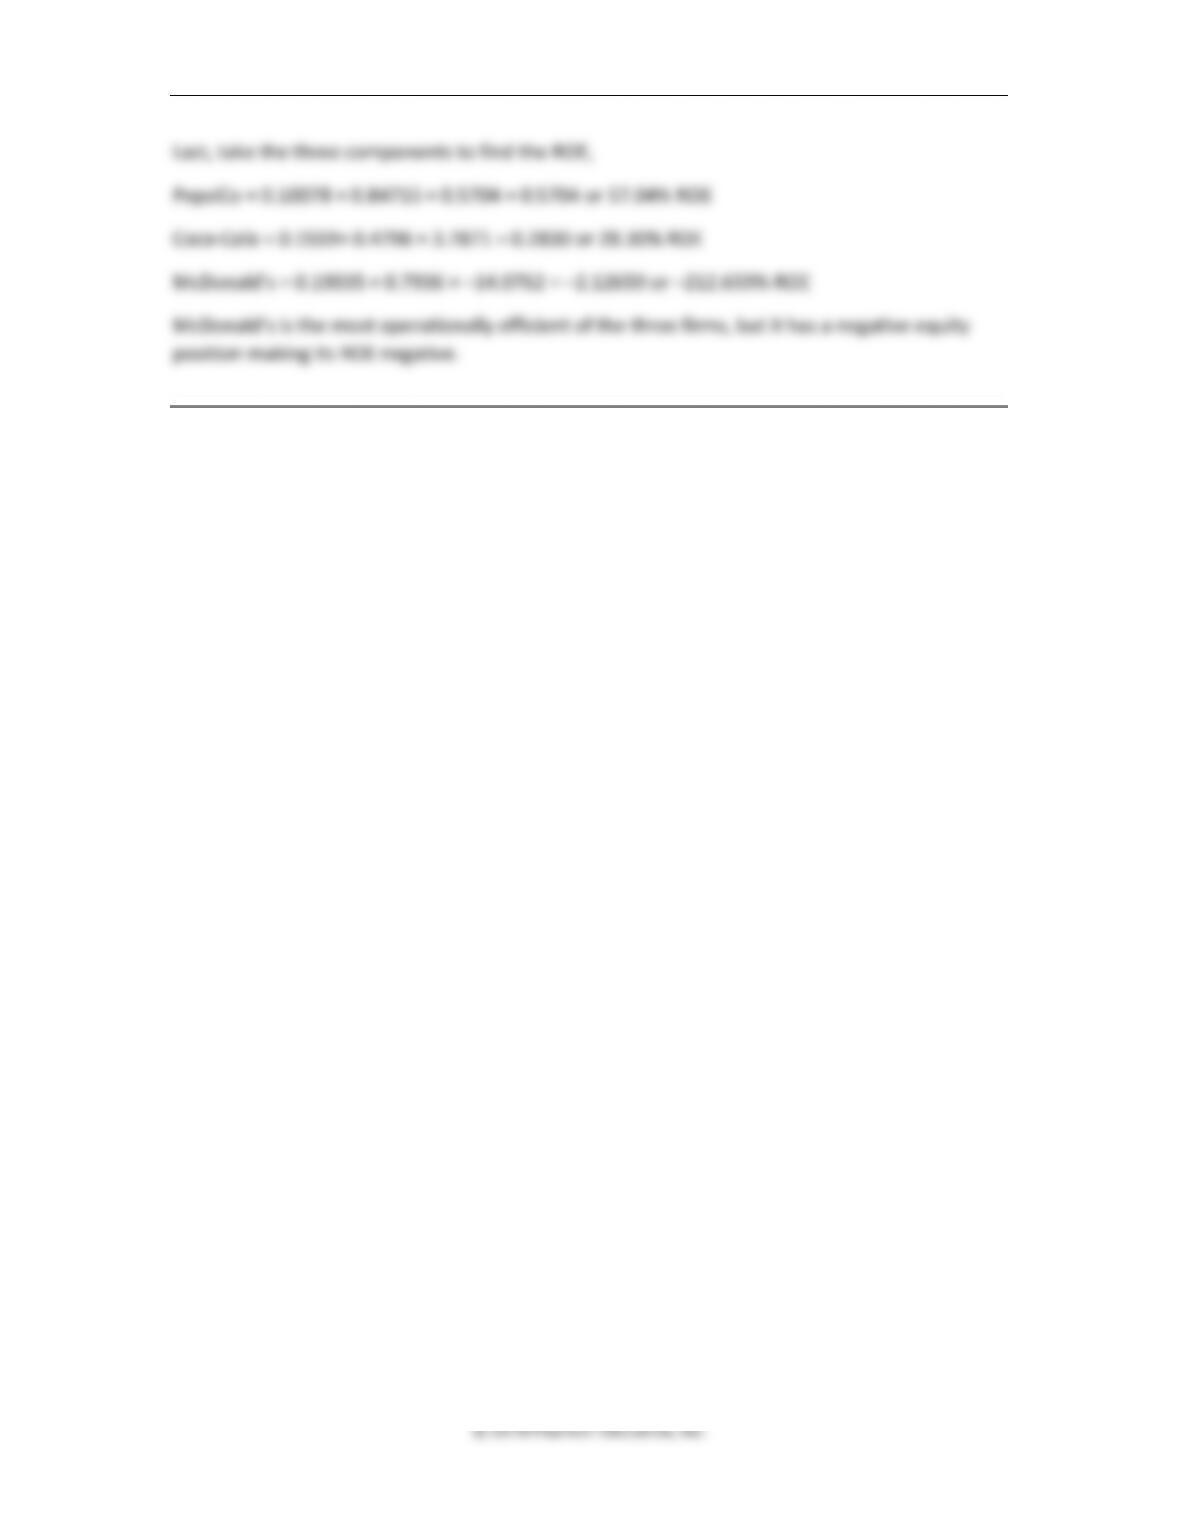
Last, take the three components to find the ROE,
PepsiCo = 0.10078 × 0.84715 × 0.5704 = 0.5704 or 57.04% ROE
Coca-Cola = 0.1559× 0.4796 × 3.7871 = 0.2830 or 28.30% ROE
McDonald’s = 0.19035 × 0.7936 × –14.0762 = –2.12659 or –212.659% ROE
McDonald’s is the most operationally efficient of the three firms, but it has a negative equity
position making its ROE negative.
© 2018 Pearson Education, Inc.
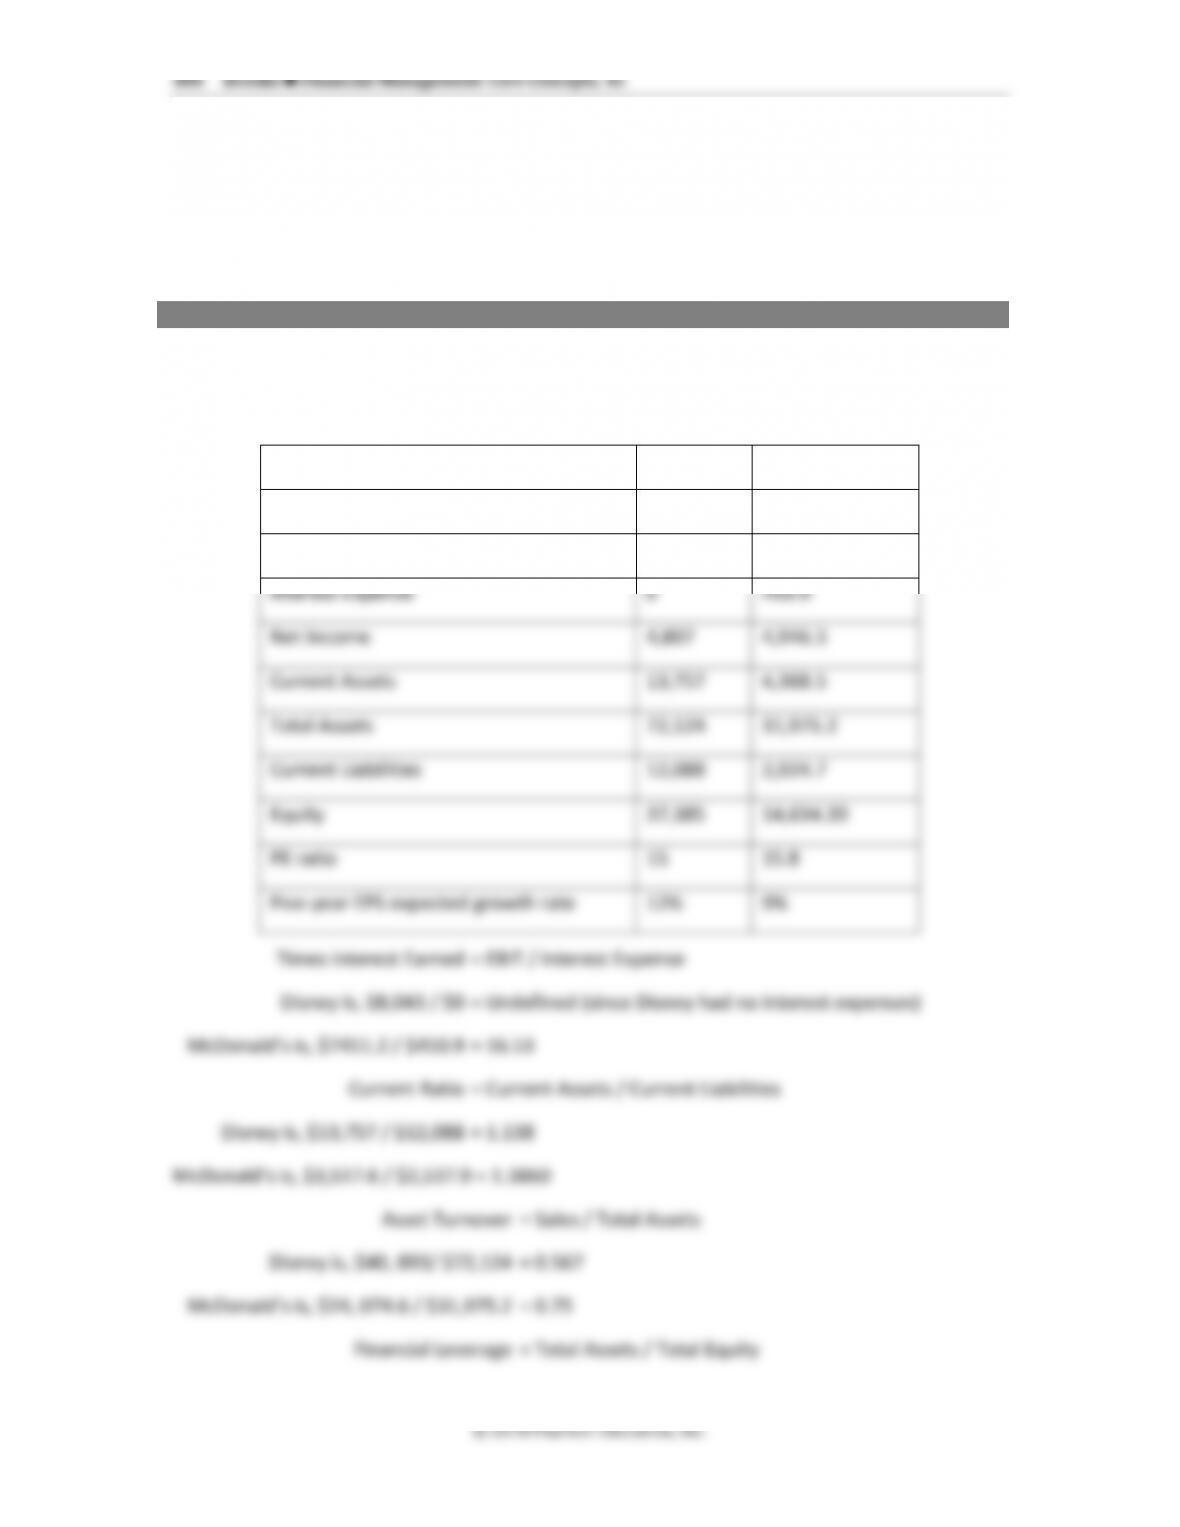
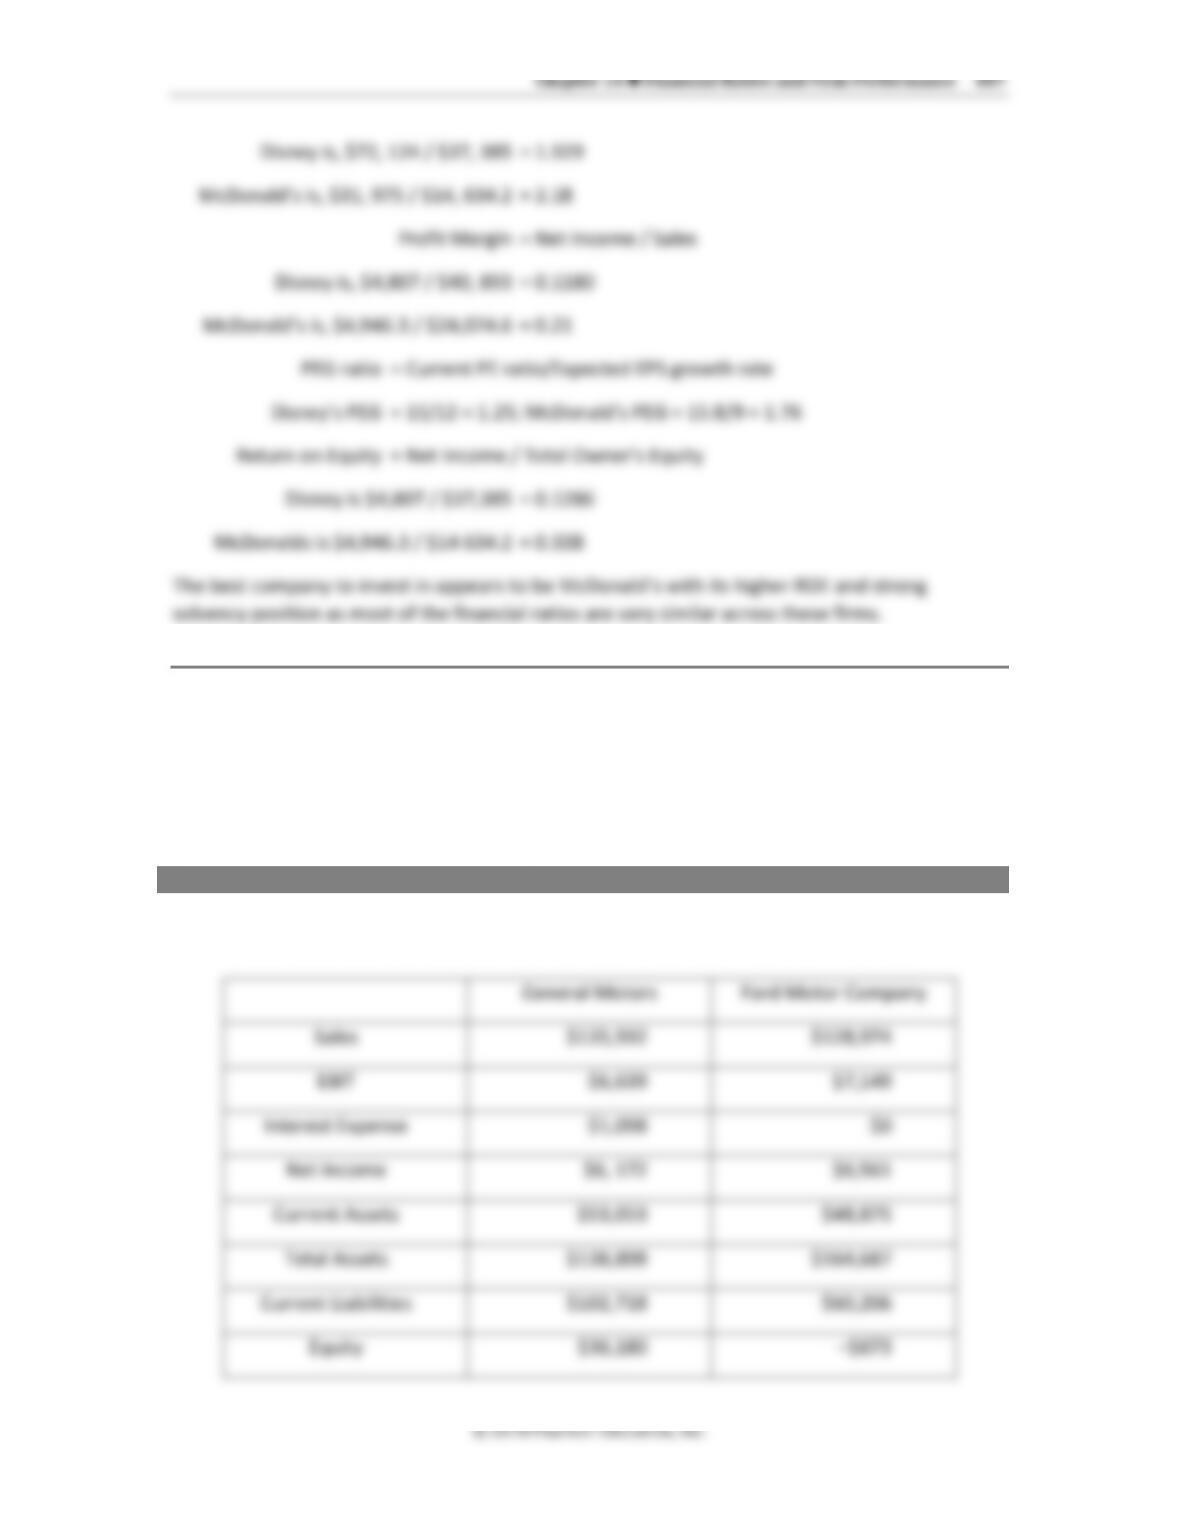
16. Company analysis. Go to a Web site such as Yahoo.com and find the financial statements of
General Motors (GM) and Ford Motor Company (F). Compare these two companies using
the following financial ratios: times interest earned, current ratio, asset turnover, financial
leverage, profit margin, PEG ratio, and return on equity. Which company would you invest
in, either as a bond holder or as a stockholder?
ANSWER
Look up these values for each company: Sales, EBIT, Interest Expense, Net Income, Current
Assets, Total Assets, Current Liabilities, and Equity (2010 year-end figures used here)
General Motors
Ford Motor Company
Sales
$135,592
$128,974
EBIT
$6,639
$7,149
Interest Expense
$1,098
$0
Net Income
$6, 172
$6,561
Current Assets
$53,053
$48,875
Total Assets
$138,898
$164,687
Current Liabilities
$102,718
$60,206
Equity
$36,180
–$673