448
Chapter 14
Financial Ratios and Firm Performance
LEARNING OBJECTIVES (Slide 14-2)
1. Create, understand, and interpret common-size financial statements.
2. Calculate and interpret financial ratios.
3. Compare different company performances using financial ratios, historical financial ratio
trends, and industry ratios.
IN A NUTSHELL…
Financial statements can provide vital information for managers and analysts if they know how
to organize the “mess” of numerical data into a meaningful format that can be used to analyze
and interpret the performance of firms. In this chapter, the author explains how accounting
information can be recast into common-size financial statements and various ratios, which can
then be used in conjunction with industry benchmarks to diagnose the strengths and
weaknesses of companies and conduct comparisons among companies.
LECTURE OUTLINE
14.1 Financial Statements (Slides 14-3 to 14-9)
Just like a doctor takes a look at a patient’s x-rays or cat-scan when diagnosing health problems,
a manager or analyst can take a look at a firm’s primary financial statements, i.e., the income
statement and the balance sheet, when trying to gauge the status or performance of a firm.
As explained in earlier chapters, the income statement provides a periodic recording of the
sources of revenue and expenses of a firm, while the balance sheet provides a point in time snap
shot of the firm’s assets, liabilities, and owner’s equity.
Benchmarking: The financial statements by themselves constitute fairly complex documents
involving a whole bunch of numbers.
The values are absolute in nature, and although they tell us something about the amount of
assets, liabilities, equity, revenues, expenses, and taxes of a firm, unless they are
“benchmarked” against some standard, it is difficult to really gauge what’s going on, primarily
because of size and maturity differences among firms.
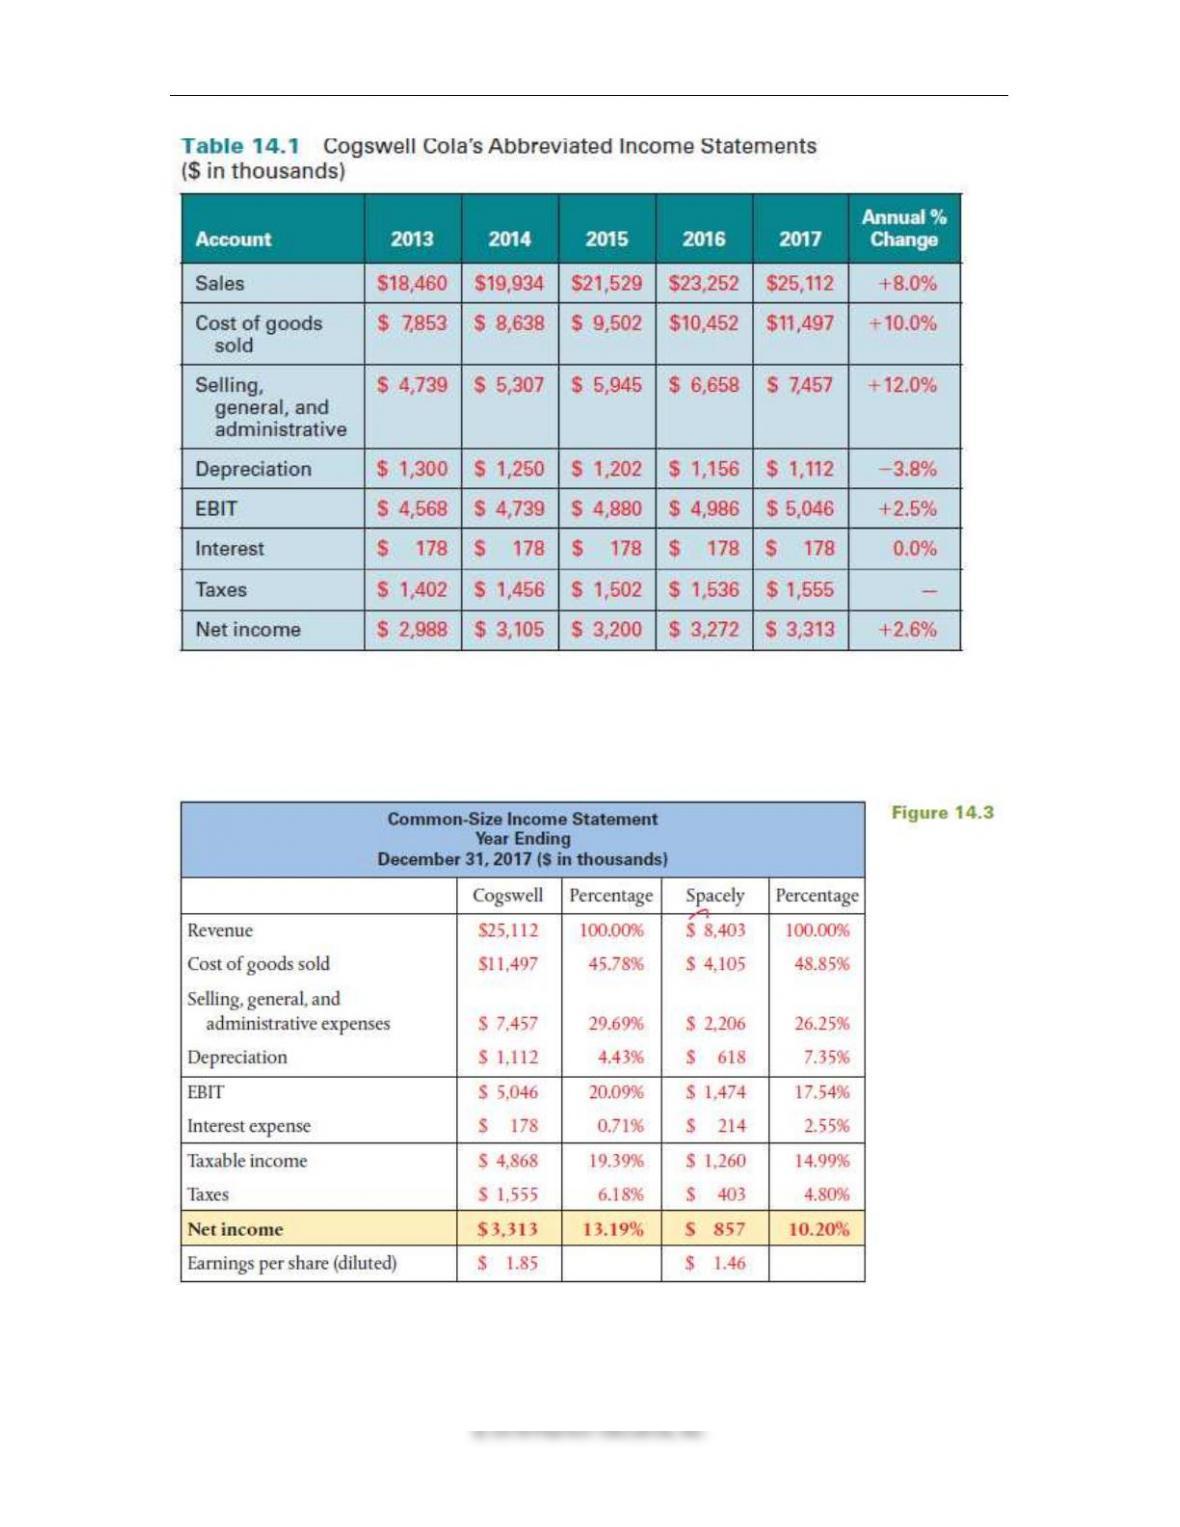
Chapter 14 ◼ Financial Ratios and Firm Performance 449
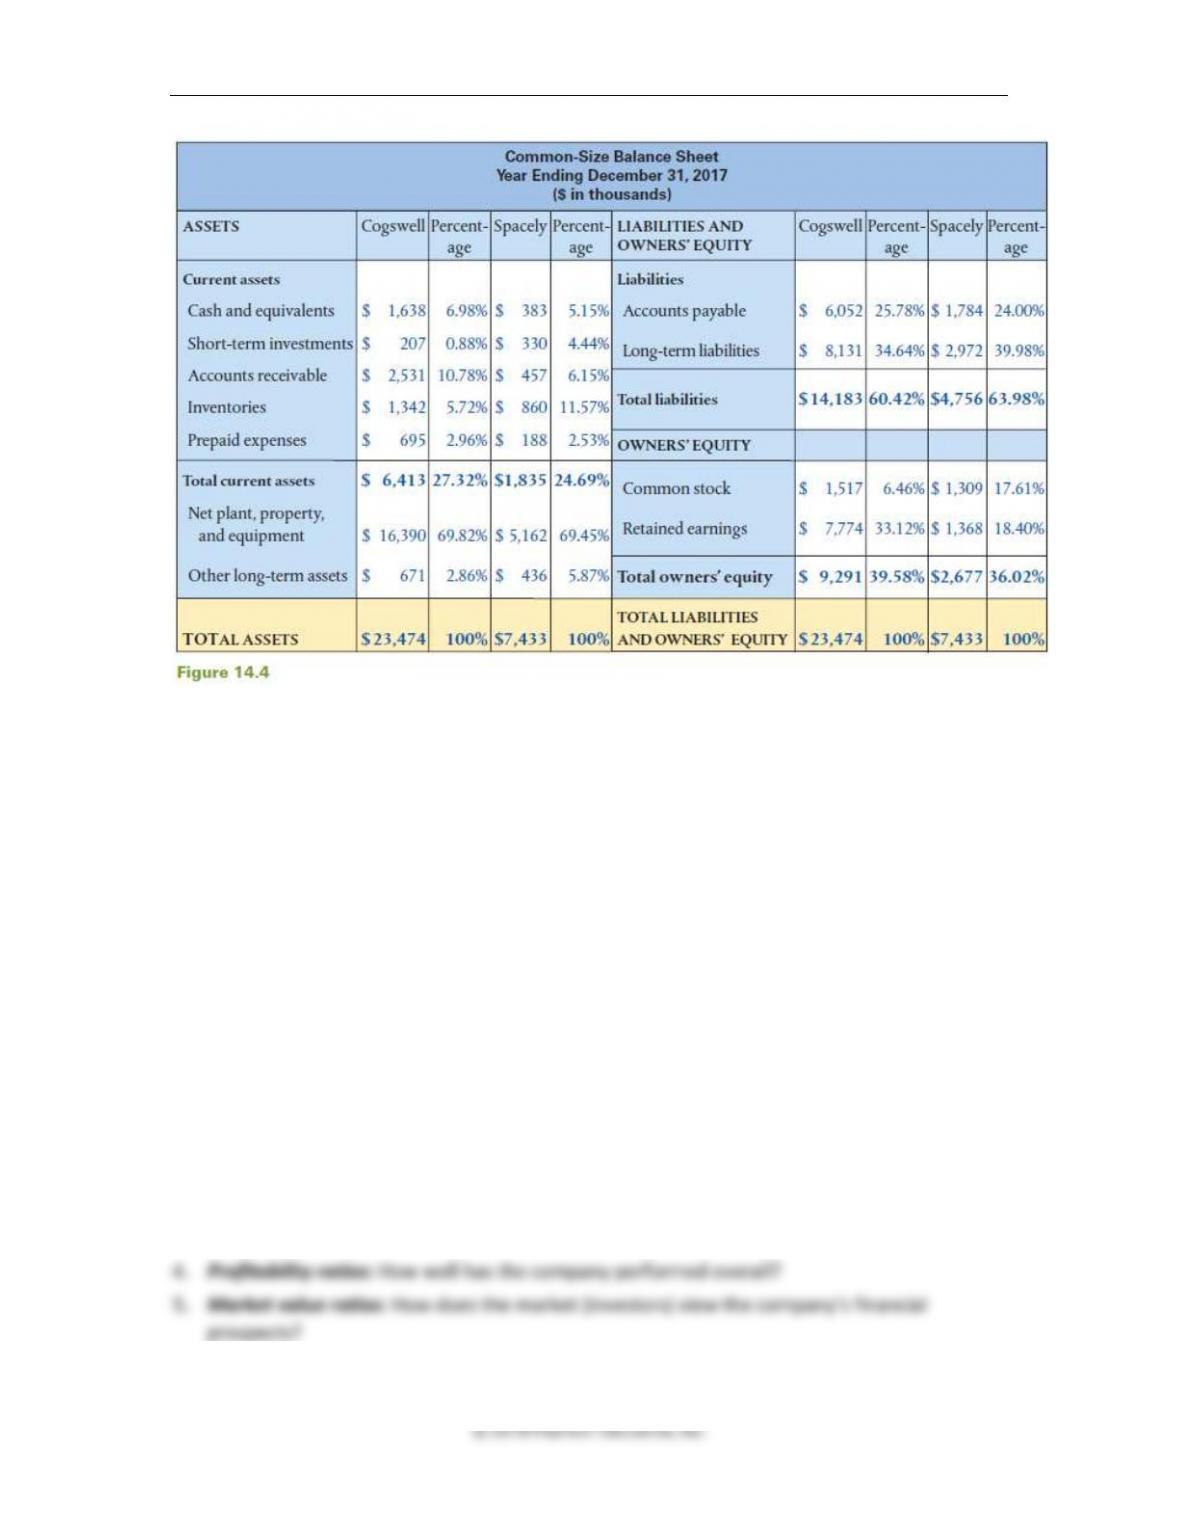
Another useful way to make some sense out of this mess of numbers, is to recast the income
statement and the balance sheet into common-size statements, by expressing each income
statement item as a percentage of sales and each balance sheet item as a percentage of total
assets, as shown in Figures 14.3 and 14.4 (shown below).
450 Brooks ◼ Financial Management: Core Concepts, 4e
Benchmarking is a good starting point to detect trends (if any) in a firm’s performance and to
make quick comparisons of key financial statement values with competitors on a relative basis.
More in-depth diagnosis requires individual item analyses and comparisons, which are best
done by conducting ratio analysis.
14.2 Financial Ratios (Slides 14-10 to 14-25)
Financial ratios are relationships between different accounts from financial statements—usually
the income statement and the balance sheet—that serve as performance indicators
Being relative values, financial ratios allow for meaningful comparisons across time, between
competitors, and with industry averages.
This section covers five key areas of a firm’s performance that can be analyzed using financial
ratios:
1. Liquidity ratios: Can the company meet its obligations over the short term?
2. Solvency ratios: (also known as financial leverage ratios): Can the company meet its
obligations over the long term?
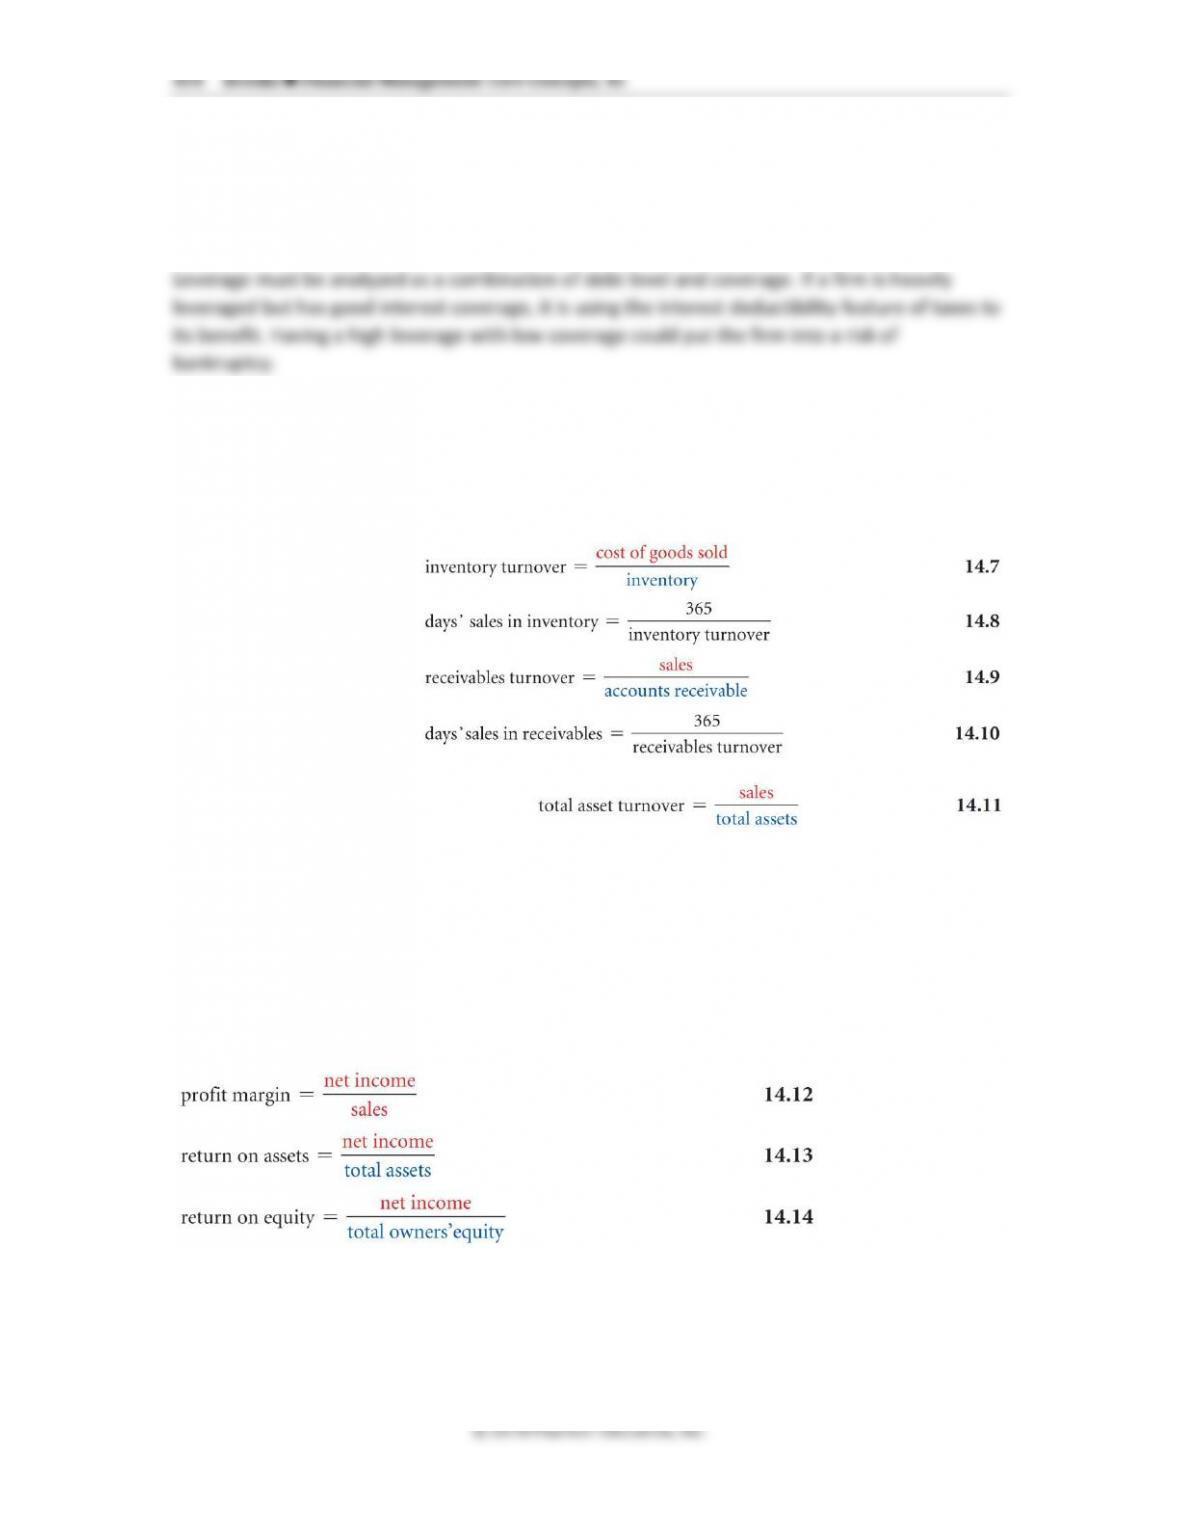
3. Asset management ratios: How efficiently is the company managing its assets to generate
sales?

Chapter 14 ◼ Financial Ratios and Firm Performance 451
It also discusses DuPont analysis, which involves a breakdown of the return on equity into its
three components, i.e., profit margin, turnover, and leverage.
452 Brooks ◼ Financial Management: Core Concepts, 4e
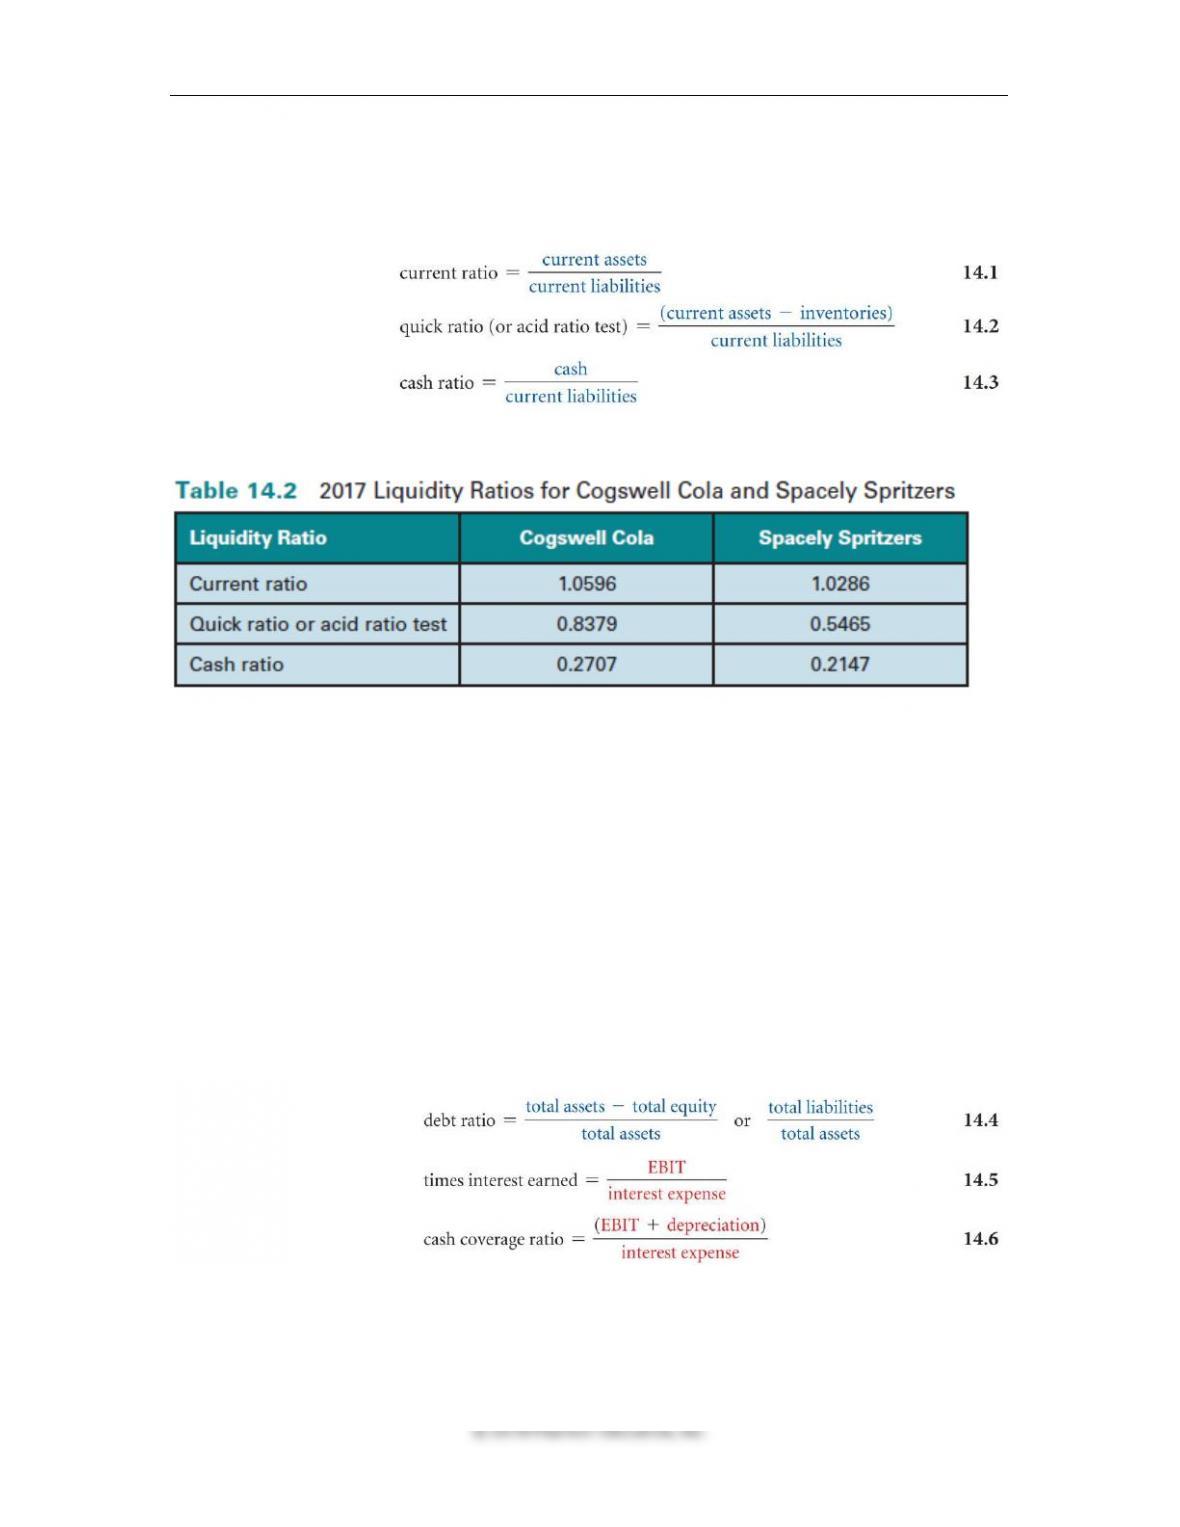
Short-Term Solvency: Liquidity Ratios: These ratios measure a company’s ability to cover
its short-term debt obligations in a timely manner.
Three key liquidity ratios include the current ratio, quick ratio, and cash ratio, as shown below:
Table14.2 summarizes the three liquidity ratios of Cogswell Cola and Spacely Spritzers.
It seems like overall, Cogswell has better liquidity and short-term solvency than Spacely, but,
higher investment in current assets also means that lower yields are being realized because
current assets are typically low yielding.
So, we need to look at the other areas and inter-related effects of the firm’s various accounting
items.
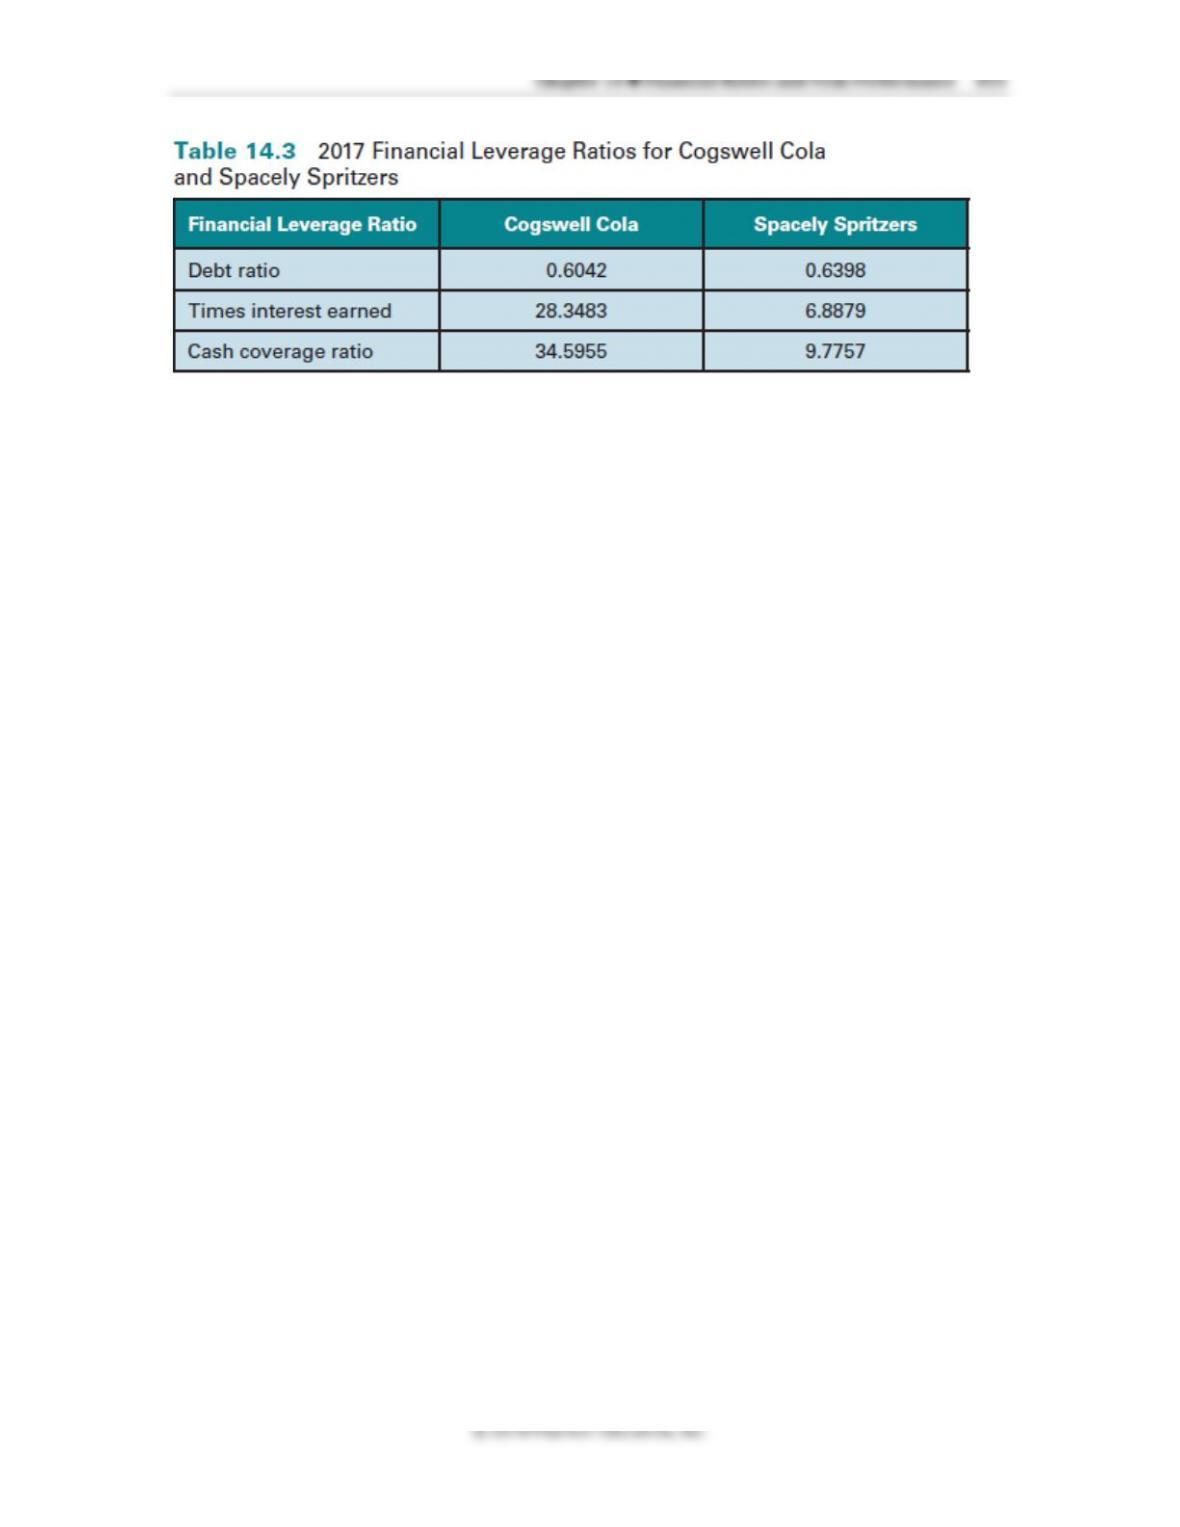
Long-Term Solvency: Financial Leverage Ratios: These ratios measure a company’s ability
to meet its long-term debt obligations based on its overall debt level and earnings capacity.
Failure to meet its interest obligation could put a firm into bankruptcy.
Equations 14.4, 14.5, and 14.6 can be used to calculate three key financial leverage ratios: the
debt ratio, times interest earned ratio, and cash coverage ratio.
456 Brooks ◼ Financial Management: Core Concepts, 4e
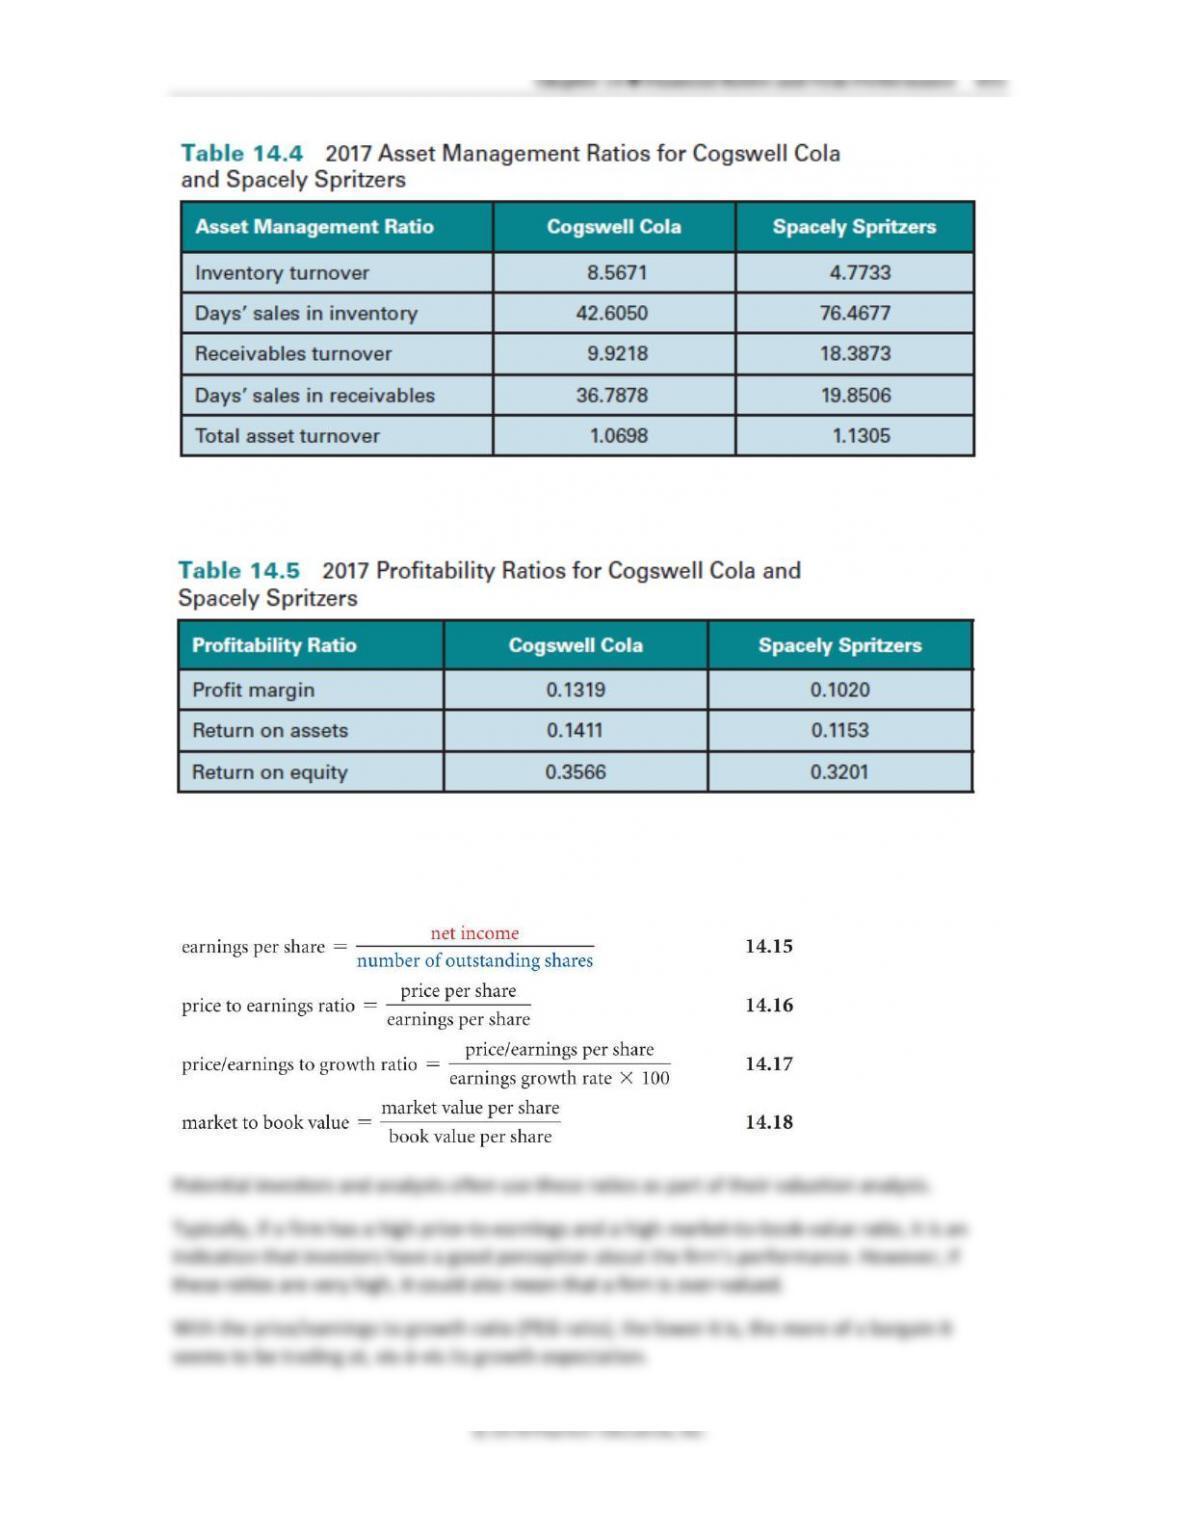
Ratio Cogswell Cola Spacely Spritzers
P/E 15.41 13.01
PEG 1.28 0.86
P/B 5.49 4.17
The ratios seem to indicate that investors in both firms seem to have good expectations about
their performance and are therefore paying fairly high prices relative to their earnings book
values.
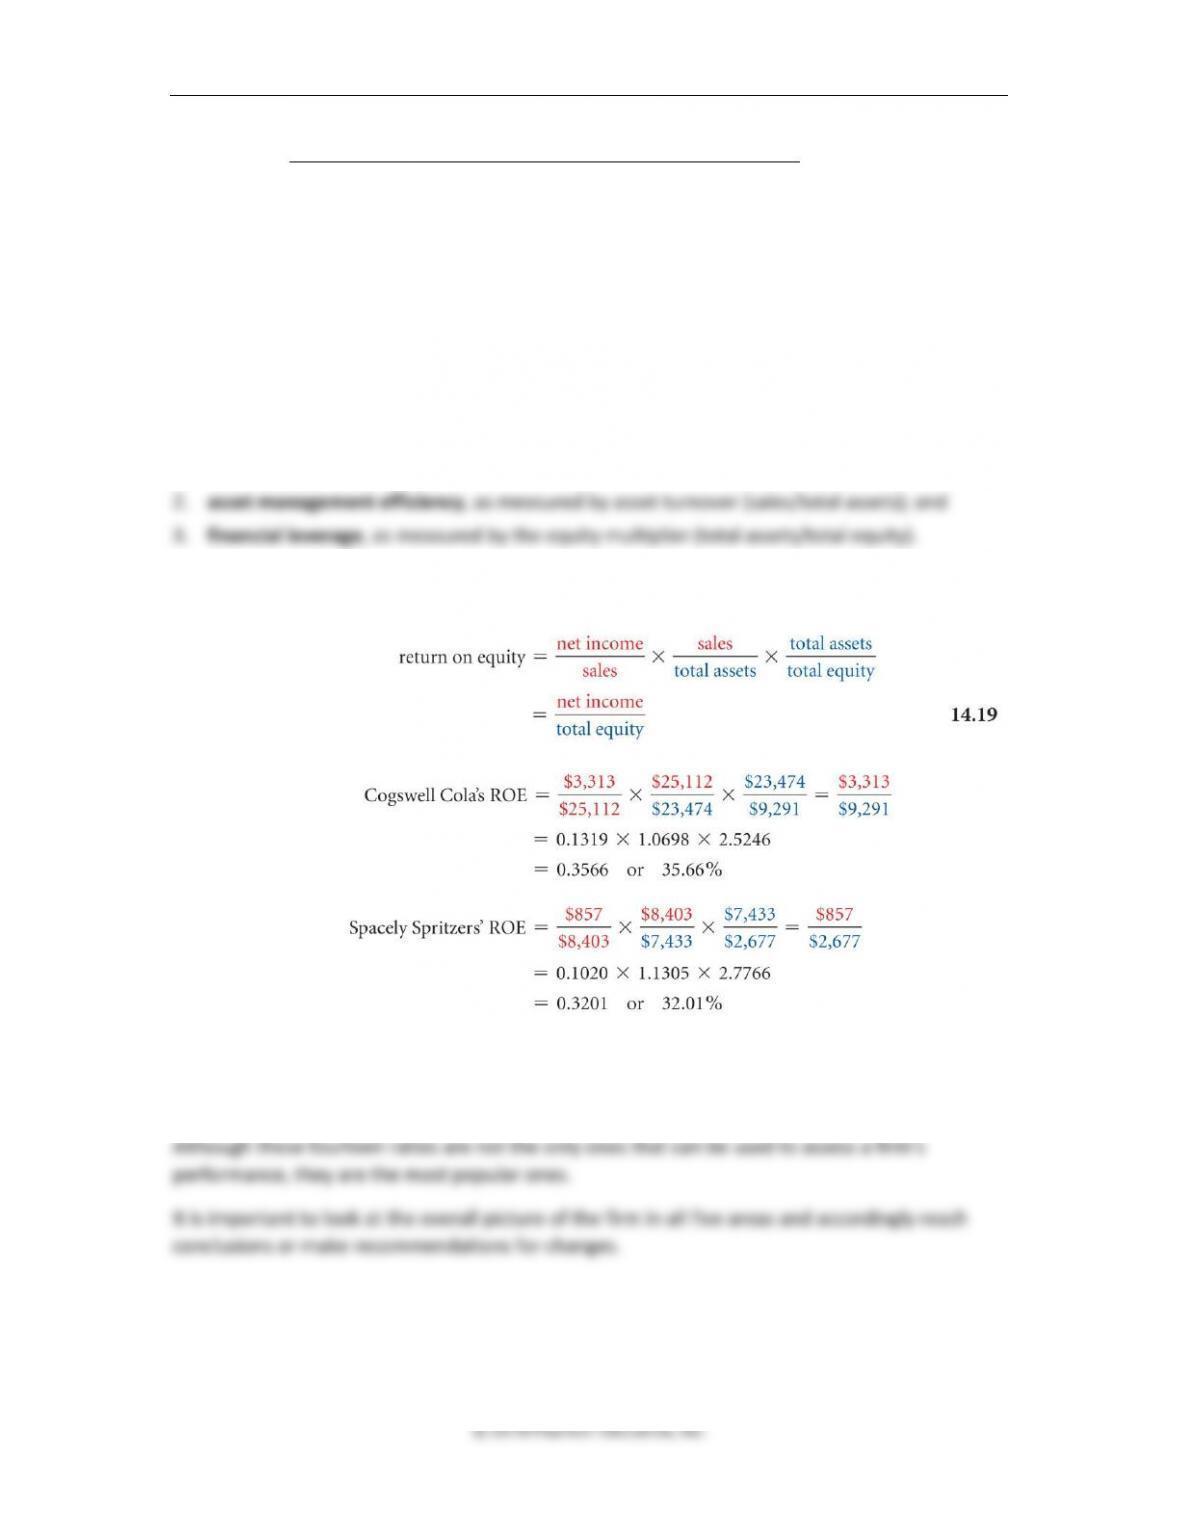
DuPont analysis: involves breaking down ROE into three components of the firm:
1. operating efficiency, as measured by the profit margin (net income/sales);
Equation 14.19 shows that if we multiply a firm’s net profit margin by its total asset turnover
ratio and its equity multiplier, we will get its return on equity.
The calculations indicate that Cogswell has better operational efficiency, i.e., it is better able to
move sales dollars into income, but Spritzer is more efficient at utilizing its assets, and because it
uses more debt, it is able to get more of its earnings to its shareholders.
458 Brooks ◼ Financial Management: Core Concepts, 4e
© 2018 Pearson Education, Inc.
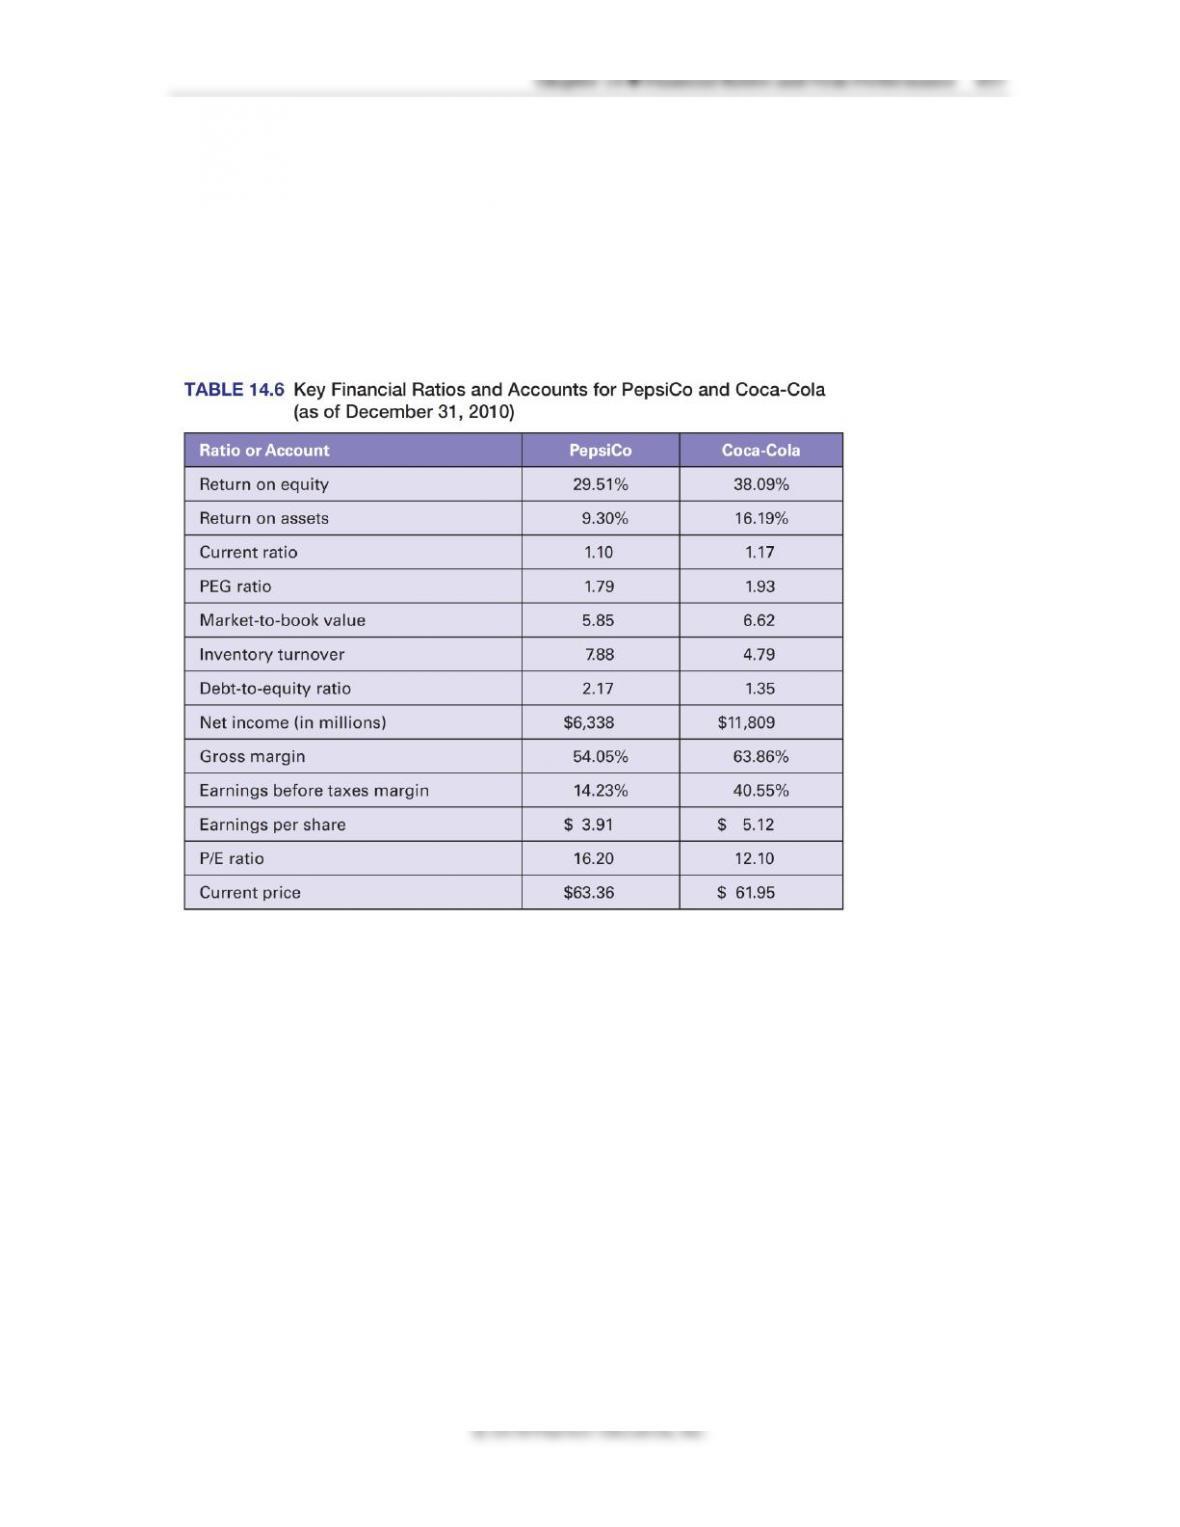
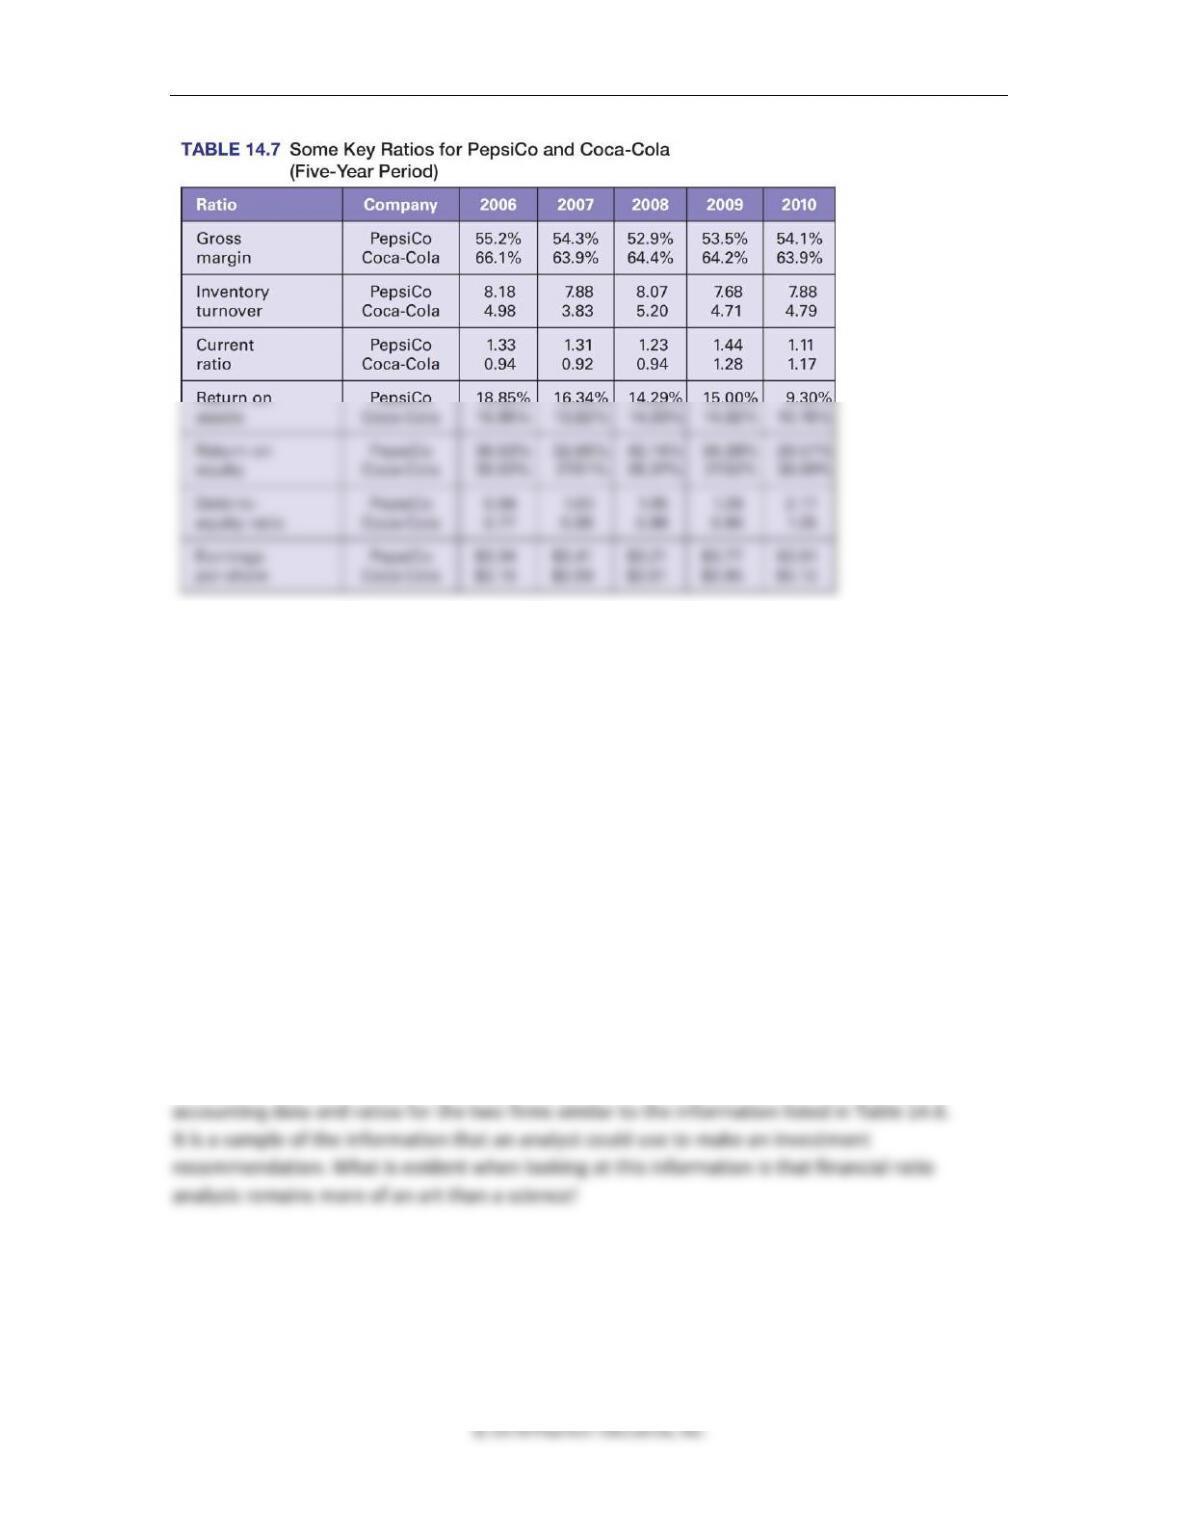
One of the first things we notice in looking over the five years of historical data is how similar
many of the ratios are from year to year, showing remarkable consistency for these two
companies.
We also can see that the gross margin of Coca-Cola is consistently higher than that of PepsiCo.
The debt-to-equity ratio of both firms is mostly falling over the five-year period.
We also can see that ROE has been very good for both companies, although slightly better for
PepsiCo.
Finally, PepsiCo has very strong and growing earnings per share over this period, outperforming
Coca-Cola’s EPS, but PepsiCo is also more expensive (higher current price per share).
Although these ratios don’t clearly point out to a winner, they do help the analyst in getting a
better picture about each firm’s performance.
Table 14.8 shows the relative six-year returns for PepsiCo and Coca-Cola over the period
2011–2016. It indicates that the return earned by an investor is a function of price changes,
dividends earned, as well the holding period of the investment. Table 14.9 shows updated
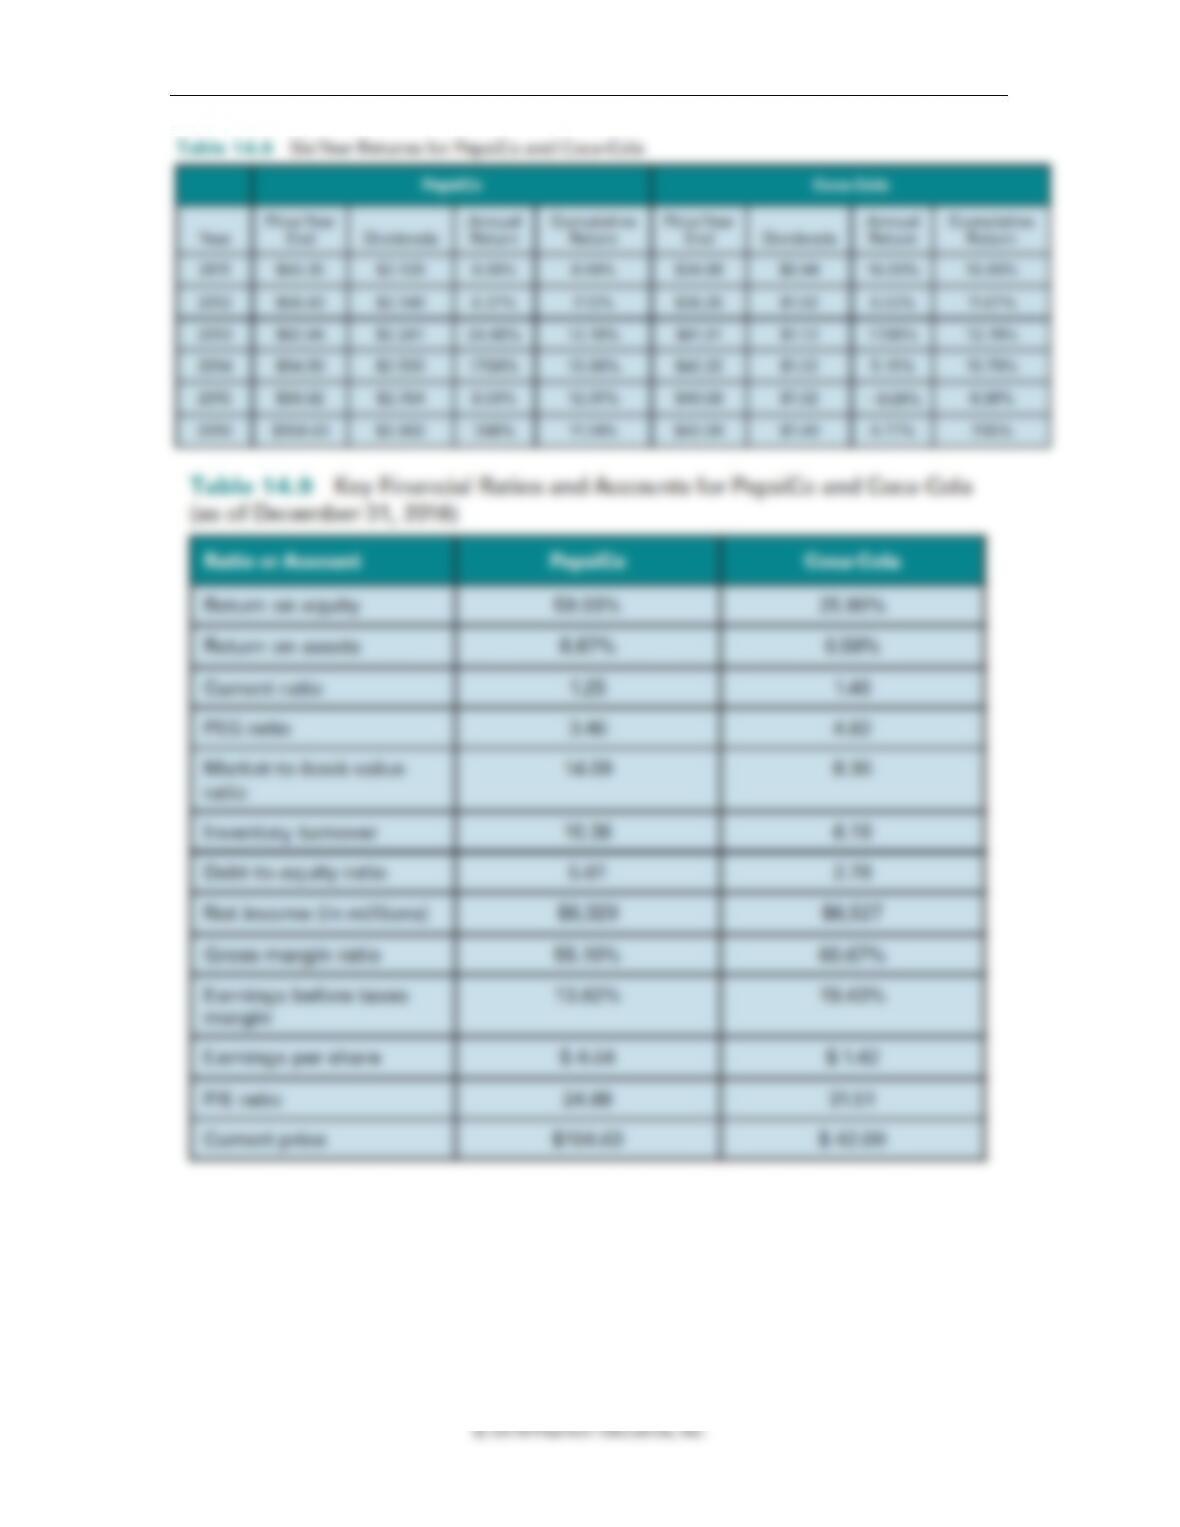
Chapter 14 ◼ Financial Ratios and Firm Performance 459
© 2018 Pearson Education, Inc.
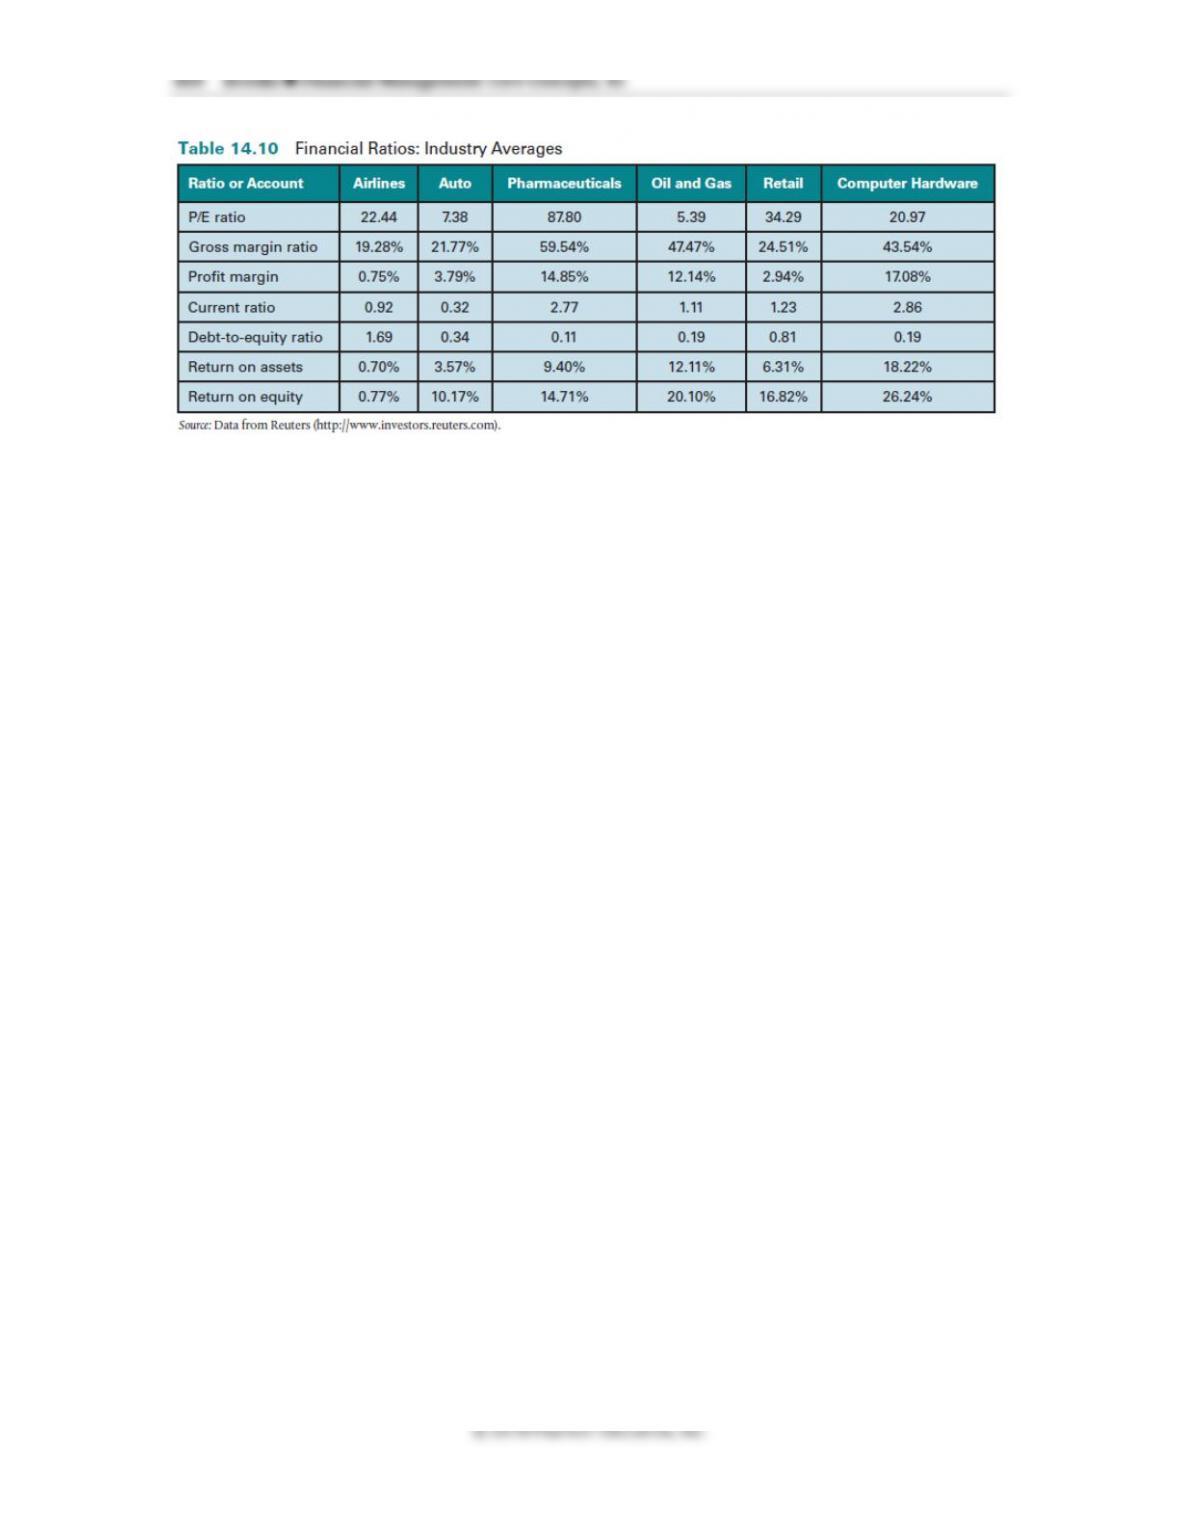
Industry ratios, such as the ones shown in Table 14.10, are often used as benchmarks for
financial ratio analysis of individual firms.
There can be significant differences in various key areas across industries, which is why
comparing company ratios with industry averages can be very useful and more informative.

© 2018 Pearson Education, Inc.
1. What is the accounting identity?
2. What does analyzing companies over time tell a finance manager?
3. What does restating financial statements into common-size financial statements allow a
finance manager or financial analyst to do?
4. What are liquidity ratios? Given an example of a liquidity ratio and how it helps evaluate a
company’s performance or future performance from an outsider’s view.
5. What are solvency ratios? Which ratio would be of most interest to a banker considering a
debt loan to a company? Why?
6. What are asset management ratios? For retail firms, what is one of the key management
ratios? Why?
7. What does the P/E ratio tell an outsider about a company? Why might this ratio not
provide very compelling evidence of the firm’s performance?
8. What are the three components of the DuPont identity? What do they analyze?

464 Brooks ◼ Financial Management: Core Concepts, 4e
© 2018 Pearson Education, Inc.
Interest Expense
$6,851
$7,677
$8,857
Income Before Tax
$54,361
$74,876
$75,884
Taxes
$20,385
$28,079
$28,639
Net Income
$33,976
$46,797
$47,245
Shares Outstanding
16,740,000
16,740,000
16,740,000
EPS
$2.03
$2.78
$2.82