422
Chapter 13
Working Capital Management
LEARNING OBJECTIVES (Slide 13-2)
1. Model the cash conversion cycle and explain its components.
2. Understand why the timing of accounts receivable is important and explain the components
of credit policy.
3. Understand the float concept and its effect on cash flow and explain how to speed up
receivables and slow down disbursements.
4. Explain inventory management techniques and calculate the economic order quantity
(EOQ).
5. Account for working capital changes in capital budgeting decisions.
IN A NUTSHELL…
In this chapter, the author covers various topics related to the efficient management of a firm’s
current assets such as cash, accounts receivable, and inventory. Because there is typically a time
lag between when a firm places an order and pays for raw materials to when a product is
manufactured, shipped out, and paid for, it is important for a firm to keep track of how much is
being tied up in these various assets and for how long. Excessive investments tend to be
wasteful. Therefore, the name of the game is to try and speed up collections and delay
payments (without penalty) so as to have optimal use of one’s funds. Accordingly, after
explaining the various components of a firm’s cash conversion cycle, the author discusses
various techniques and steps that firms can avail of to manage their cash, receivables, and
inventory. The chapter ends with a discussion of the importance of including working capital
changes within the capital budgeting decision process.
LECTURE OUTLINE
13.1 The Cash Conversion Cycle (Slides 13-3 to 13-12)
In order to manage working capital efficiently, a firm has to be aware of how long it takes them,
on average, to convert their goods and services into cash. This length of time is formally known
as the cash conversion cycle.
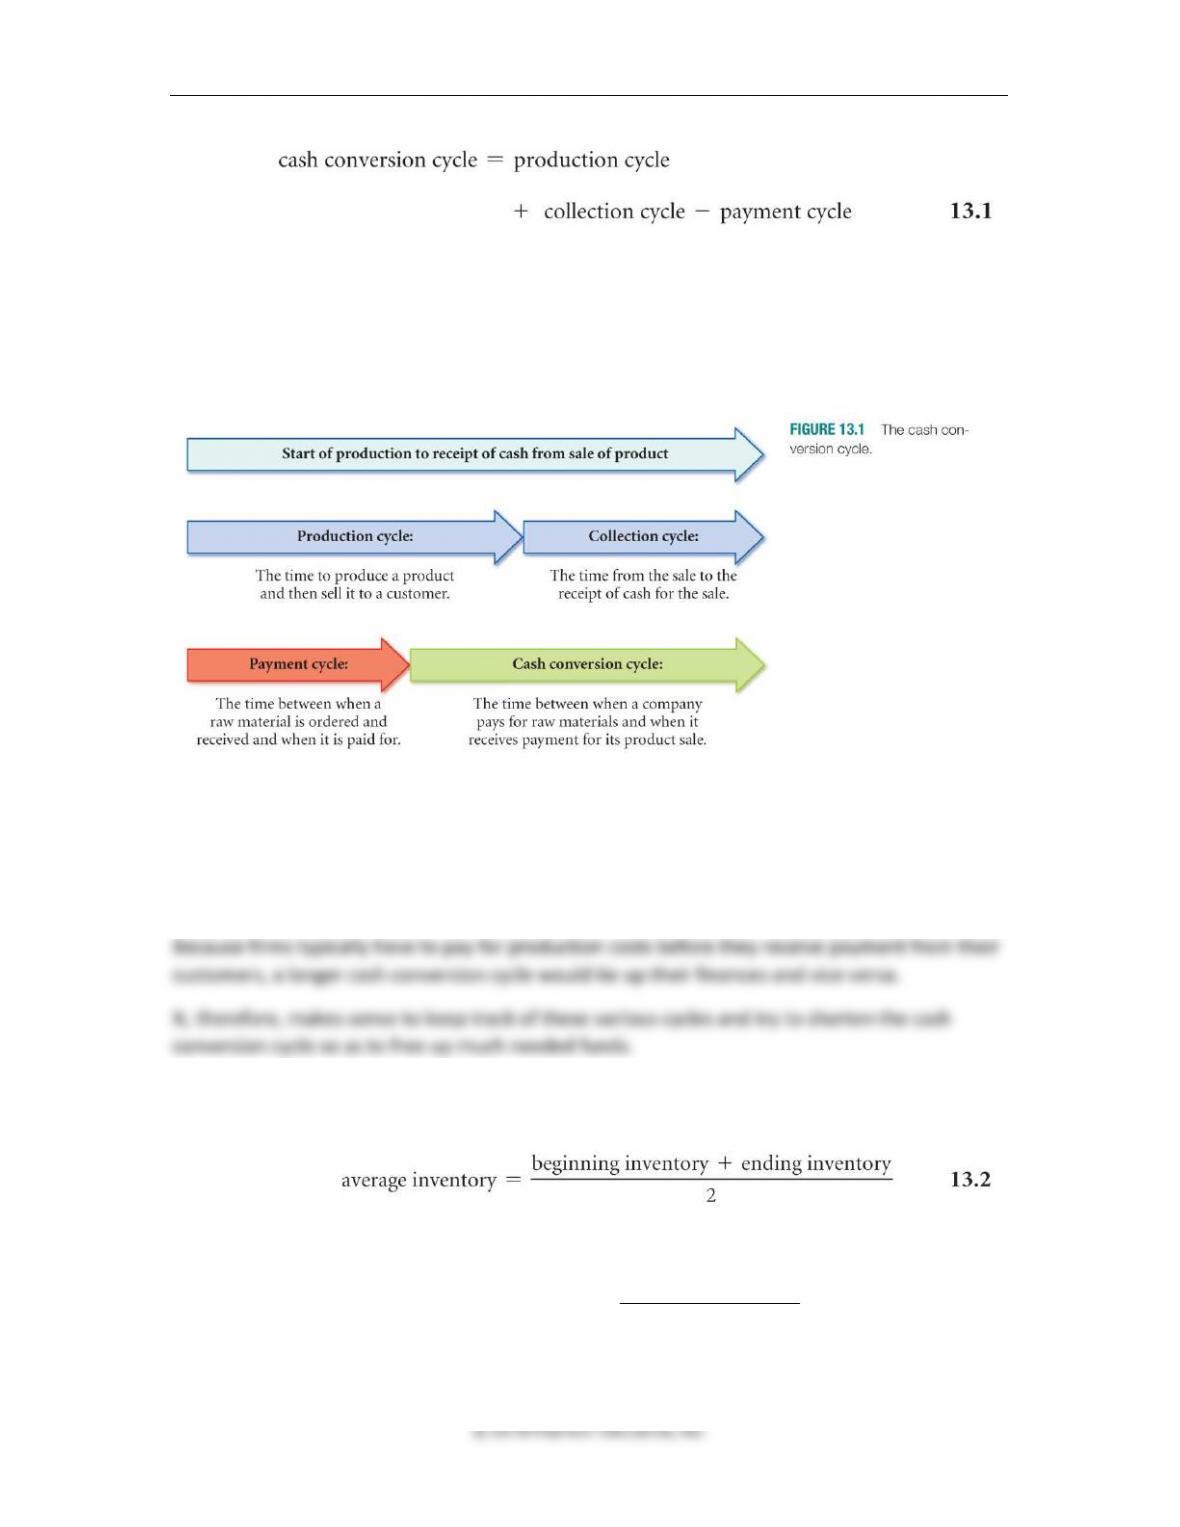
Equation 13.1 shows that the cash conversion cycle is made up of three separate cycles:
1. The production cycle: the time it takes to build and sell the product
2. The collection cycle: the time it takes to collect from customers (i.e., collecting accounts
receivable) and
3. The payment cycle: the time it takes to pay for supplies and labor (i.e., paying accounts
payable).
Chapter 13 ◼ Working Capital Management 423
The production cycle and the collection cycle together make up the operating cycle, so the cash
conversion cycle can also be calculated as follows:
Cash conversion cycle = Operating cycle – Payment cycle.
Figure 13.1 provides an excellent illustration of these various cycles.
The production cycle begins when a customer places an order and ends when the product is
shipped out. The collection cycle begins when the order is filled and ends when payment is
received. The payment cycle begins when labor is hired or raw materials are received to start
production and ends when the firm pays for purchases, raw materials, and other production
costs.
Average production cycle is calculated in three steps. First calculate average inventory as
shown in Equation 13.2
Next, calculate the inventory turnover rate as follows:
Cost of Goods sold
Inventory turnover rate Average Inventory
=
13.3
Lastly, calculate the average production cycle as follows:
424 Brooks ◼ Financial Management: Core Concepts, 4e
Production cycle = 365/ Inventory turnover rate 13.4
Average collection cycle makes up the other leg of the operations cycle. It measures the
number of days taken by a firm, on average, to collect its accounts receivables.
To measure it we first calculate the average accounts receivable:
Then we measure the accounts receivable turnover rate as follows:
Finally, we calculate the average collection cycle, i.e.
Average collection cycle = 365/A/R turnover rate.
Average payment cycle is also calculated with the same three steps, except that we use the
average accounts payable and accounts payable turnover to do it.
Chapter 13 ◼ Working Capital Management 425
Putting it all together: The Cash Conversion Cycle: When we add a firm’s production cycle
to its accounts receivable cycle and deduct the number of days in its payment cycle, we get the
cash conversion cycle, i.e., the number of days between when a firm incurs an outflow to start
production until it receives payment on a credit sale.
Example 1: Measuring the cash conversion cycle
Mark is has just been appointed as the chief financial officer of a mid-sized manufacturing
company and is keen to measure the firm’s cash conversion cycle, operating cycle, production
cycle, collection cycle, and payment cycle to see if any changes are warranted. He collects the
necessary information for the most recent fiscal year and puts together the following table:
Cash sales $200,000
Credit sales $600,000
Total sales $800,000
Cost of goods sold $640,000
Ending Balance Beginning Balance
Accounts receivable $40,000 $36,000
Inventory $10,000 $6,000
Accounts payable $ 9,000 $5,000
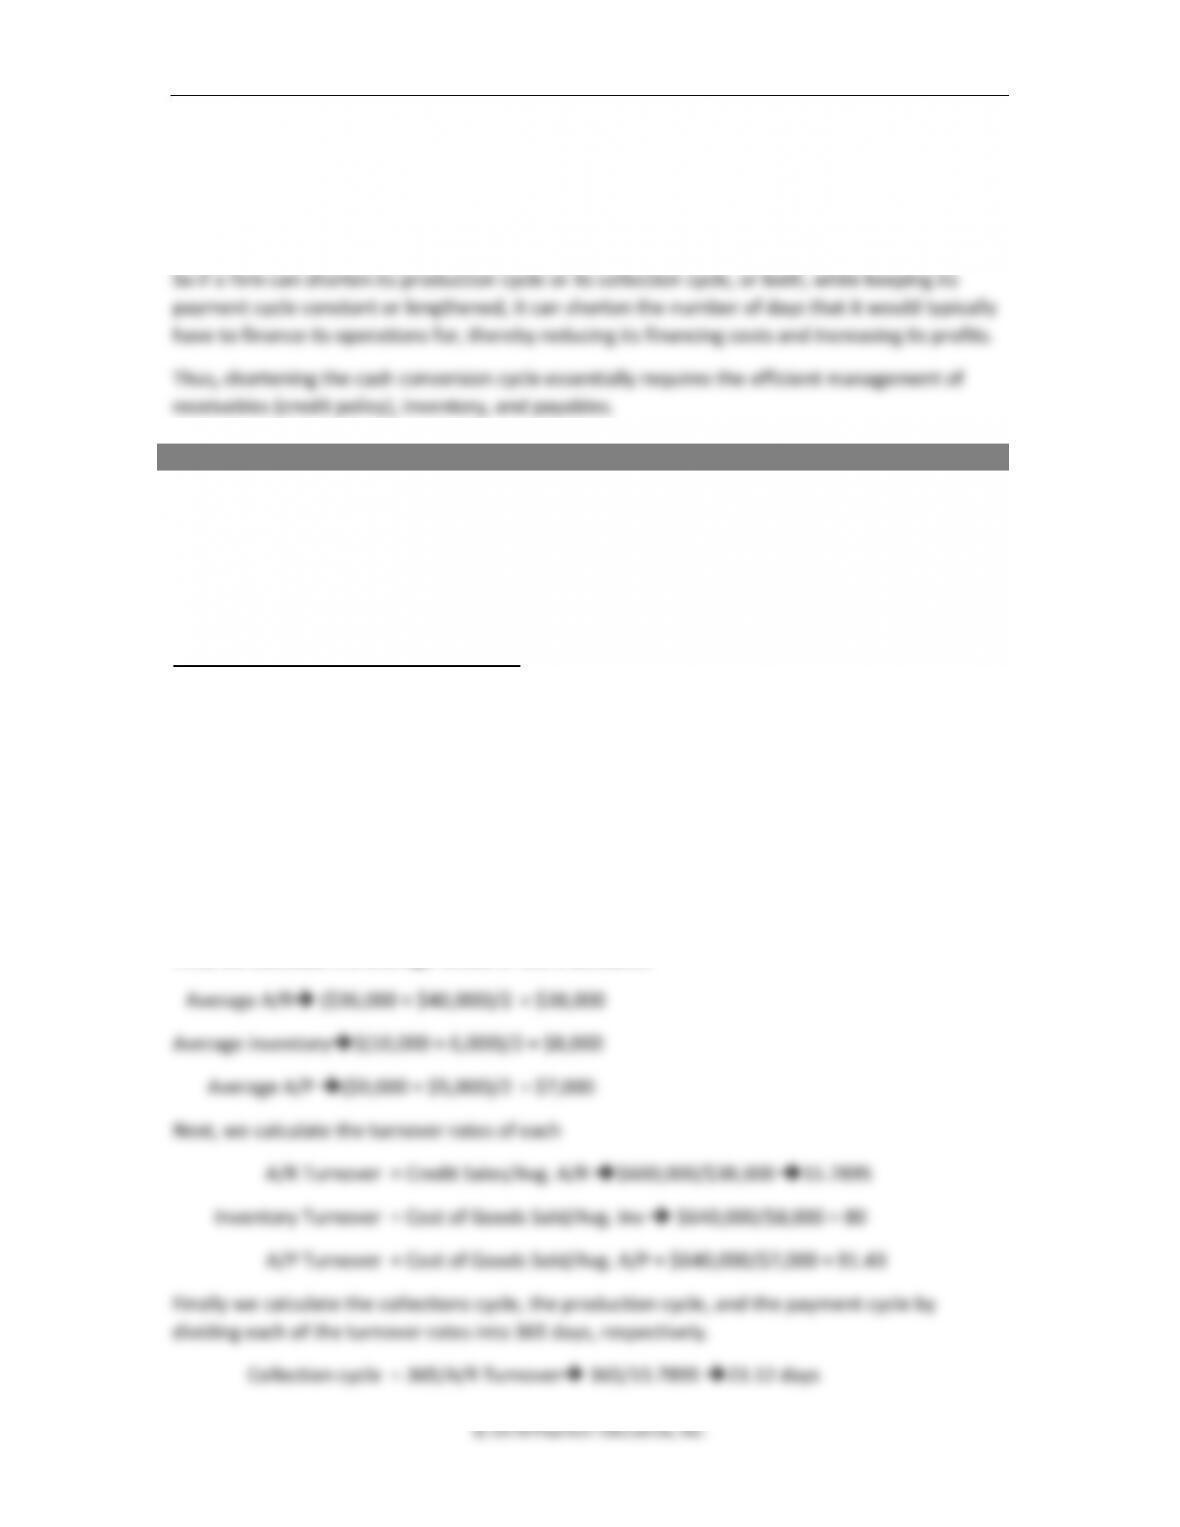
First, we calculate the average values of the 3 accounts:

426 Brooks ◼ Financial Management: Core Concepts, 4e
© 2018 Pearson Education, Inc.
Production cycle = 365/Inv. Turnover➔365/80➔4.56 days
Payment cycle = 365/A/P Turnover➔365/91.43➔3.99 days
So the firm’s operation cycle = Collection cycle + Production cycle = 23.12 + 4.56 = 27.68 days
Cash conversion cycle = Operating cycle – payment cycle = 27.68 – 3.99 ➔23.69 days. So on
average, the firm has to finance its credit sales for about 24 days.

428 Brooks ◼ Financial Management: Core Concepts, 4e
© 2018 Pearson Education, Inc.
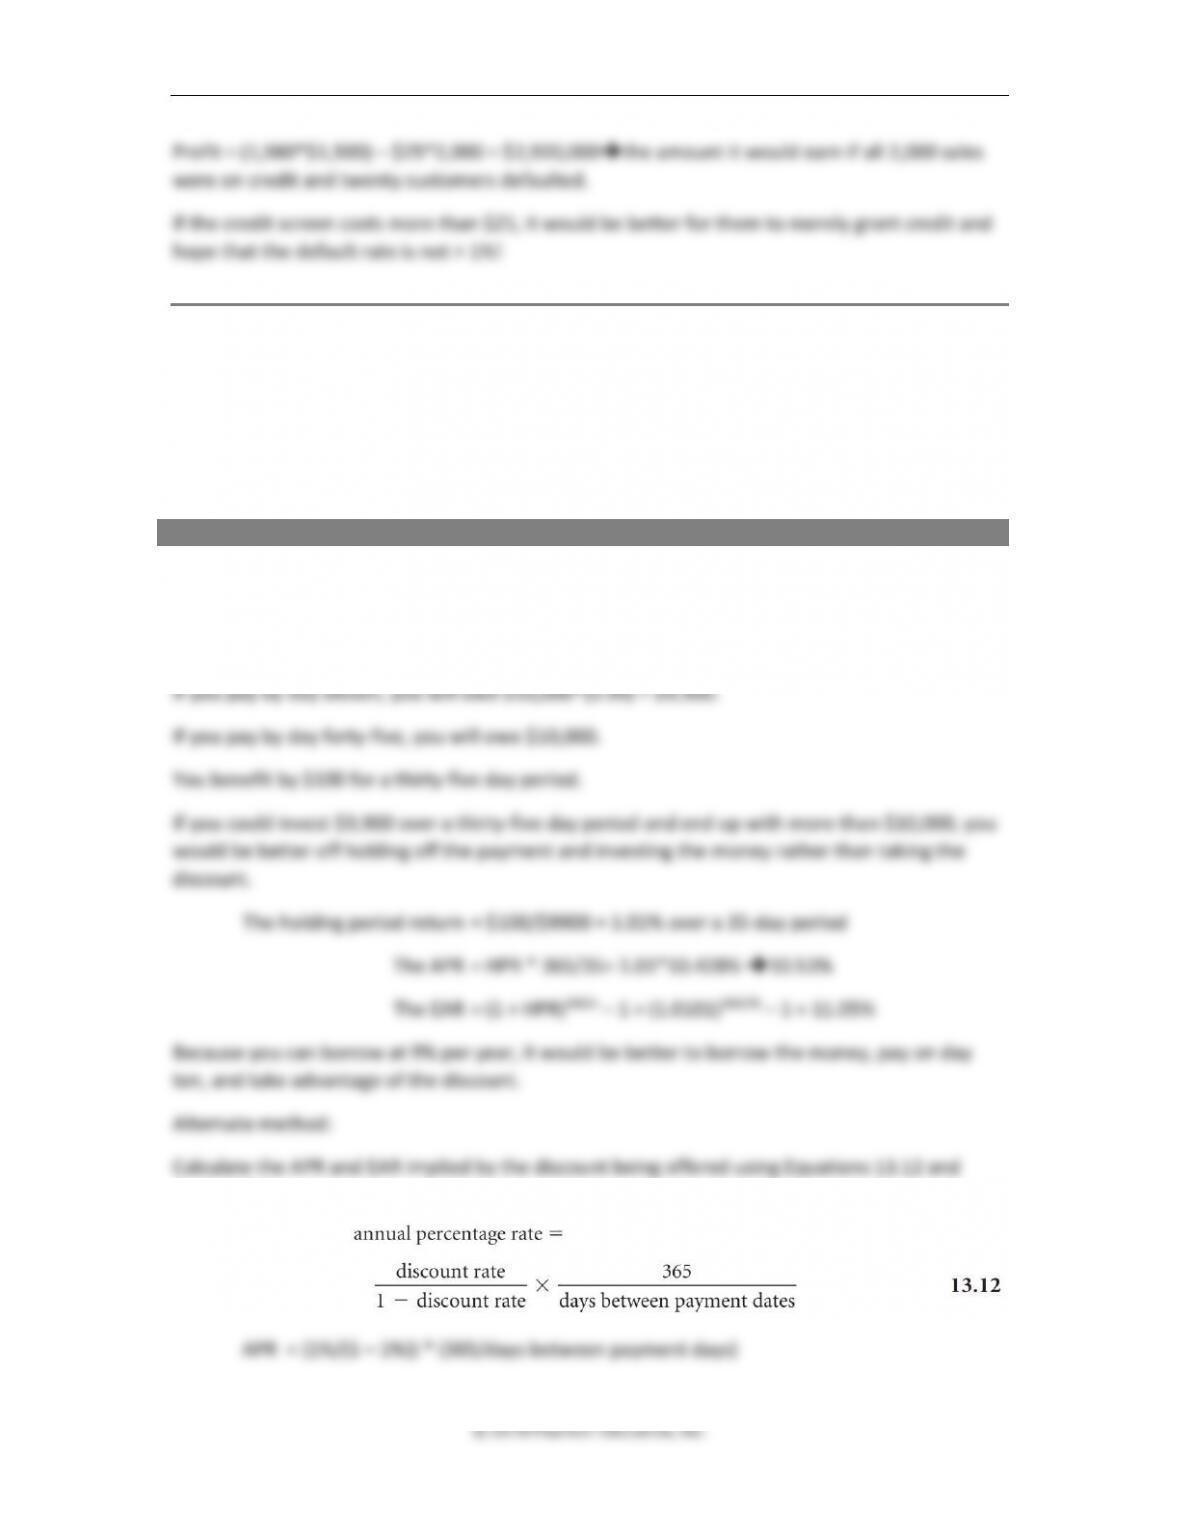
Profit = (1,980*$1,500) – $25*2,000 = $2,920,000➔the amount it would earn if all 2,000 sales
were on credit and twenty customers defaulted.
If the credit screen costs more than $25, it would be better for them to merely grant credit and
hope that the default rate is not > 1%!
Setting Payment Policy: An important part of credit policy is to determine how many days of
free credit to grant customers and whether or not to offer discounts for paying early, and if so,
how much of a discount?
Discounts, if high enough, tend to be mutually beneficial because the seller frees up cash and
the buyer pays less.
Example 3: Cost of forgoing cash discounts
Let’s say that a firm grants it customers credit on terms of 1/10, net 45. You are one of the
customers and have an invoice due of $10,000. You have a line of credit with your bank that is at
the rate of 9% per year on outstanding balances. Should you avail of the discount and pay on
day 11 or wait until the forty-fifth day and make the full $10,000 payment?
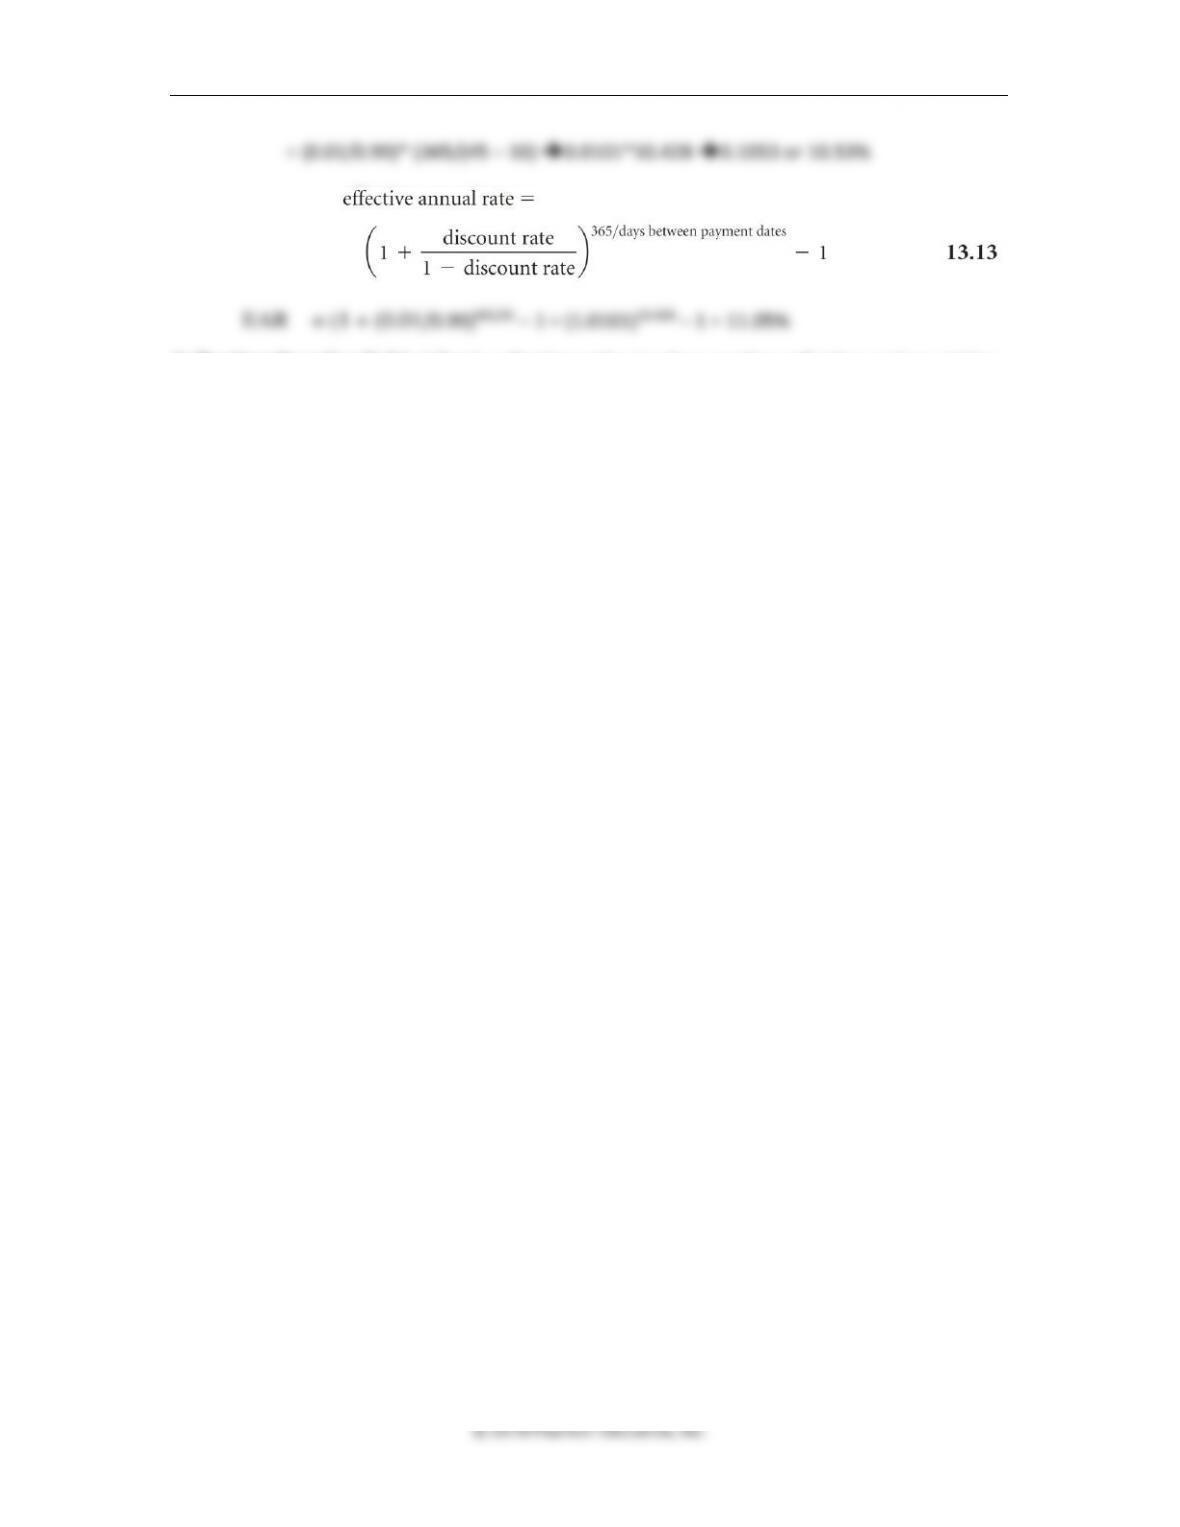
13.13 as follows:
Chapter 13 ◼ Working Capital Management 429
© 2018 Pearson Education, Inc.
= (0.01/0.99)* (365/(45 – 10) ➔0.0101*10.428 ➔0.1053 or 10.53%
Collecting Overdue Debt: A firm’s collection policy involves sending collection notices, taking
court action, and eventually writing off bad debts. The cost to the firm escalates at each step.
Firms should carefully establish and monitor their credit policy involving screening, payment
terms, and collection procedures so as to maximize benefits while minimizing costs.
13.3 The Float (Slides 13-25 to 13-28)
“Float,” which refers to the time it takes for a check to clear, is of two types.
Disbursement float is the time lag between when a buyer writes a check to when the money
leaves his or her account.
Collection float is the time lag between when a seller deposits the check to when the funds are
received in the account.
Note: The collection float is part of the disbursement float, so if the seller or his bank can speed
up collection, it will automatically shorten the disbursement float.
Speeding up the Collection (Shortening the Lag Time): Firms attempt to speed up
collections in a variety of ways including:
• Lock boxes are post office boxes set up at convenient locations to allow for quick pick
up and deposit of checks by the firm’s bank.
• Electronic fund transfers (EFT) occur directly from the buyer’s account, for example by
accepting debit cards.
Extending the Disbursement Float (Lengthening the Lag Time): This option is getting
more difficult with the advent of Check 21 (electronic clearing of checks between banks) and
acceptance of debit cards. One method that continues to be popular, though, is the widespread
use of credit cards, which allows for a month-long float.
13.4 Inventory Management:
Carrying Costs and Ordering Costs (Slides 13-29 to 13-43)
Managing inventory essentially involves the balancing of carrying costs (i.e., storage costs,
handling costs, financing costs, and costs due to spoilage and obsolescence) against ordering
costs (i.e., delivery charges), which tend to offset each other.
Keeping carrying costs down requires more frequent orders of smaller sizes, but it could result in
lost sales due to stock-outs.
430 Brooks ◼ Financial Management: Core Concepts, 4e
Fewer, larger orders lower ordering costs but require carrying larger amounts of inventory.
There are four cost-minimizing methods that firms can use to manage inventories efficiently:
The ABC inventory management model; stocking redundant inventory; the economic order
quantity method; and the just-in-time approach.
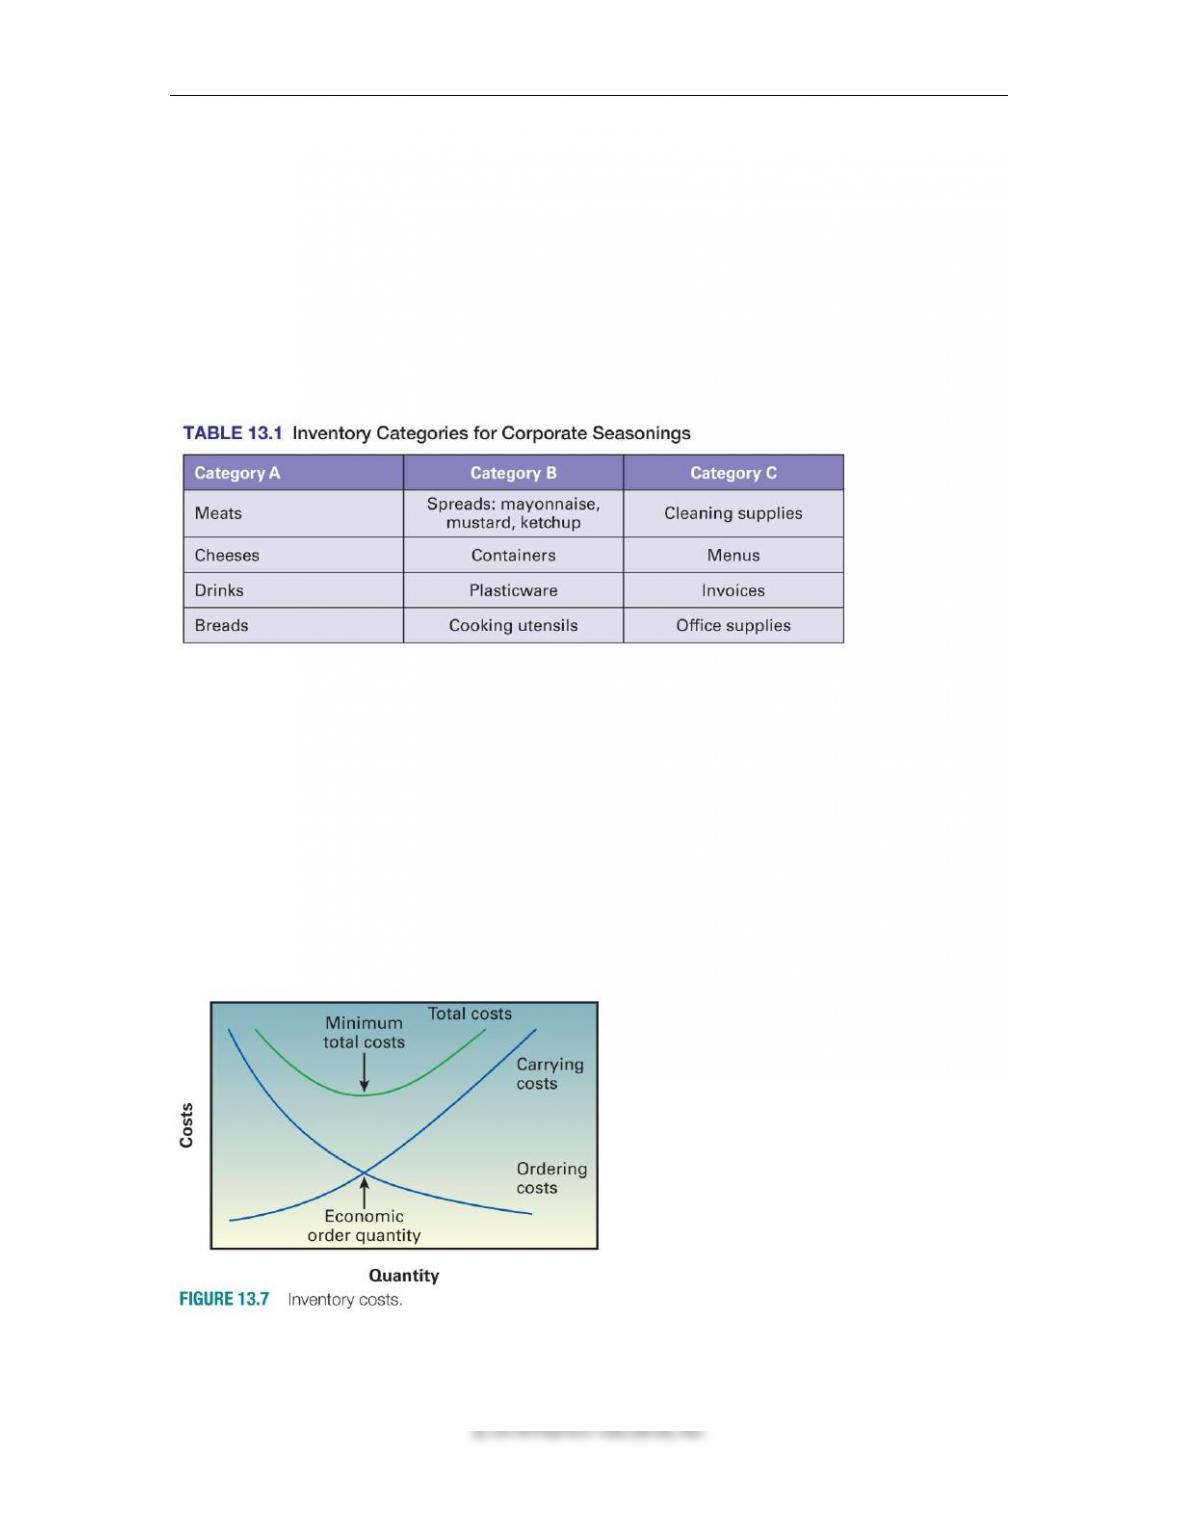
ABC inventory management involves categorizing inventory into three types: Large dollar or
critical items (A-type); moderate dollar or essential items (B-type), and small-dollar or
nonessential items (C-type) as shown in Table 13.1.
Each type is monitored differently with respect to the frequency of taking stock and reordering.
Redundant inventory items required maintaining back-up inventory of items that are
currently not needed frequently, but could be used in emergencies and are needed to avoid
higher costs due to stoppages.
Economic order quantity is a method to determine the optimal size of each order by
balancing ordering costs with carrying costs so as to minimize the total cost of inventory.
The trade-off between ordering costs and carrying costs occurs because with larger order
sizes, fewer orders are needed, reducing delivery costs, and the costs resulting from lost sales
due to shortages. However, higher levels of inventory are held, thereby increasing costs
associated with storage, handling, spoilage, and obsolescence. Figure 13.7 illustrates this trade–
off.
Chapter 13 ◼ Working Capital Management 431
Measuring ordering costs involves multiplying the number of orders placed per period by the
cost of each order and delivery, as shown in Equation 13.14
Where OC = cost per order, S = annual sales, and Q = order size.
Example 4: Measuring ordering cost
Nigel Enterprises sells 1,000,000 copies per year. Each order it places costs $40 for shipping and
handling. How will the total annual ordering cost change if the order size changes from 1,000
copies per order to 10000 copies per order?
At 1,000 copies per order:
Measuring carrying cost involves multiplying the carrying cost by the half the order quantity
as shown in Equation 13.15 below:
The model assumes that inventory is used up at a constant rate each period so when it is at its
half way point, a new order is received, meaning that on average we are holding about half the
inventory each period.
432 Brooks ◼ Financial Management: Core Concepts, 4e
Example 5: Measuring carrying cost
Nigel Enterprises has determined that it costs them $0.10 to hold one copy in inventory each
period. How much will the total carrying cost amount to with 1,000 copies versus 10,000 copies
being held in inventory.
To arrive at the optimal order quantity, we can use Equation 13.17,
Example 6: Calculating EOQ
With annual sales of 1,000,000 copies, carrying costs amounting to $0.10 per copy held and
order costs amounting to $40 per order. What is Nigel Enterprises’ optimal order size? Please
verify that your answer is correct.
Verification:

Chapter 13 ◼ Working Capital Management 433
Reorder Point and Safety Stock: Because inventory gets used up every day, and there is a
lead time necessary to have additional supplies delivered, firms must determine a reorder point
such that they don’t have a stock-out.
The reorder point = daily usage * days of lead time
Once the inventory hits the reorder point, the next order is placed so that by time it is delivered,
the firm would be just about out of inventory.
An additional protection measure is to build in some safety stock or buffer so as to be covered in
case of delivery delays as follows:
Average inventory = EOQ/2 + safety stock 13.18
434 Brooks ◼ Financial Management: Core Concepts, 4e
Example 7: Measuring reorder point and safety stock
Calculate Nigel Enterprises’ Reorder point and safety stock assuming that deliveries take 4 days
on average with a possibility of 2 day delays sometimes.
Just in time is an inventory management system that tries to keep inventory at a minimum by
following lean manufacturing practices, i.e., producing only what is required, when it is required,
and keeping finished goods in storage for as little time as possible. JIT inventory management, if
practiced successfully, would eliminate waste and improve productivity significantly.
13.5 The Effect of Working
Capital on Capital Budgeting (Slide 13-44)
Inventories and Daily Operations: When doing capital budgeting, as was explained earlier, we
must take into account the initial investment required for working capital, i.e., inventory and
accounts receivable, as part of cash outflow at time 0. Moreover, if working capital fluctuates
significantly each period, it must be taken into account, and at the end of the productive life of
the project, it should be included as a cash inflow, to reflect the fact that the firm will be
drawing down on the inventory and collecting the receivables, which already have been
included as part of the cash outflow.
Questions
1. Explain the three components of the cash conversion cycle.
The three components of the cash conversion cycle are the production cycle, the collection
2. Why should a company attempt to speed up its receivables and slow down its payables?


© 2018 Pearson Education, Inc.
© 2018 Pearson Education, Inc.
2. Business operating cycle. Stewart and Company currently has a production cycle of forty
days, a collection cycle of twenty days, and a payment cycle of fifteen days. What are
Stewart’s current business operating cycle and cash conversion cycle? If Stewart and
Company wants to reduce its cash conversion cycle to thirty-five days what action can it
take?
ANSWER
Options on reducing the cash conversion cycle to thirty-five days:
1) reduce production cycle by ten days
Use the following account information for Problems 3 through 8.