Chapter 12 ◼ Forecasting and Short-Term Financial Planning 427
April
May
June
July
August
September
Collections from
Direct Rentals
$90,000
$90,000
$60,000
$45,000
$30,000
$94,500
Contract Rental
Payments
75,000
78,750
Damage
Assessments
0
0
7,500
5,000
5,000
2,500
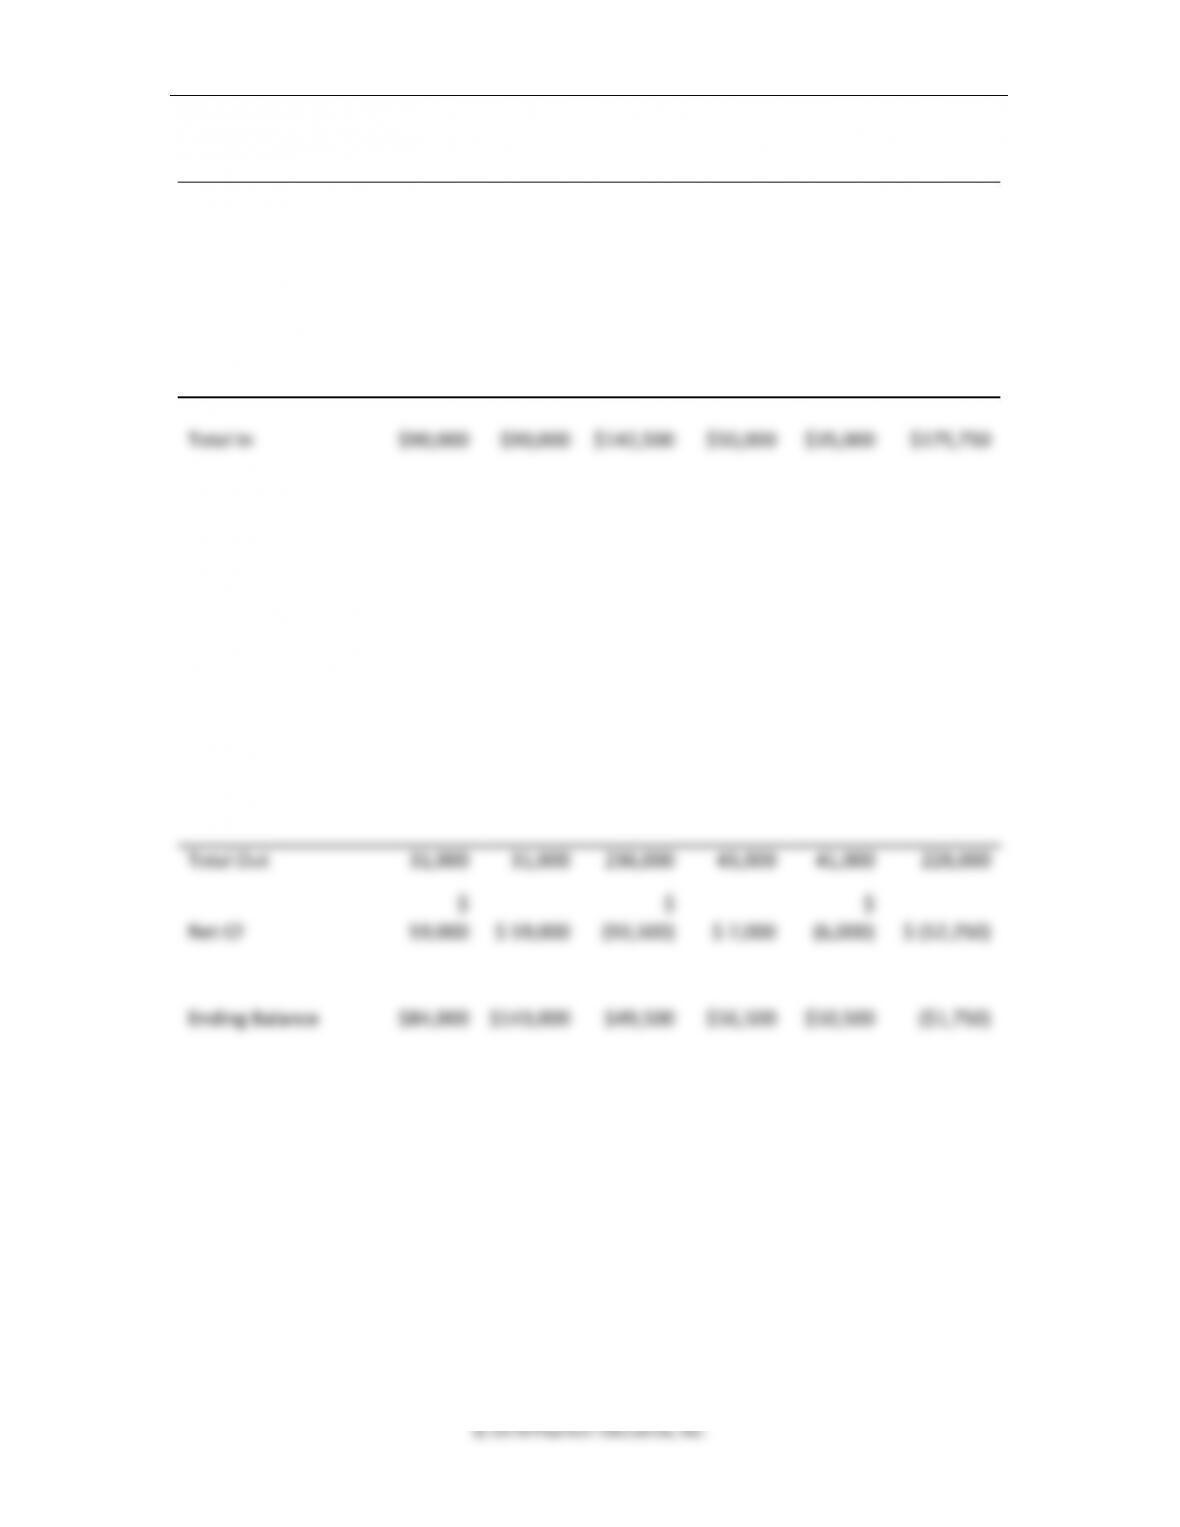
Total In
$90,000
$90,000
$142,500
$50,000
$35,000
$175,750
Outgoing
Supplies, Materials
5,000
5,000
5,000
15,000
15,000
15,000
Salaries
8,000
8,000
8,000
8,000
8,000
8,000
Labor
2,000
2,000
10,000
10,000
10,000
2,000
Payments for
Utilities
16,000
16,000
16,000
10,000
8,000
6,000
Payment on debt
150,000
150,000
Property Taxes
31,500
31,500
Insurance
15,500
15,500
Total Out
31,000
31,000
236,000
43,000
41,000
228,000
Net CF
$
59,000
$ 59,000
$
(93,500)
$ 7,000
$
(6,000)
$ (52,250)
Ending Balance
$84,000
$143,000
$49,500
$56,500
$50,500
($1,750)
428 Brooks ◼ Financial Management: Core Concepts, 4e
4. Your monthly cash flow estimate should show a small cash shortage at the end of
September. Is this shortage a cause for concern? Based on Midwest’s collection and
payment patterns, would you expect a cash deficit or surplus by the end of October? No
calculations are required, but briefly explain your prediction.
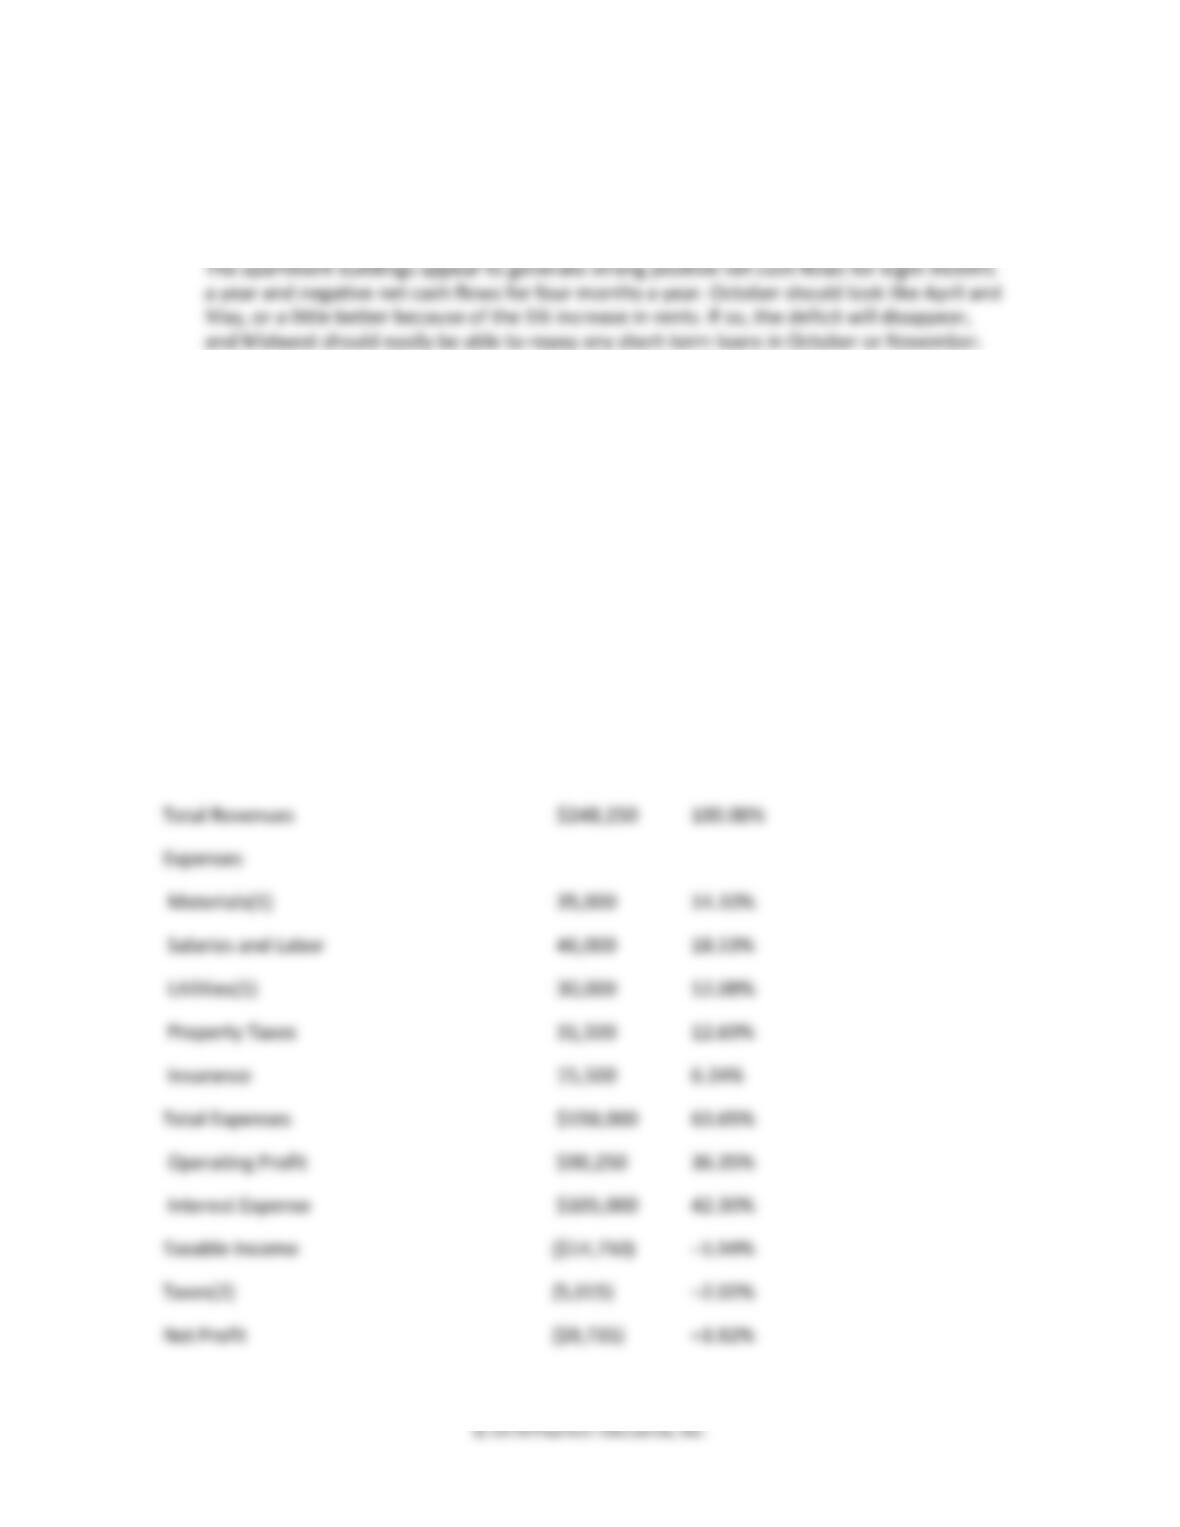
5. Construct a pro forma income statement for the properties managed by Dennis for the
third quarter (July, August, and September). Use Figure 12.4 as a model. Show dollar
amounts and percentages of revenues. September’s expenses include $5,000 for supplies
and materials and $16,000 for utilities. The payment on debt includes $105,000 in interest,
and $45,000 toward retirement of the principal. Midwest’s tax rate is 34%. Remember
that the income statement is based on accrual rather than cash flow principles.
Midwest Properties
Income Statement
Quarter Ending September 30 200X
Revenues
Amount
Percentage
Direct Rental
$169,500
68.28%
Contract Rentals
$78,750
31.72%
Total Revenues
$248,250
100.00%
Expenses
Materials(1)
35,000
14.10%
Salaries and Labor
46,000
18.53%
Utilities(1)
30,000
12.08%
Property Taxes
31,500
12.69%
Insurance
15,500
6.24%
Total Expenses
$158,000
63.65%
Operating Profit
$90,250
36.35%
Interest Expense
$105,000
42.30%
Taxable Income
($14,750)
–5.94%
Taxes(2)
(5,015)
–2.02%
Net Profit
($9,735)
–3.92%
430 Brooks ◼ Financial Management: Core Concepts, 4e
Additional Problems with Solutions
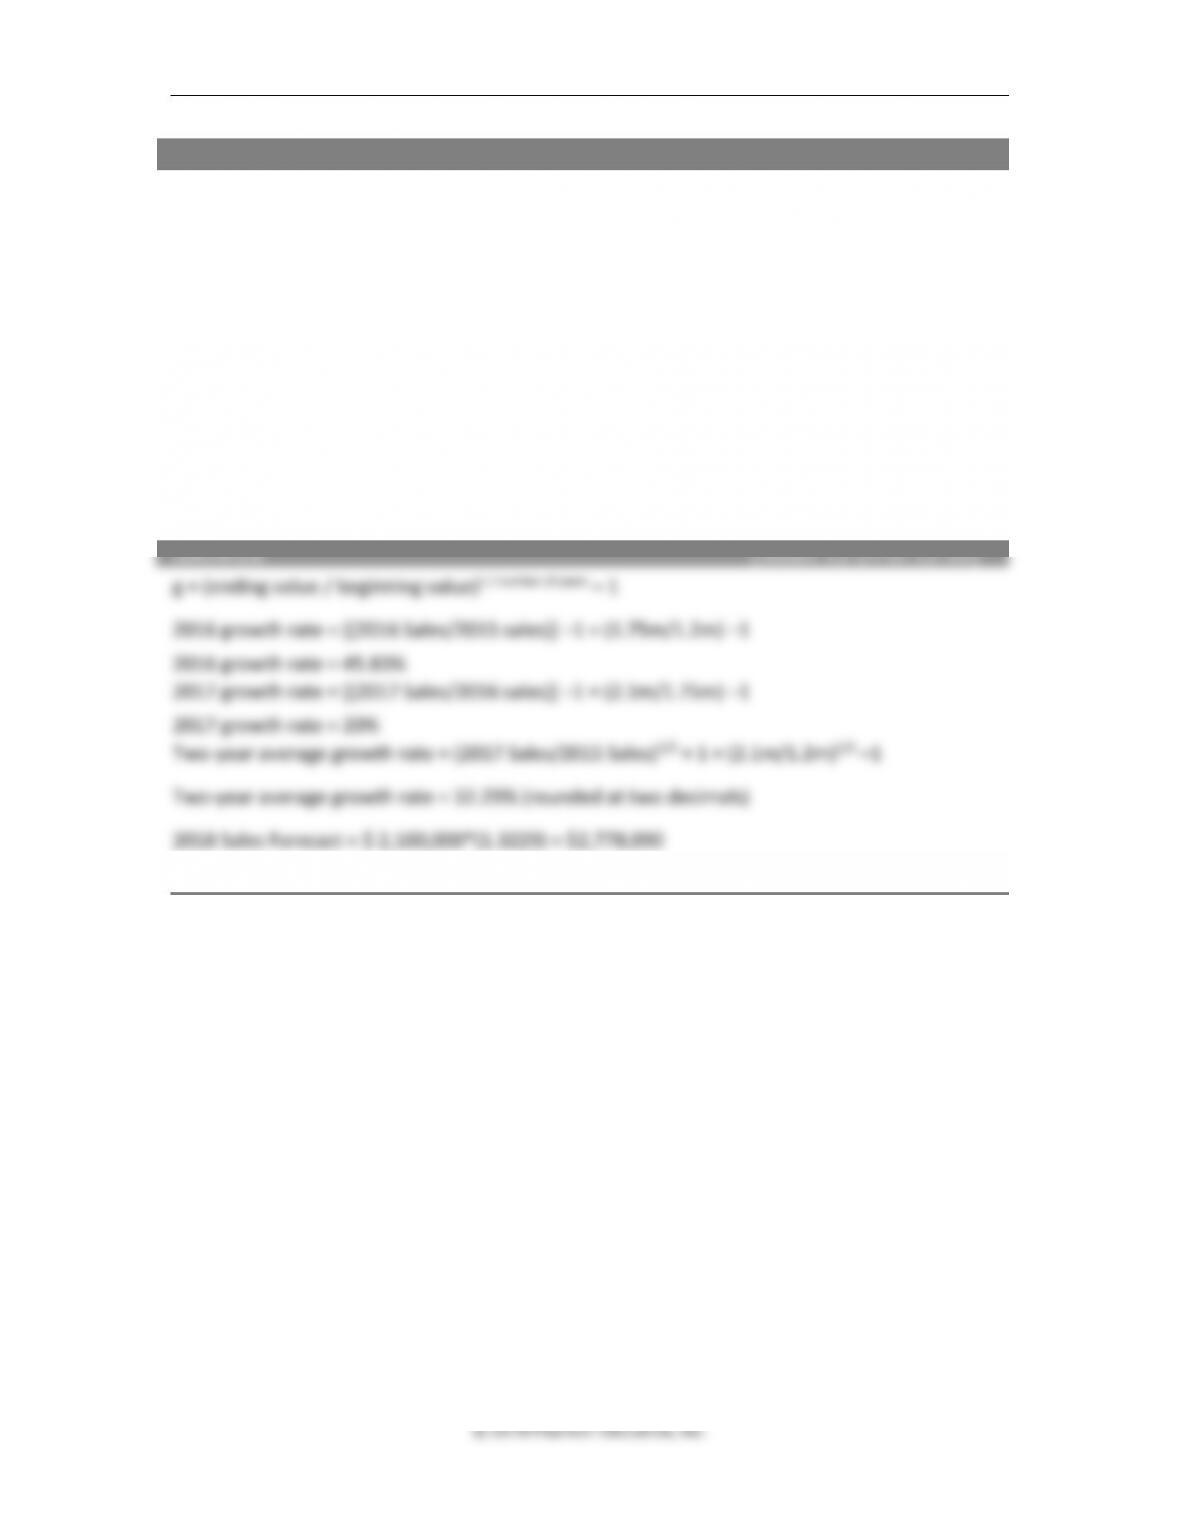
1. Sales forecast. You have been asked to forecast sales for the coming year. Being convinced
that the compound average growth rate is the best way to forecast growth, you collect data
for the prior three years, as listed below. Using the data, compute the compound growth
rate for each of the years and then forecast next year’s sales by using the two-year average
growth rate (round off the growth rate to two decimal places).
Year Sales
2015 $1,200,000
2016 $1,750,000
2017 $2,100,000
2018 ?
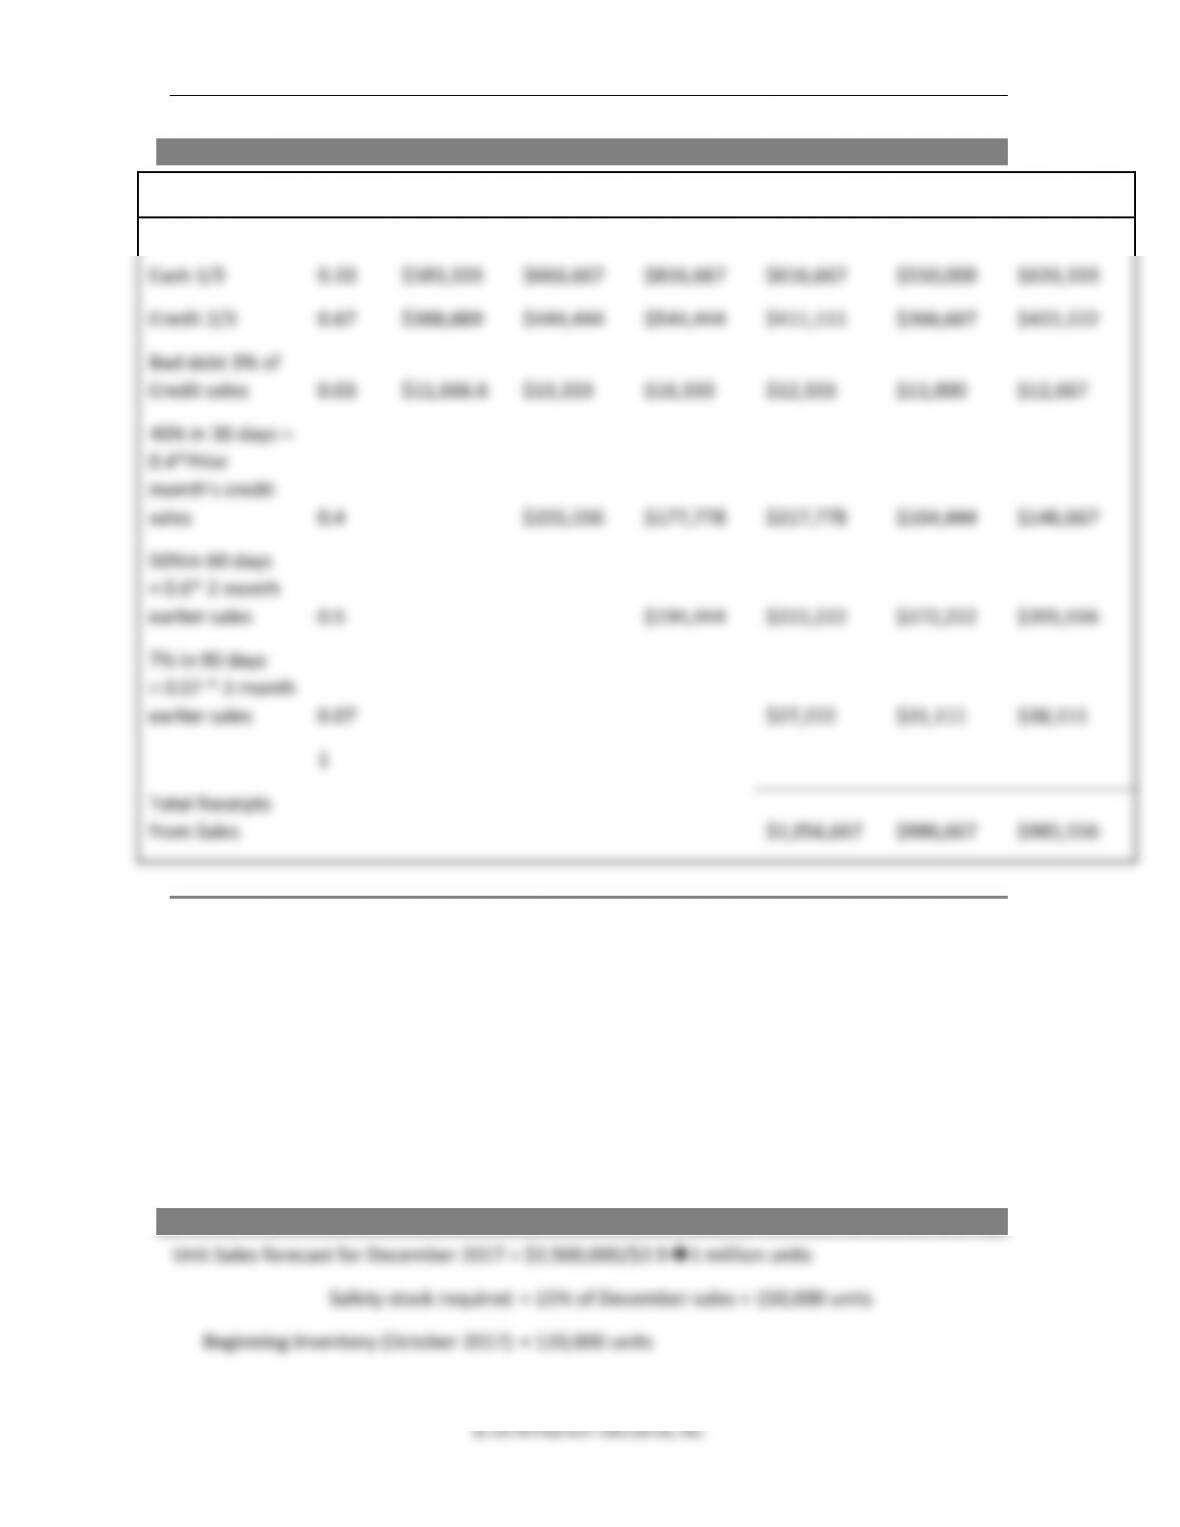
2. Sales receipts. The financial manager of Hearty Cereals is in the process of preparing a cash
budget for the first quarter of 2018. The firm typically sells one third of its monthly sales on
cash terms and the rest on credit. An analysis of the accounts receivables shows that on
average 40% of the sales are collected in the next month, 50% in sixty days, 7% in ninety
days, with the rest ending up as bad debts. As the manager’s assistant, it is your job to
project the sales receipts for the first quarter of 2015, using the monthly sales figures listed
below.
2017 Sales
October $1,750,000
November $2,000,000
December $2,450,000
2018 Forecasted Sales
January $1,850,000

Chapter 12 ◼ Forecasting and Short-Term Financial Planning 431
February $1,650,000
March $1,900,000
432 Brooks ◼ Financial Management: Core Concepts, 4e
ANSWER (Slides 12-31 to 12-32)
Oct
Nov
Dec
Jan
Feb
March
1,750,000
2,000,000
2,450,000
1,850,000
1,650,000
1,900,000
Cash 1/3
0.33
$583,333
$666,667
$816,667
$616,667
$550,000
$633,333
Credit 2/3
0.67
$388,889
$444,444
$544,444
$411,111
$366,667
$422,222
Bad debt 3% of
Credit sales
0.03
$11,666.6
$13,333
$16,333
$12,333
$11,000
$12,667
40% in 30 days =
0.4*Prior
month’s credit
sales
0.4
$155,556
$177,778
$217,778
$164,444
$146,667
50%in 60 days
= 0.6* 2 month
earlier sales
0.5
$194,444
$222,222
$272,222
$205,556
7% in 90 days
= 0.07 * 3 month
earlier sales
0.07
$27,222
$31,111
$38,111
1
Total Receipts
from Sales
$1,056,667
$986,667
$985,556
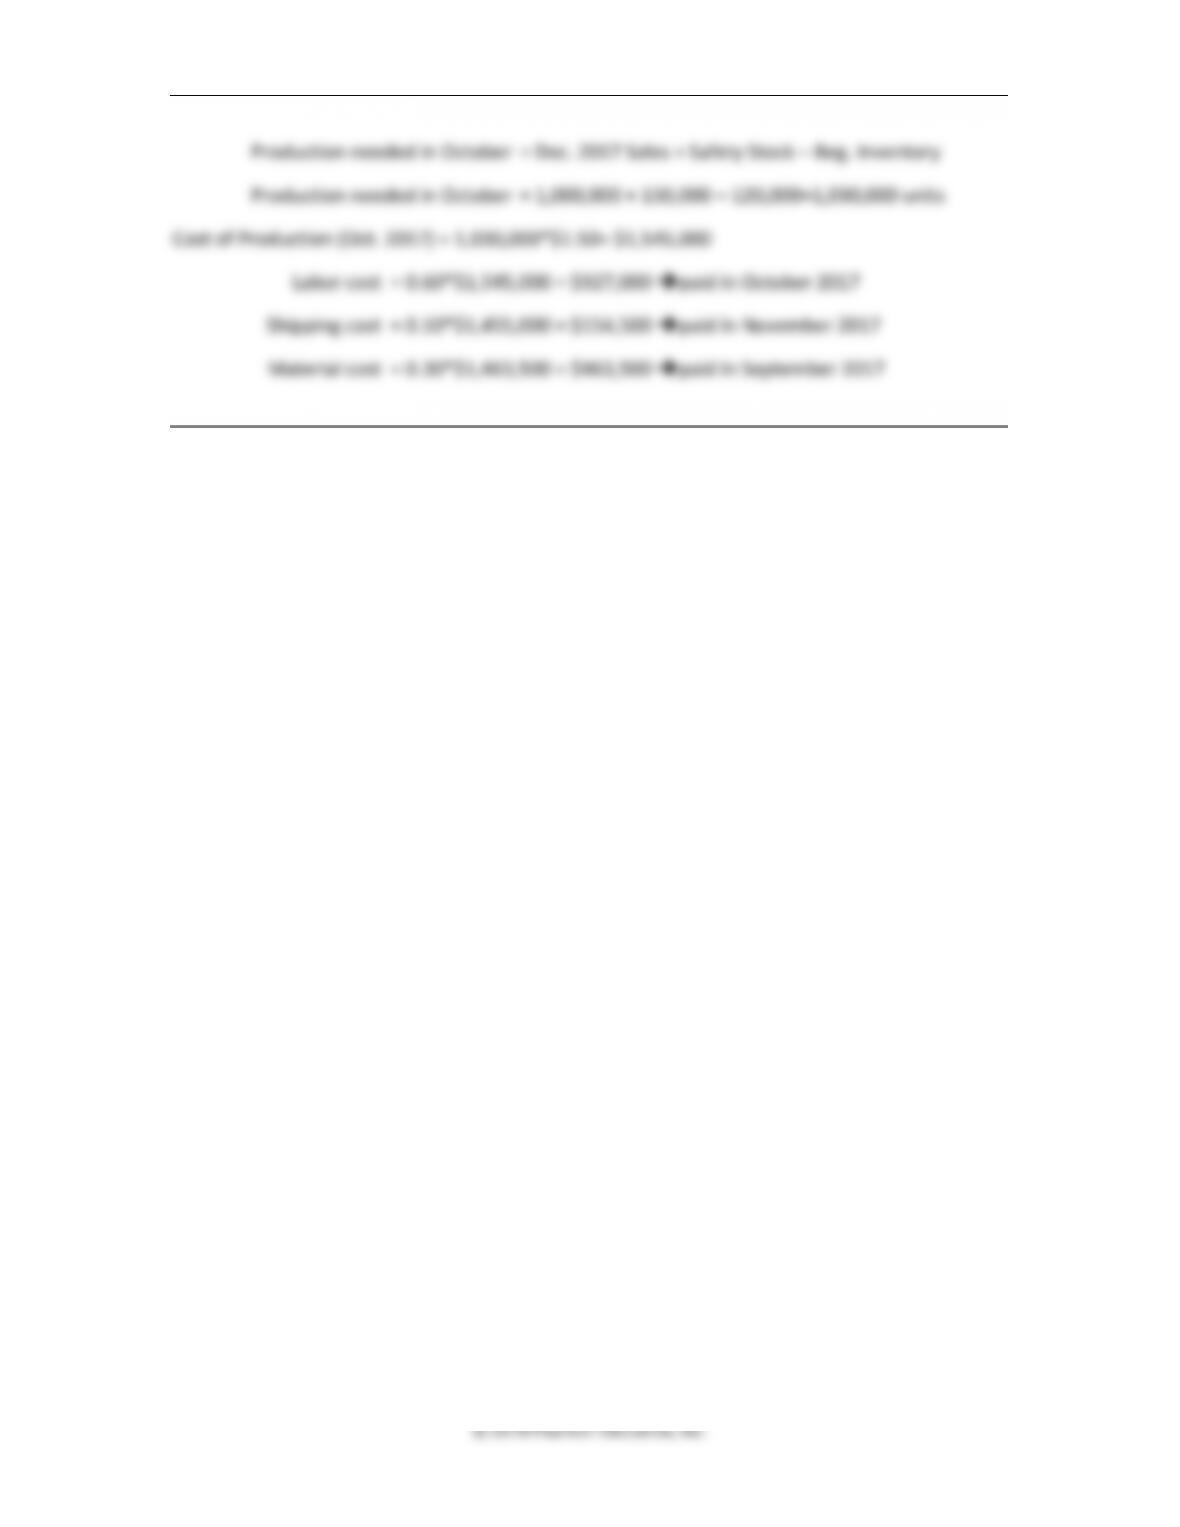
3. Production cash outflow. The Creative Products Corporation produces its products two
months in advance of anticipated sales and ships to warehouse centers the month before
sale. The inventory safety stock is 15% of the anticipated month’s sale. Beginning inventory
in October 2017 was 120,000 units. Each unit costs $1.50 to make. The average selling price
is $2.50 per unit. The cost is made up of 60% labor, 30% materials, and 10% shipping (to
warehouse). Labor is paid the month of production, shipping the month after production,
and raw materials the month prior to production. What is the production cash outflow for
the month of October 2017 production, and in what months does it occur? Assume that the
sales forecast for December 2017 is $2,500,000
ANSWER (Slides 12-33 to 12-34)
Chapter 12 ◼ Forecasting and Short-Term Financial Planning 433
© 2018 Pearson Education, Inc.
Production needed in October = Dec. 2017 Sales + Safety Stock – Beg. Inventory
Production needed in October = 1,000,000 + 150,000 – 120,000=1,030,000 units
Cost of Production (Oct. 2017) = 1,030,000*$1.50= $1,545,000
Labor cost = 0.60*$1,545,000 = $927,000 ➔paid in October 2017
Shipping cost = 0.10*$1,455,000 = $154,500 ➔paid in November 2017
Material cost = 0.30*$1,463,500 = $463,500 ➔paid in September 2017
Chapter 12 ◼ Forecasting and Short-Term Financial Planning 435
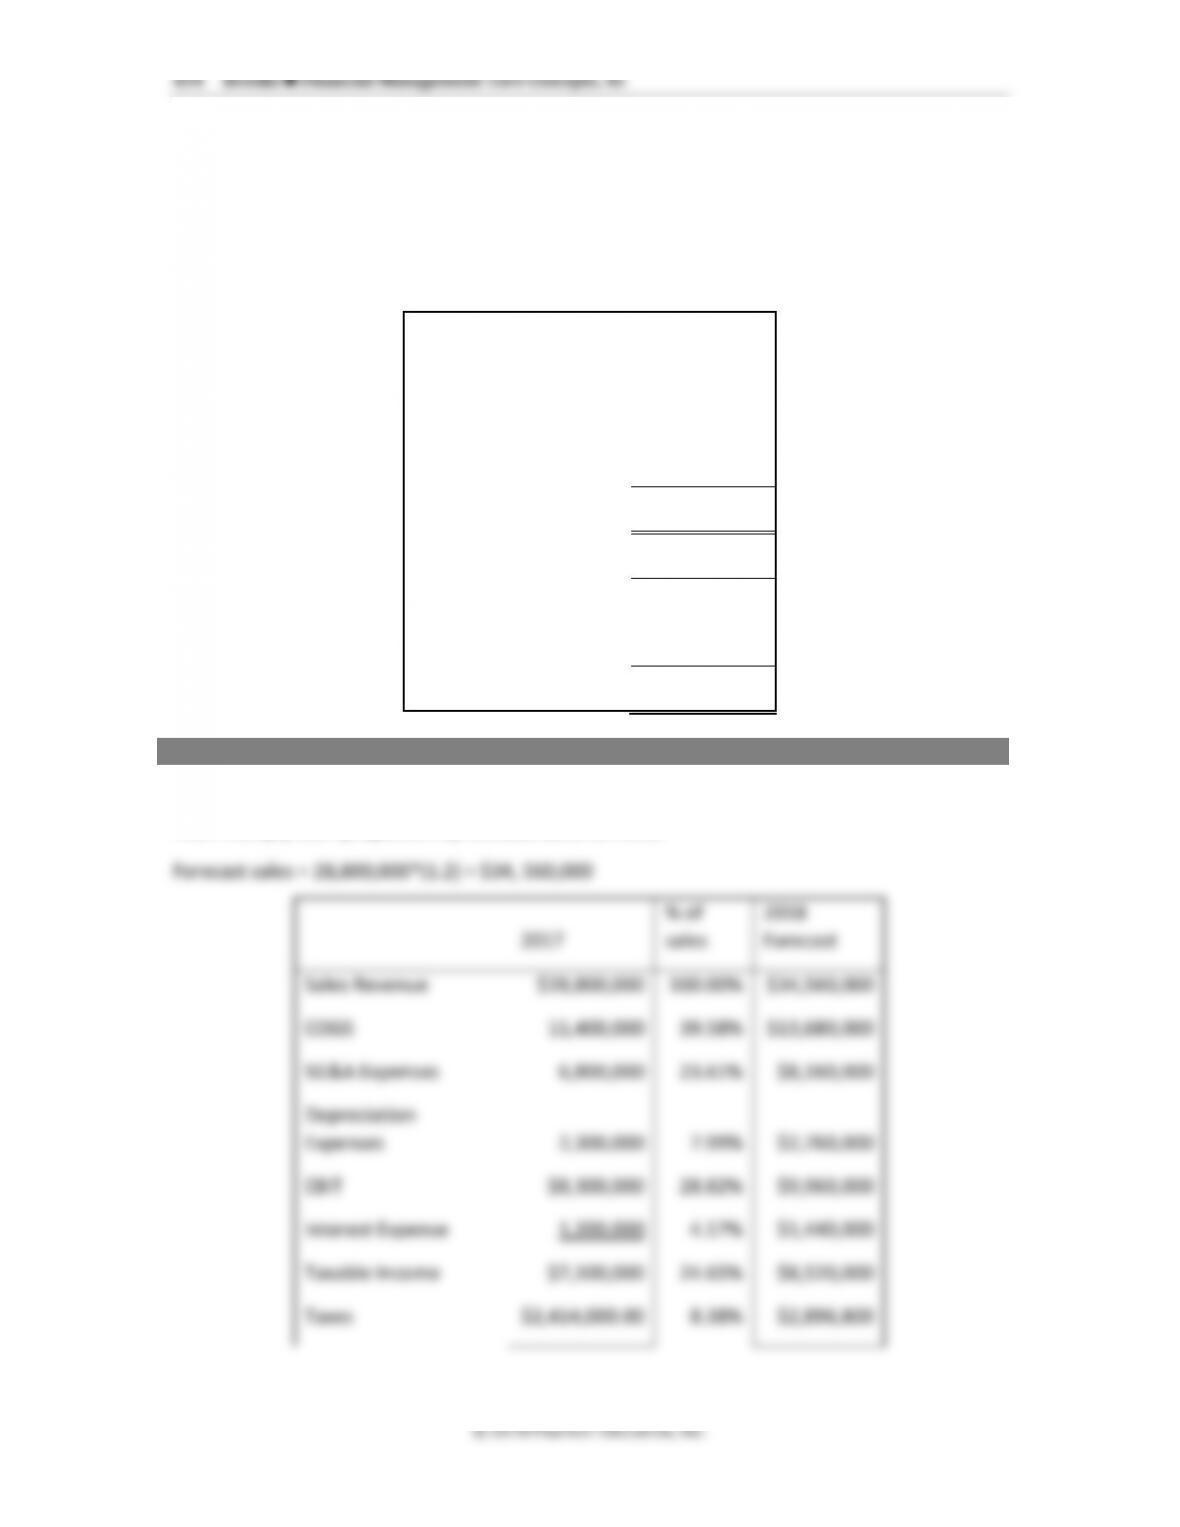
Net Income
$4,686,000.00
16.27%
$5,623,200
5. Pro forma balance sheet. The Global Growth Corporation is planning for next year and
wants you to help them prepare a pro forma balance sheet for 2018. Their current balance
sheet is shown below along with some predetermined changes in key balance sheet
accounts. How will you proceed?
The Global Growth Corporation
Balance Sheet for the Year Ending 2017
Current Assets
2017
Cash
$1,500,000
Marketable Securities
830,000
Accounts Receivable
3,450,000
Inventories
2,500,000
Total Current Assets
$8,280,000
Long-term Assets
Plant, Property & Equip.
$8,500,000
Goodwill
3,500,000
Intangible Assets
1,350,000
Total Long-term Assets
$13,350,000
TOTAL ASSETS
$21,630,000
Current Liabilities
Accounts Payable
$5,125,000
Other Current Liabilities
$1,350,000
Total Current Liabilities
$6,475,000
Long-term Liabilities
436 Brooks ◼ Financial Management: Core Concepts, 4e
Long-Term Debt
$3,200,000
Other Long-term Liabilities
$1,650,000
Total Long-Term Liabilities
$4,850,000
TOTAL LIABILITIES
$11,325,000
Owner’s Equity
Common Stock
$2,500,000
Retained Earnings
$7,805,000
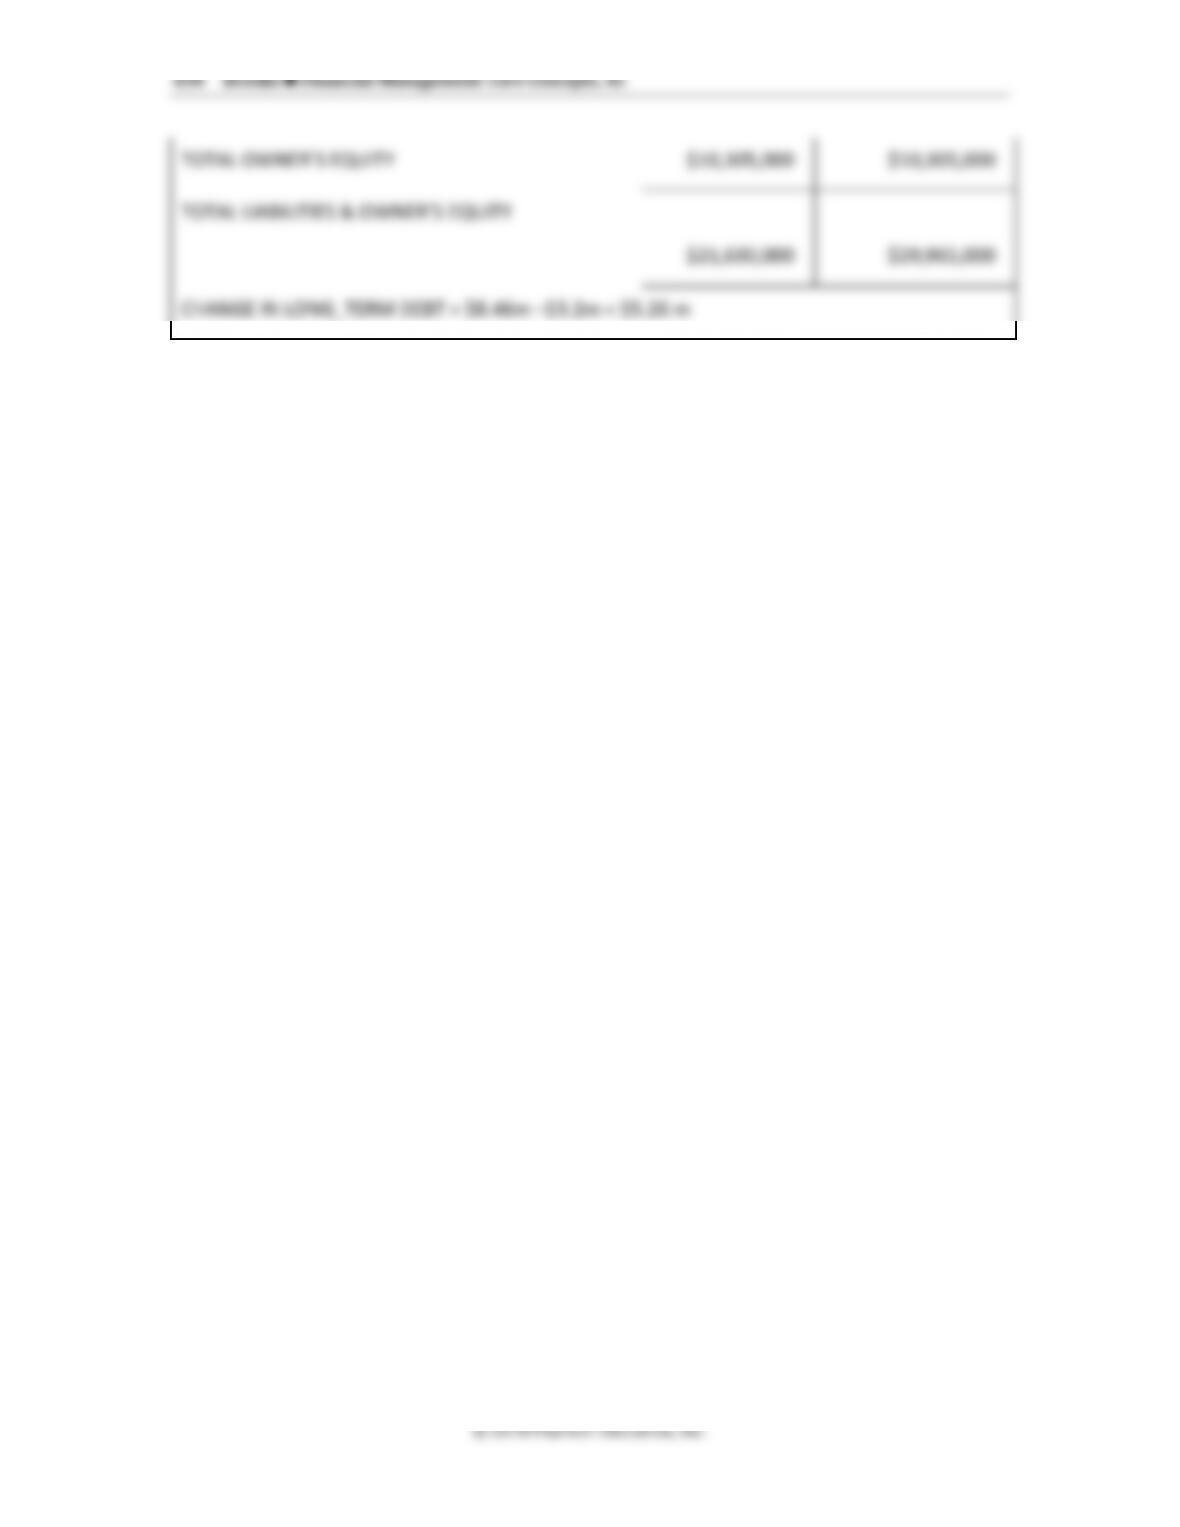
TOTAL OWNER’S EQUITY
$10,305,000
TOTAL LIABILITIES & OWNER’S EQUITY
$21,630,000
Next year, the firm will increase its plant, property, and equipment by $7,000,000 with a plant
expansion. The inventories will grow by 70%, but accounts payables will grow by 60%, and the
company will reduce marketable securities by 50% to help finance the expansion. If all other
asset accounts remain the same and the company uses long-term debt to finance the remaining
costs of the expansion (no change in common stock or retained earnings), prepare a pro forma
balance sheet for 2018. How much additional debt will be estimated using this pro forma
balance sheet?
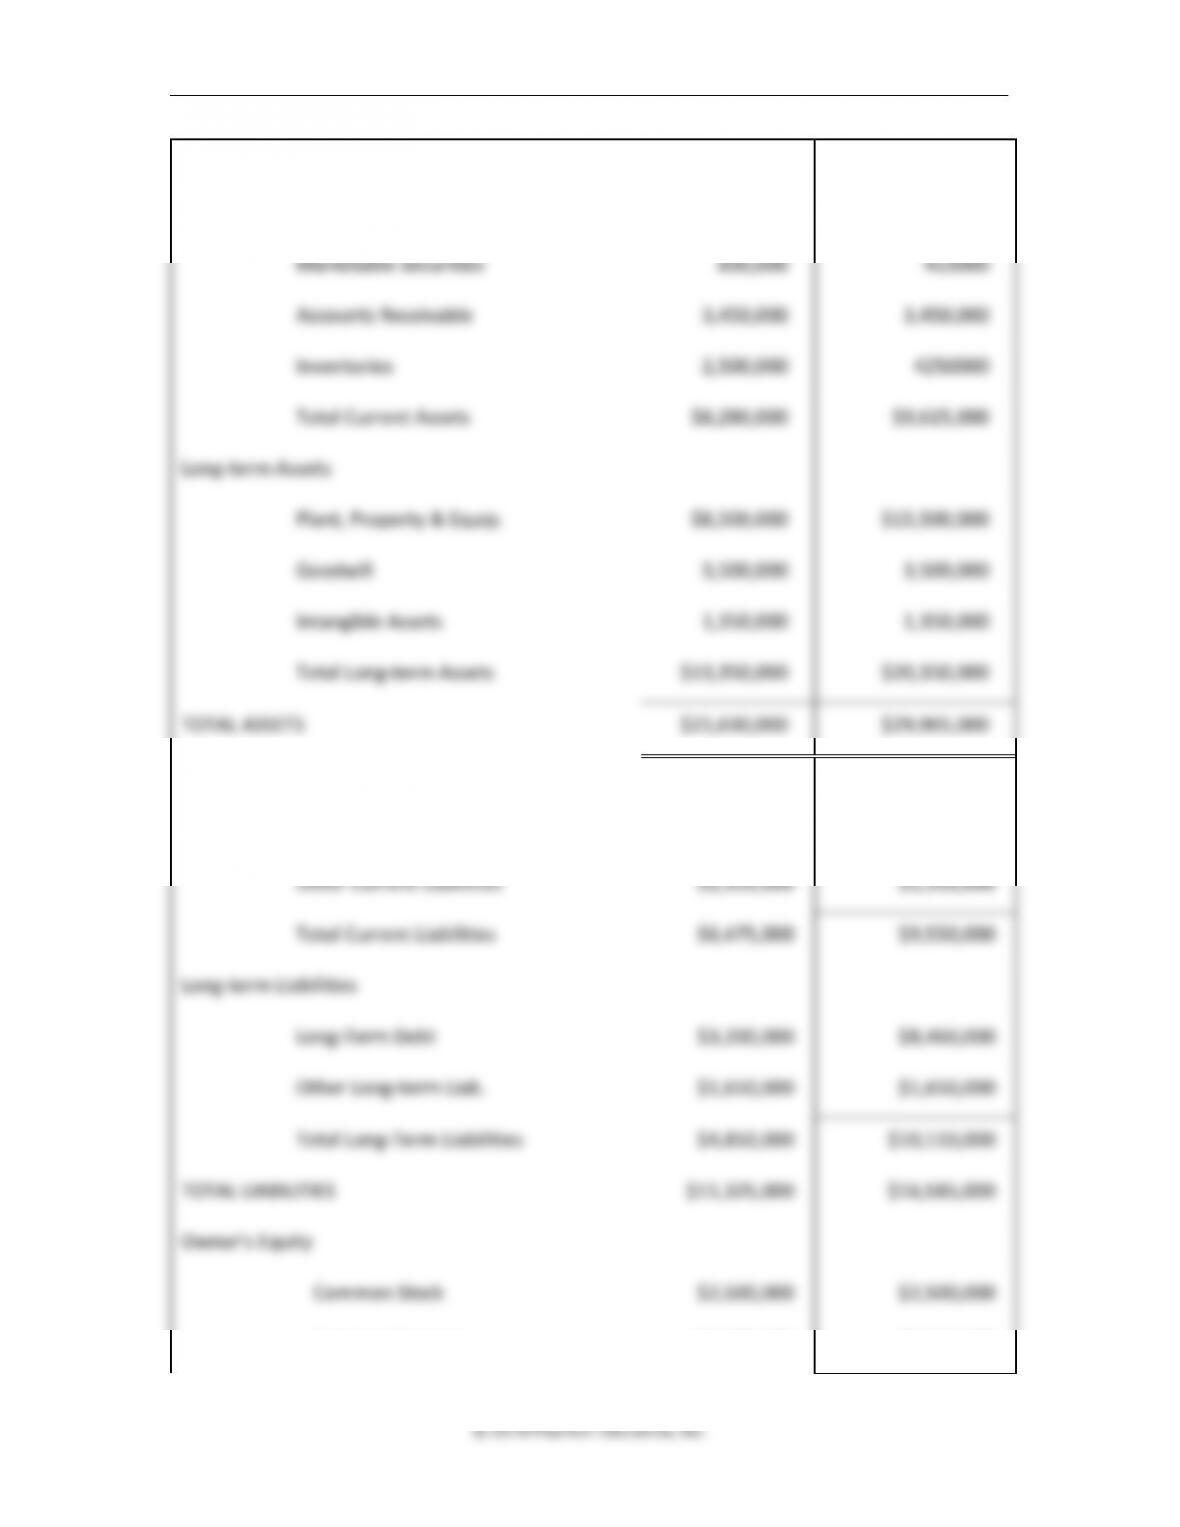
ANSWER (Slides 12-37 to 12-42)
Chapter 12 ◼ Forecasting and Short-Term Financial Planning 437
Current Assets
2017
2018 pro forma
Cash
$1,500,000
$1,500,000
Marketable Securities
830,000
415000
Accounts Receivable
3,450,000
3,450,000
Inventories
2,500,000
4250000
Total Current Assets
$8,280,000
$9,615,000
Long-term Assets
Plant, Property & Equip.
$8,500,000
$15,500,000
Goodwill
3,500,000
3,500,000
Intangible Assets
1,350,000
1,350,000
Total Long-term Assets
$13,350,000
$20,350,000
TOTAL ASSETS
$21,630,000
$29,965,000
Current Liabilities
Accounts Payable
$5,125,000
$8,200,000.0
Other Current Liabilities
$1,350,000
$1,350,000
Total Current Liabilities
$6,475,000
$9,550,000
Long-term Liabilities
Long-Term Debt
$3,200,000
$8,460,000
Other Long-term Liab.
$1,650,000
$1,650,000
Total Long-Term Liabilities
$4,850,000
$10,110,000
TOTAL LIABILITIES
$11,325,000
$16,585,000
Owner’s Equity
Common Stock
$2,500,000
$2,500,000
Retained Earnings
$7,805,000
$7,805,000