414 Brooks ◼ Financial Management: Core Concepts, 4e
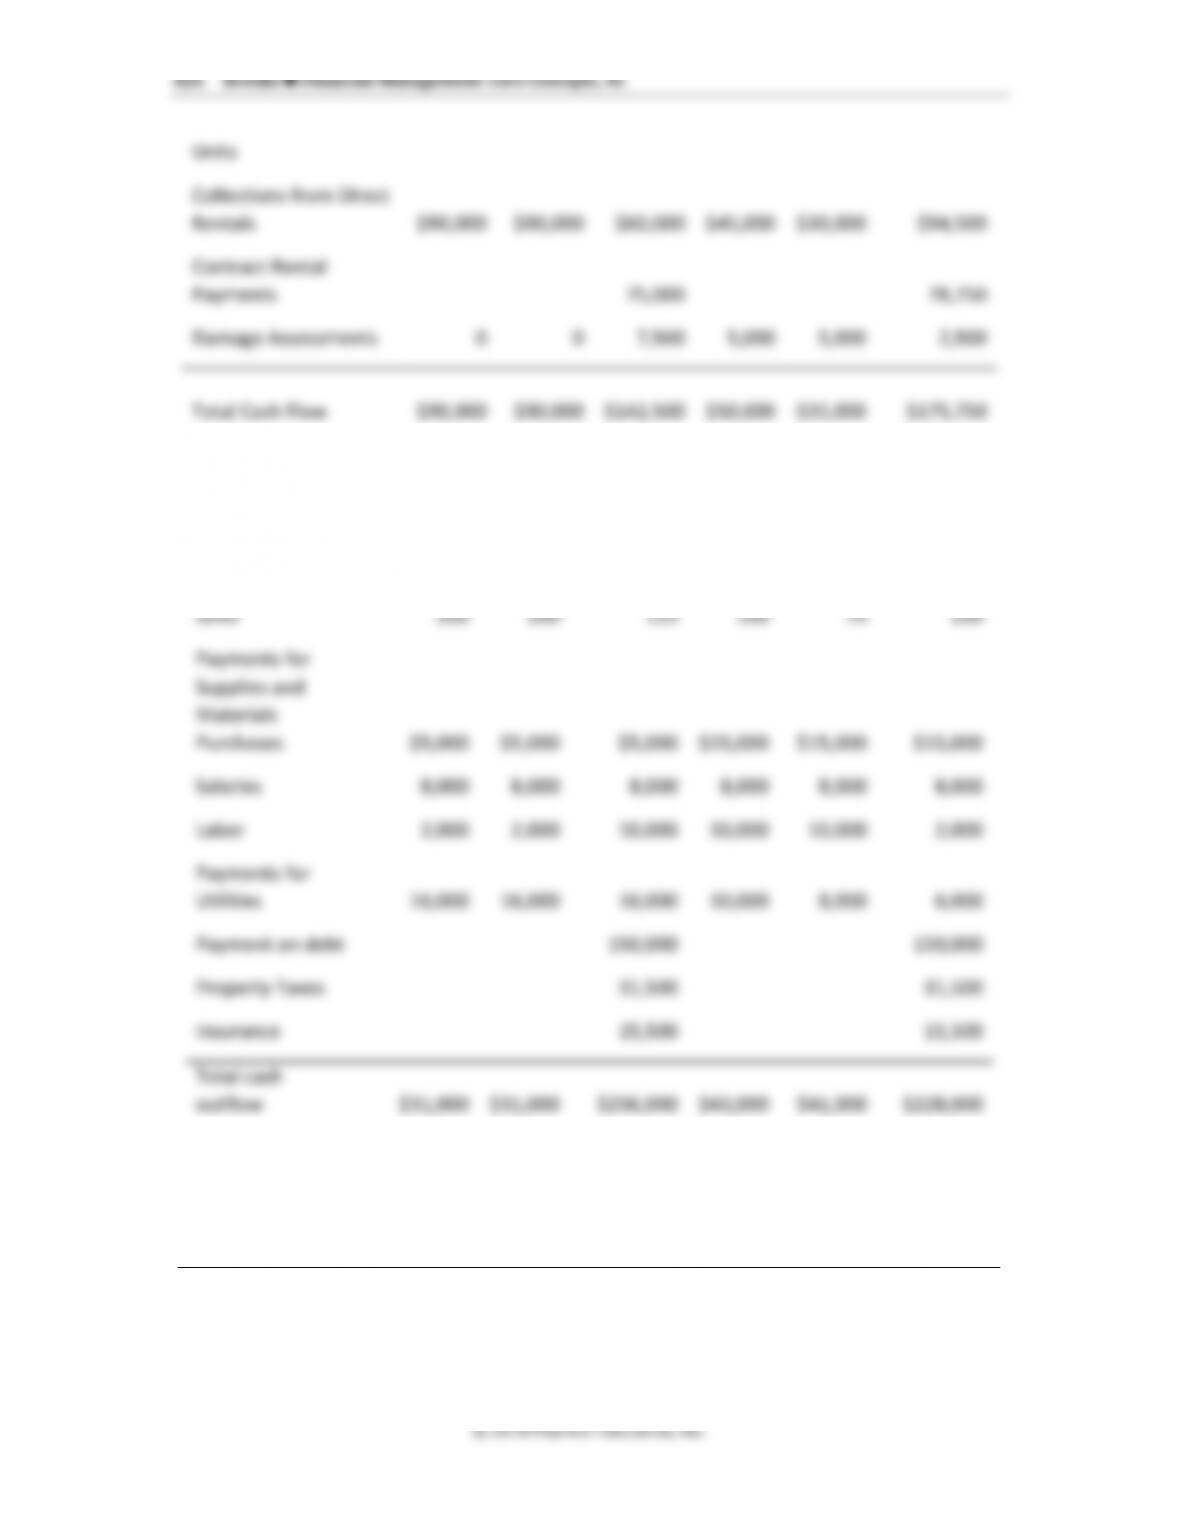
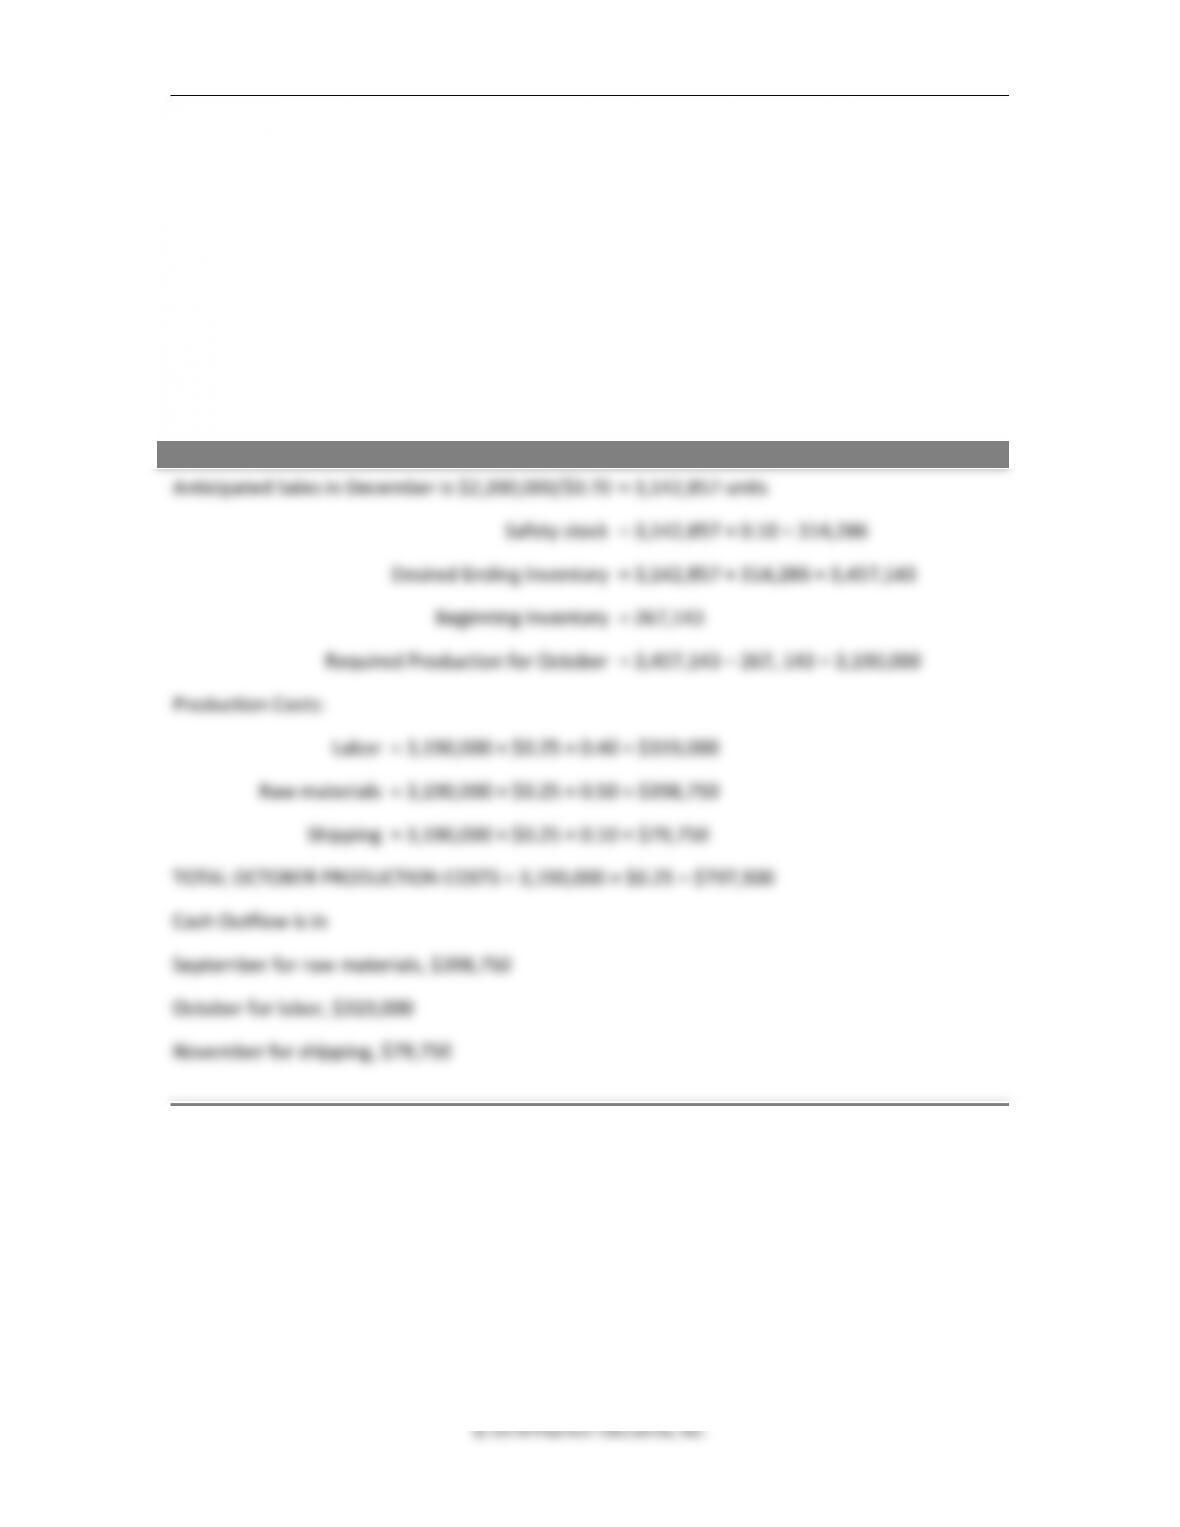
7. Production cash outflow. National Beverage Company produces its products two months in
advance of anticipated sales and ships to warehouse centers the month before sale. The
inventory safety stock is 10% of the anticipated month’s sale. Beginning inventory in
October 2017 was 267,143 units. Each unit costs $0.25 to make. The average selling price is
$0.70 per unit. The cost is made up of 40% labor, 50% materials, and 10% shipping (to
warehouse). Labor is paid the month of production, shipping the month after production,
and raw materials the month prior to production. What is the production cash outflow for
the month of October 2017, and in what months does it occur? Note: October production is
based on December anticipated sales. Use the fourth-quarter sales forecasts from Problem
5.
ANSWER
8. Production cash outflow. California Cement Co. produces its products two months in
advance of anticipated sales and ships to warehouse centers the month before sale. The
inventory safety stock is 20% of the anticipated month’s sale. Beginning inventory in
September 2017 was 33,913 units. Each unit costs $2.80 to make. The average sales price
per unit is $5.75. The cost is made up of 30% labor, 65% materials, and 5% shipping (to the
warehouse). The company pays for labor in the month of production, shipping the month
after production, and raw materials the month prior to production. What is the production
cash outflow for the month of September 2017, and in what months does it occur? Note:
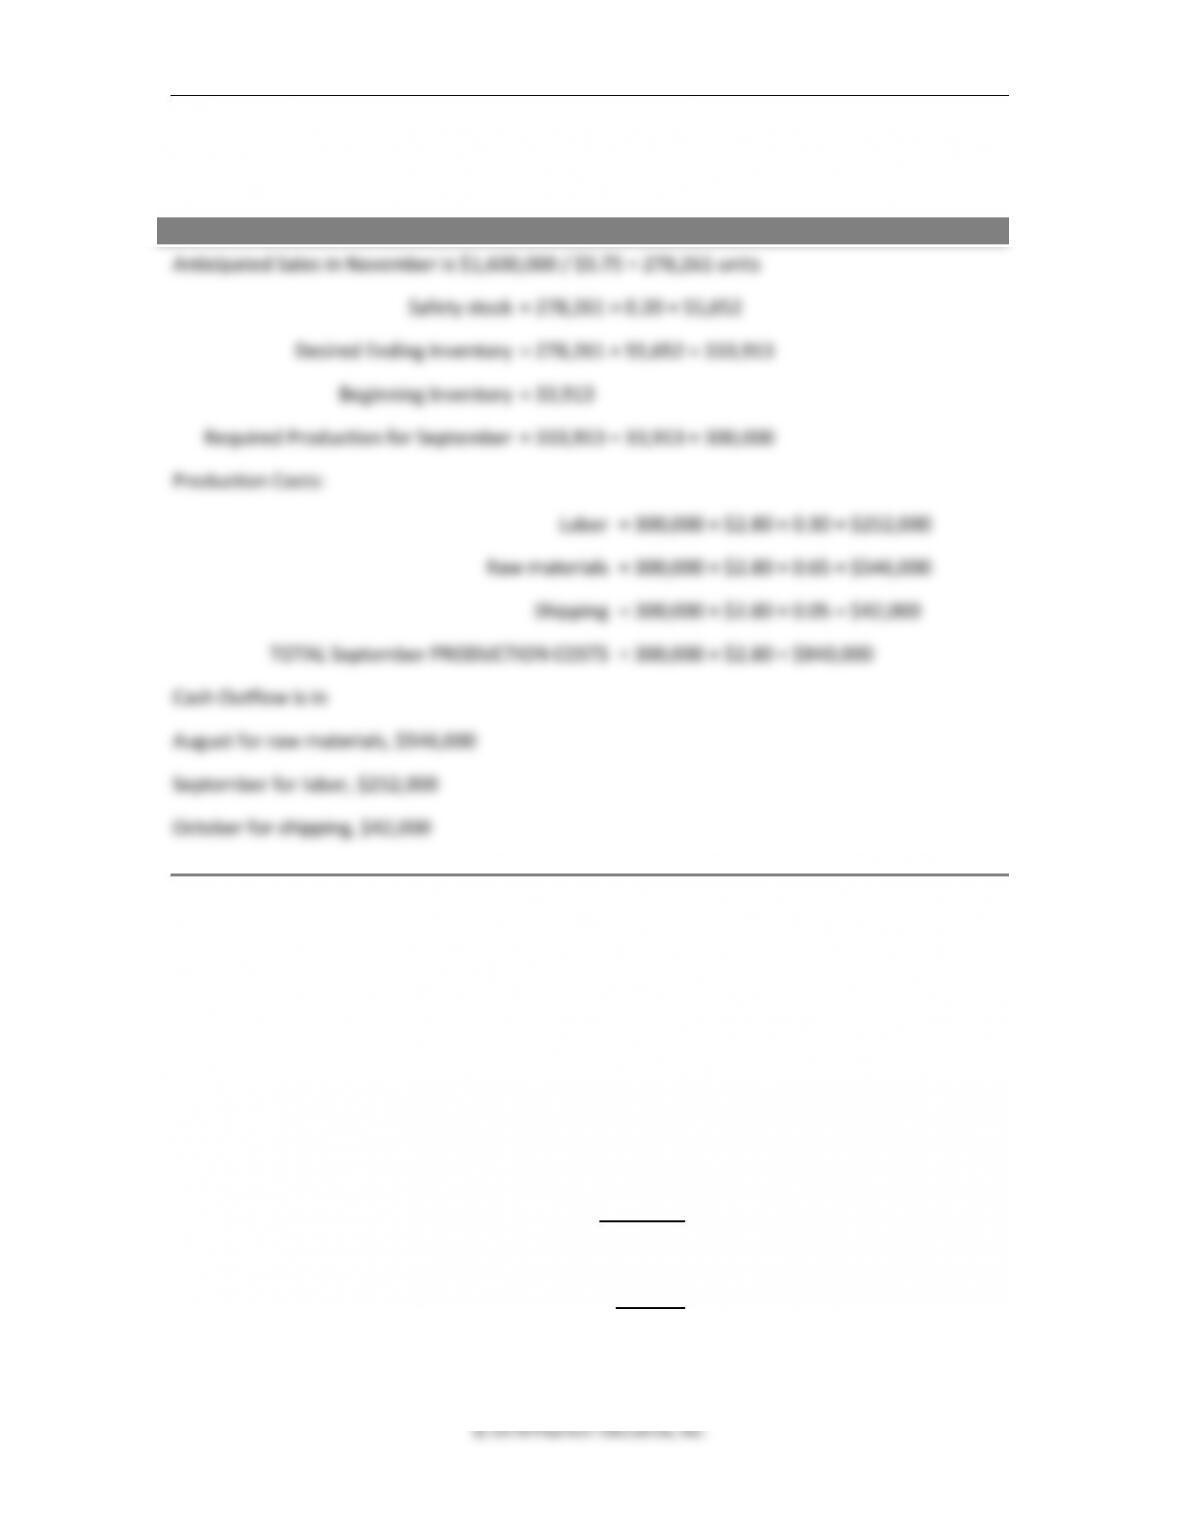
Chapter 12 ◼ Forecasting and Short-Term Financial Planning 415
September production is based on November anticipated sales. Use the fourth-quarter sales
forecasts from Problem 6.
ANSWER
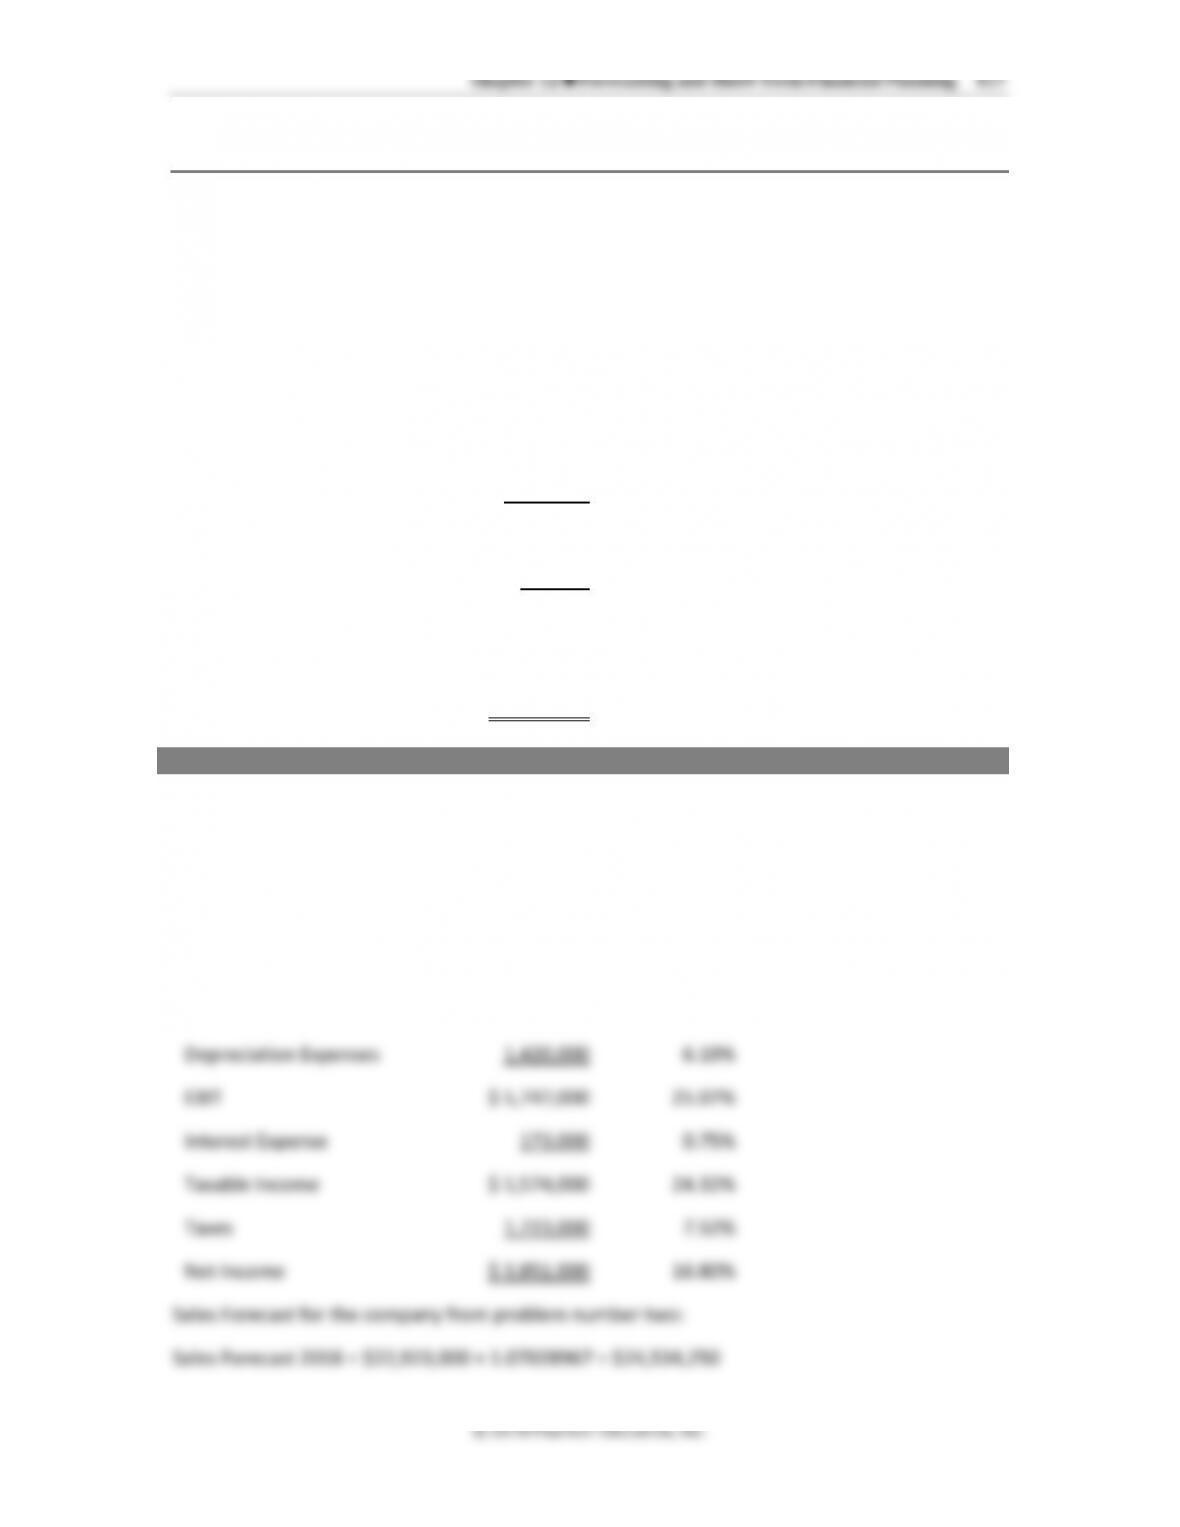
9. Pro forma income statement. Given the income statement below for National Beverage
Company for 2017, and the sales forecast from Problem 1, prepare a pro forma income
statement for 2018.
National Beverage Company
Income Statement for December 31, 2017
Sales Revenue $24,088,000
COGS 8,164,000
SG&A Expenses 7,616,000
Depreciation Expenses 2,388,000
EBIT $ 5,920,000
Interest Expense 220,000
Taxable Income $ 5,700,000
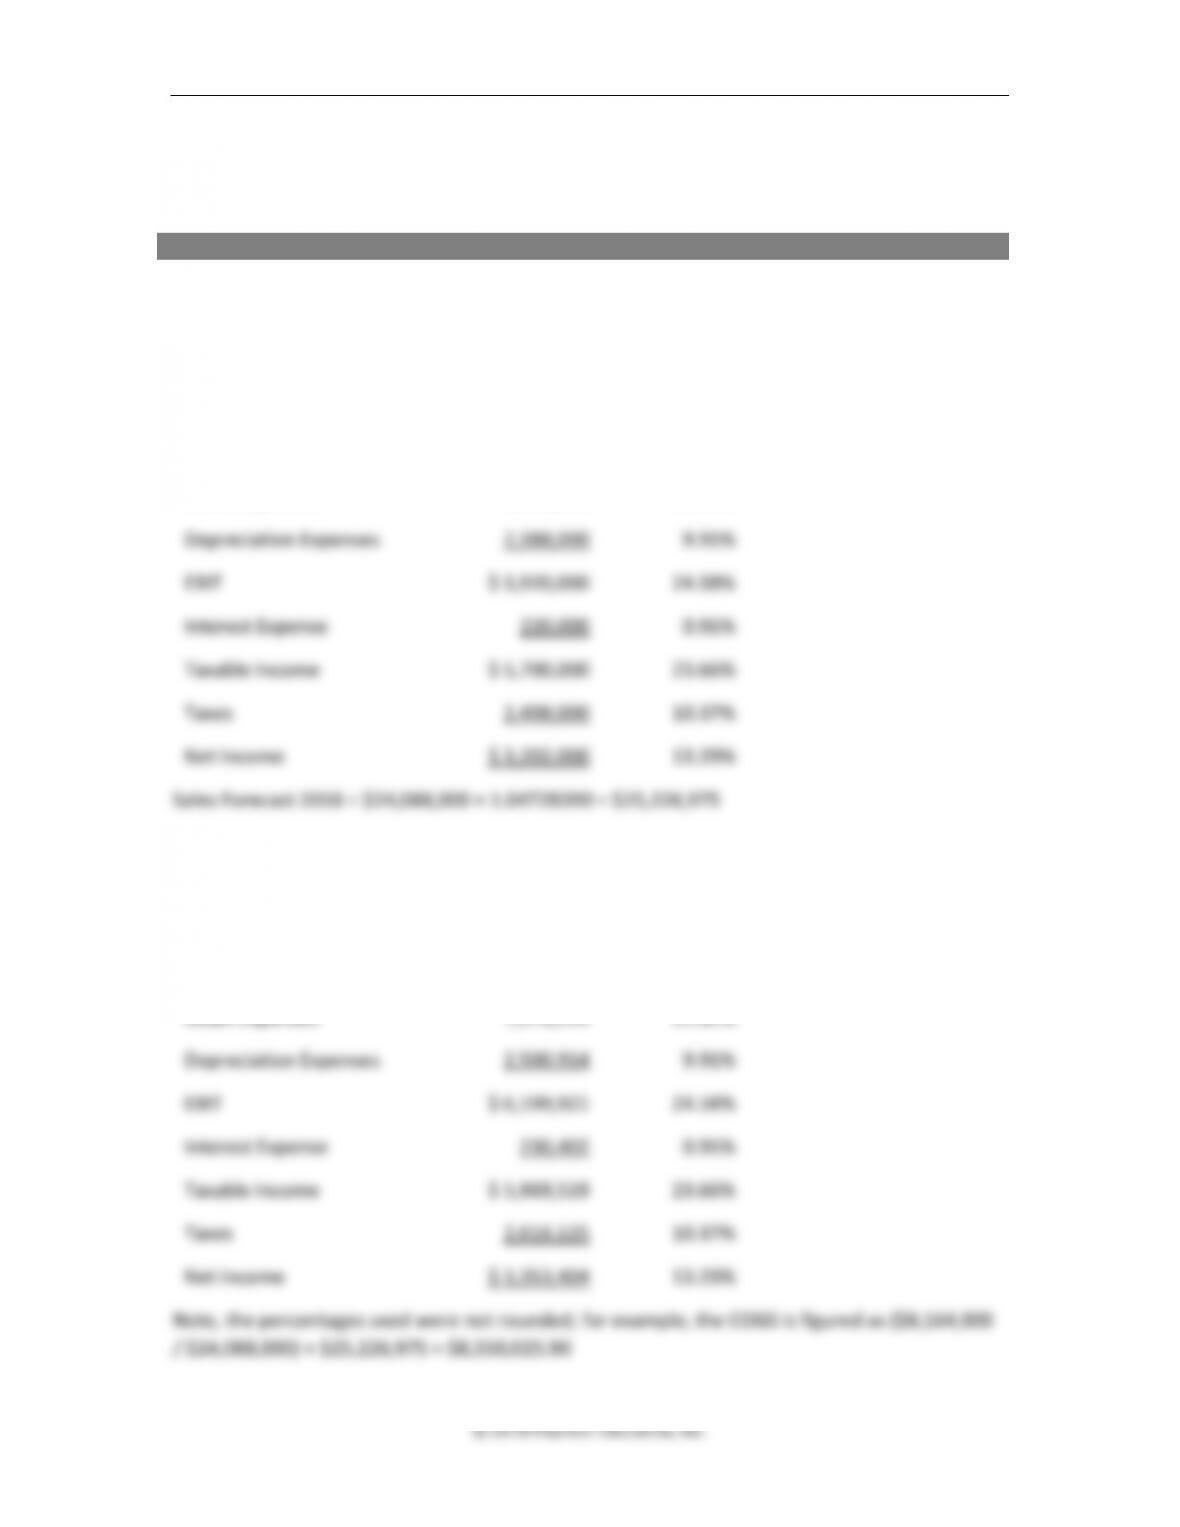
416 Brooks ◼ Financial Management: Core Concepts, 4e
Taxes 2,498,000
Net Income $ 3,202,000
ANSWER
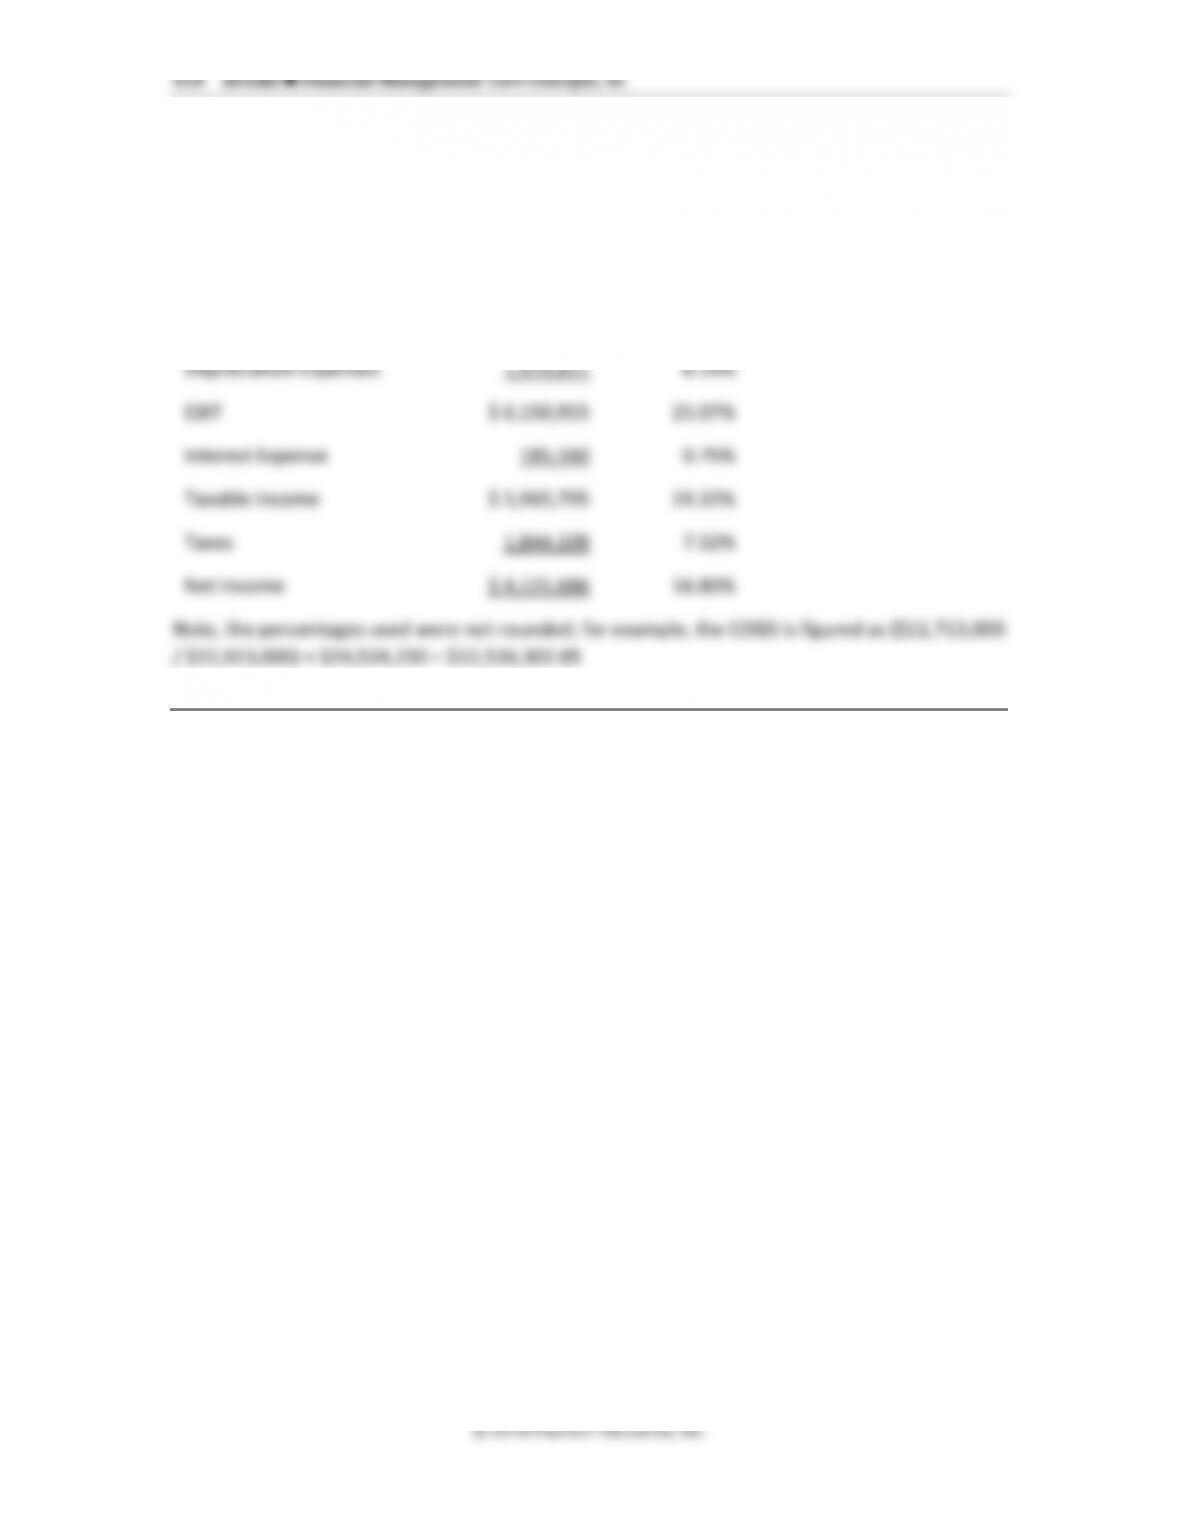
First find the percentage of each income statement line from 2017 as a percent of sales.
National Beverage Company
Income Statement for December 31, 2017
Sales Revenue $24,088,000 100.00%
COGS 8,164,000 33.89%
SG&A Expenses 7,616,000 31.62%
National Beverage Company
Pro Forma Income Statement for 2018
Sales Revenue $25,226,975 100.00%
COGS 8,550,026 33.89%
SG&A Expenses 7,976,114 31.62%

420 Brooks ◼ Financial Management: Core Concepts, 4e
Owners’ Equity
Common Stock $ 6,861,000
Retained Earnings $10,059,000
TOTAL OWNERS’ EQUITY $16,920,000
TOTAL LIABILITIES & OWNER’S EQUITY$29,963,000
ANSWER
Start by changing the known asset accounts and then total up assets. Then use the total assets
for total liabilities and owner’s equity balance. Finally, make the required change in long-term
debt to balance the balance sheet.
National Beverage Company
Pro Forma Balance Sheet for the Year Ending December 31, 2018
Current Assets
Cash $2,440,000
Total Current Assets $ 8,646,100
Long-term Assets
Plant, Property & Equip. $17,686,000
Goodwill 1,403,000
© 2018 Pearson Education, Inc.
12. Pro forma balance sheet. Next year, California Cement Company will increase its plant,
property, and equipment by $6,000,000 with a plant expansion. The inventories will grow by
80%, accounts receivable will grow by 70%, and the company will reduce marketable
securities by 60% to help finance the expansion. Assume all other asset accounts remain the
same and the company will use long-term debt to finance the remaining expansion costs (no
change in common stock or retained earnings). Using this information and the balance sheet
provided for California Cement Company for 2017, prepare a pro forma balance sheet for
2018. How much additional debt will the company need using this pro forma balance sheet?
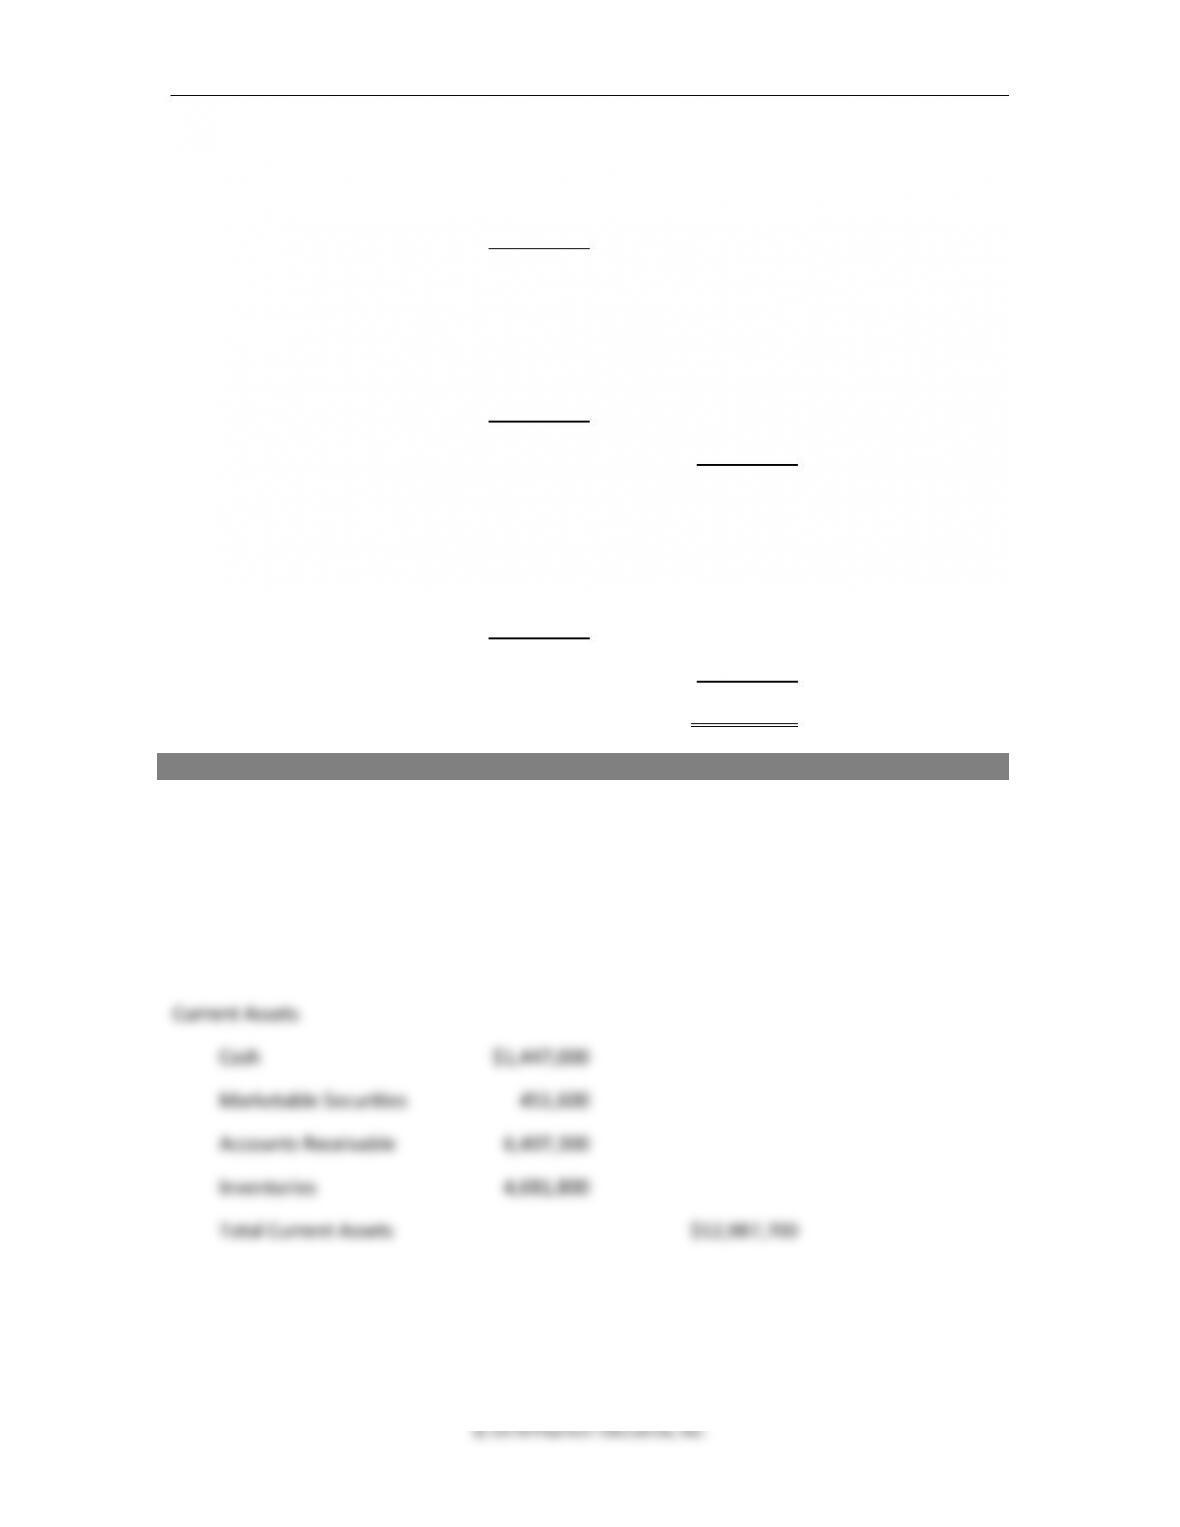
California Cement Company
Balance Sheet for the Year Ending December 31, 2017
Current Assets
Cash $1,447,000
Marketable Securities 1,129,000
Accounts Receivable 3,769,000
Inventories 2,601,000
Total Current Assets $ 8,946,000

422 Brooks ◼ Financial Management: Core Concepts, 4e
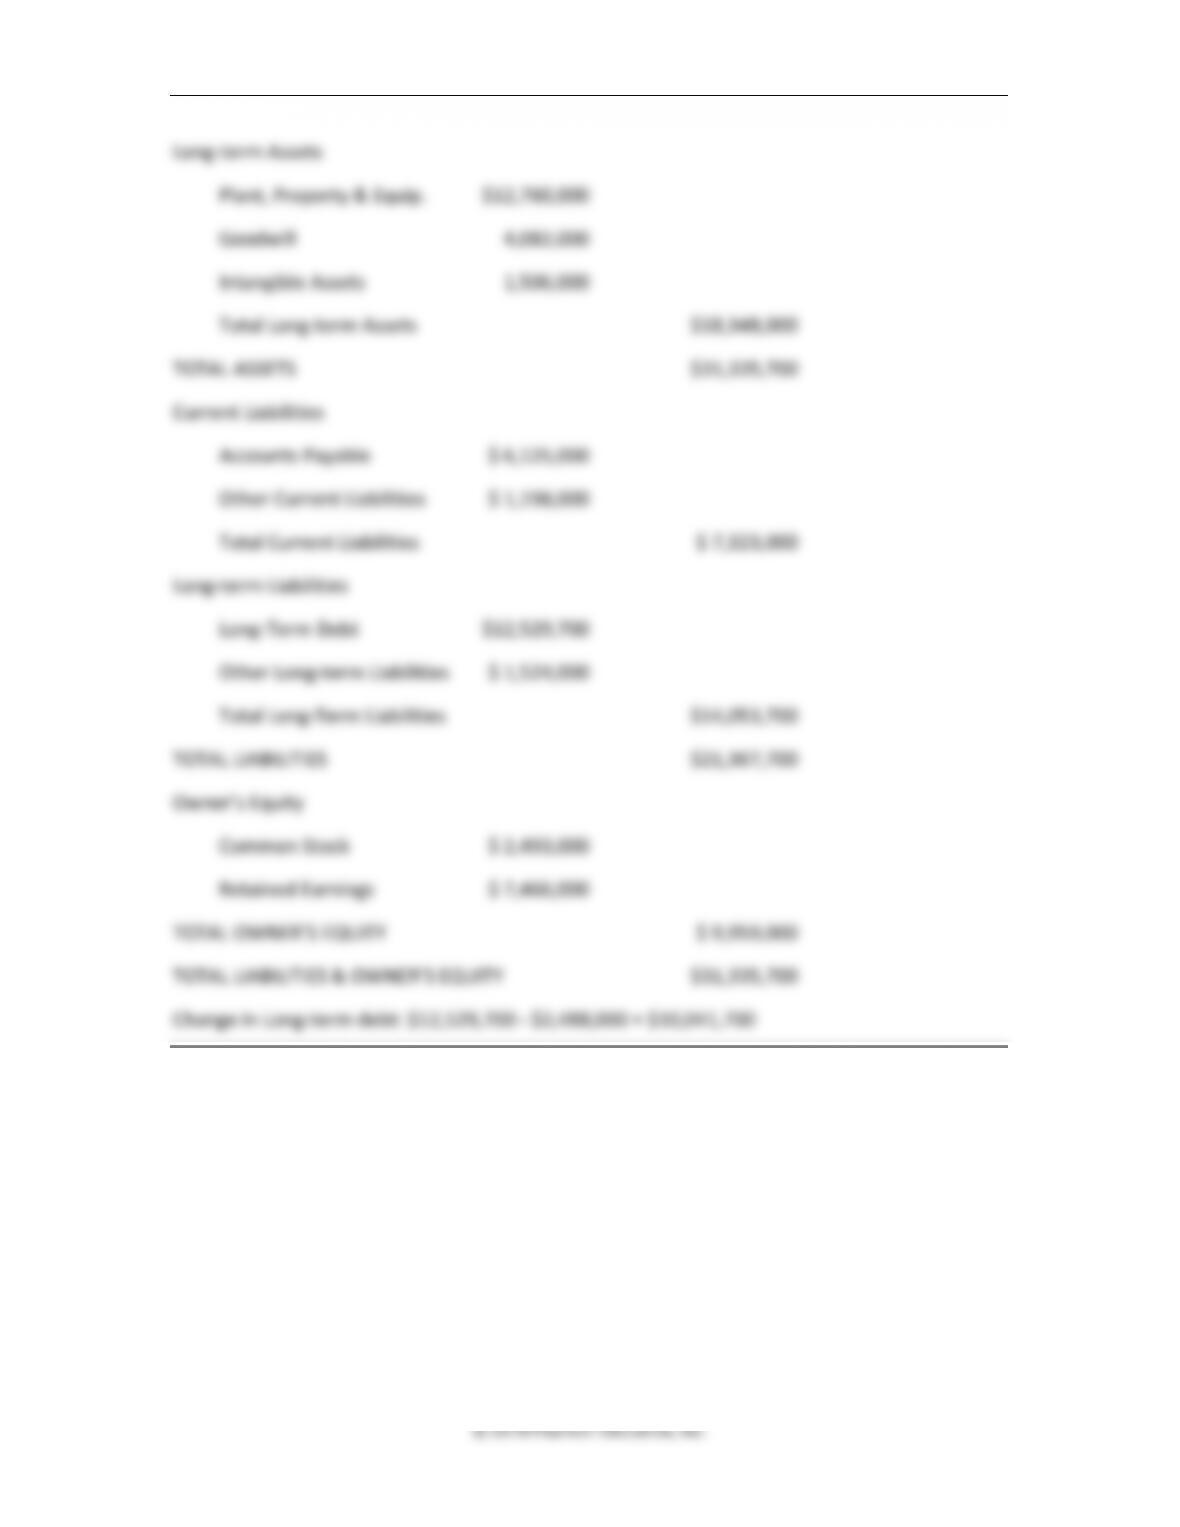
Long-term Assets
Plant, Property & Equip. $ 6,760,000
Goodwill 4,082,000
Intangible Assets 1,506,000
Total Long-term Assets $12,348,000
TOTAL ASSETS $21,294,000
Chapter 12 ◼ Forecasting and Short-Term Financial Planning 423
Current Liabilities
Accounts Payable $ 6,125,000
Other Current Liabilities $ 1,198,000
Total Current Liabilities $ 7,323,000
Long-term Liabilities
Long-Term Debt $ 2,488,000
Other Long-term Liabilities $ 1,524,000
Total Long-Term Liabilities $ 4,012,000
TOTAL LIABILITIES $11,335,000
Owner’s Equity
Common Stock $ 2,493,000
Retained Earnings $ 7,466,000
TOTAL OWNER’S EQUITY $ 9,959,000
TOTAL LIABILITIES & OWNER’S EQUITY $21,294,000
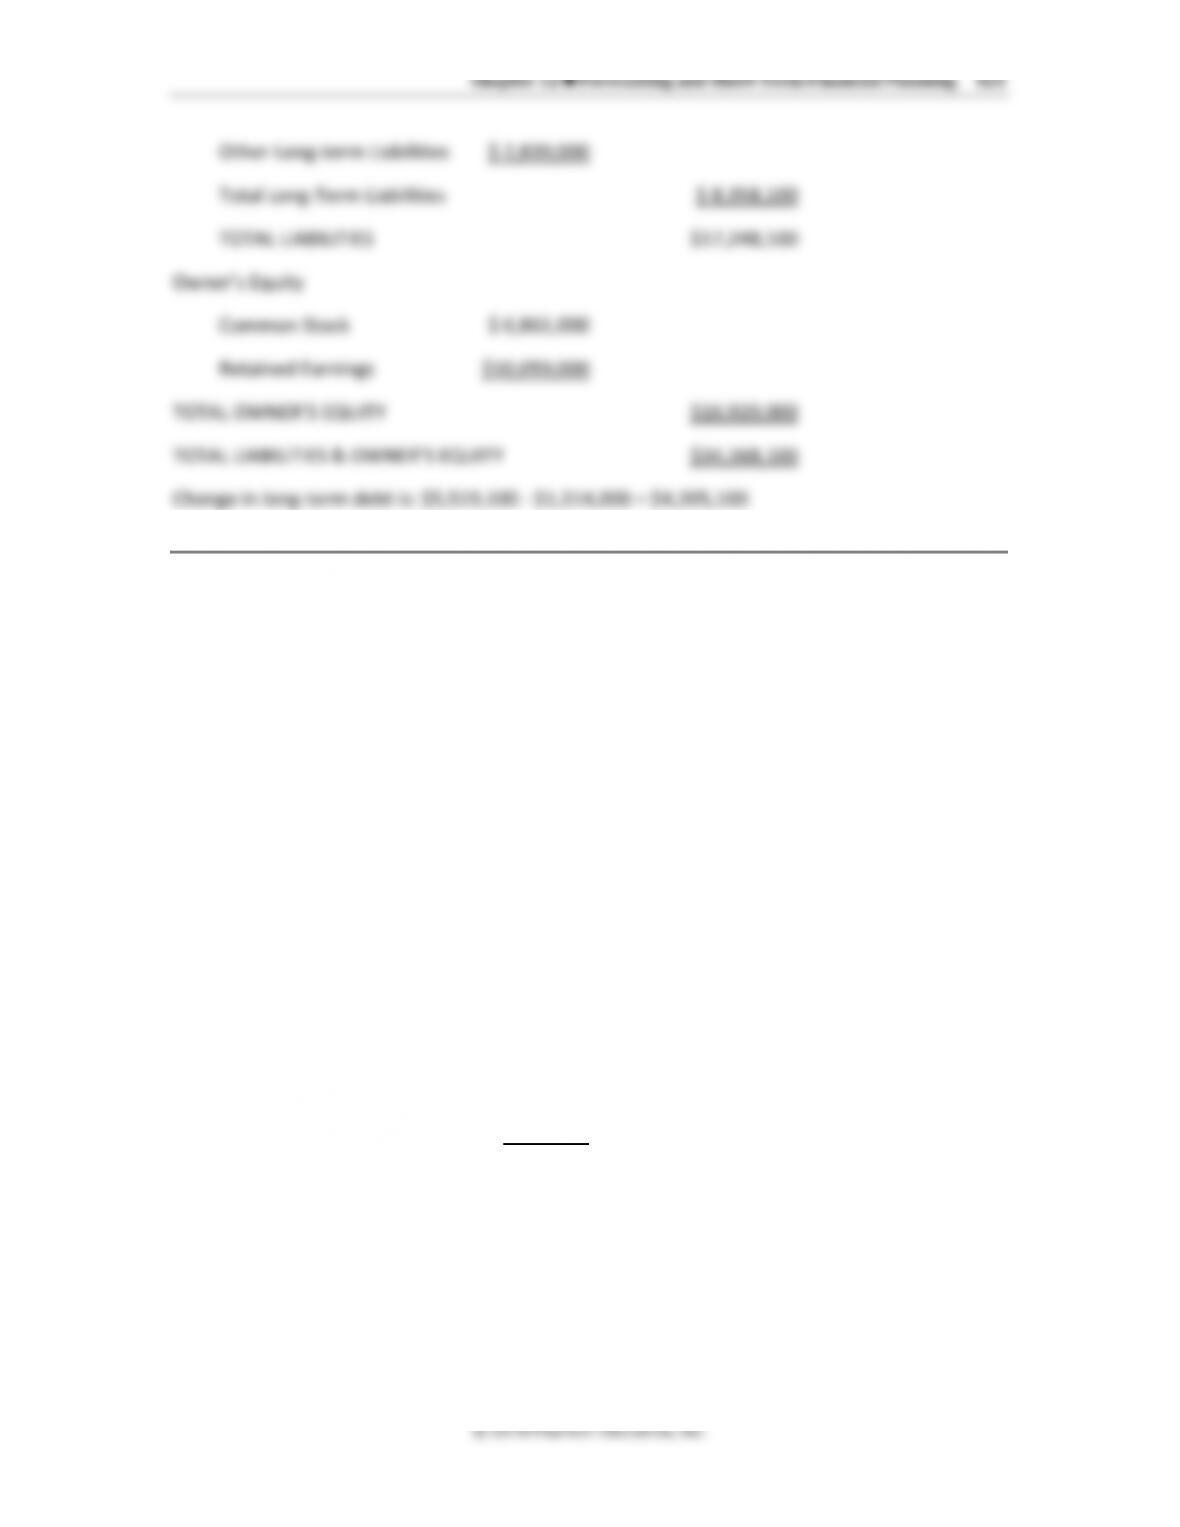
ANSWER
Start by changing the known asset accounts and then total up assets. Then use the total assets
for total liabilities and owner’s equity balance. Finally, make the required change in long-term
debt to balance the balance sheet.
California Cement Company
Pro Forma Balance Sheet for the Year Ending
December 31, 2018
424 Brooks ◼ Financial Management: Core Concepts, 4e
© 2018 Pearson Education, Inc.
Long-term Assets
Plant, Property & Equip. $12,760,000
Goodwill 4,082,000
Intangible Assets 1,506,000
Total Long-term Assets $18,348,000
TOTAL ASSETS $31,335,700
Current Liabilities
Accounts Payable $ 6,125,000
Other Current Liabilities $ 1,198,000
Total Current Liabilities $ 7,323,000
Long-term Liabilities
Long-Term Debt $12,529,700
Other Long-term Liabilities $ 1,524,000
Total Long-Term Liabilities $14,053,700
TOTAL LIABILITIES $21,367,700
Owner’s Equity
Common Stock $ 2,493,000
Retained Earnings $ 7,466,000
TOTAL OWNER’S EQUITY $ 9,959,000
TOTAL LIABILITIES & OWNER’S EQUITY $31,335,700
Change in Long-term debt: $12,529,700 – $2,488,000 = $10,041,700
Chapter 12 ◼ Forecasting and Short-Term Financial Planning 425
Solutions to Advanced Problems for Spreadsheet Application
1. Cash flow forecasting.
2. Pro forma income statements.
Solutions to Mini-Case
Midwest Properties: Quarterly Forecasting
In this mini-case, both the importance and the techniques of cash flow budgeting are
emphasized by focusing on a business with highly seasonal cash flow patterns. The nature of the
business is such that students should have a quick intuitive grasp of the issues. The case also
requires construction of a pro forma income statement based on the budget. This exercise
requires the student to think about the difference between cash flows and accrual accounting
measures.
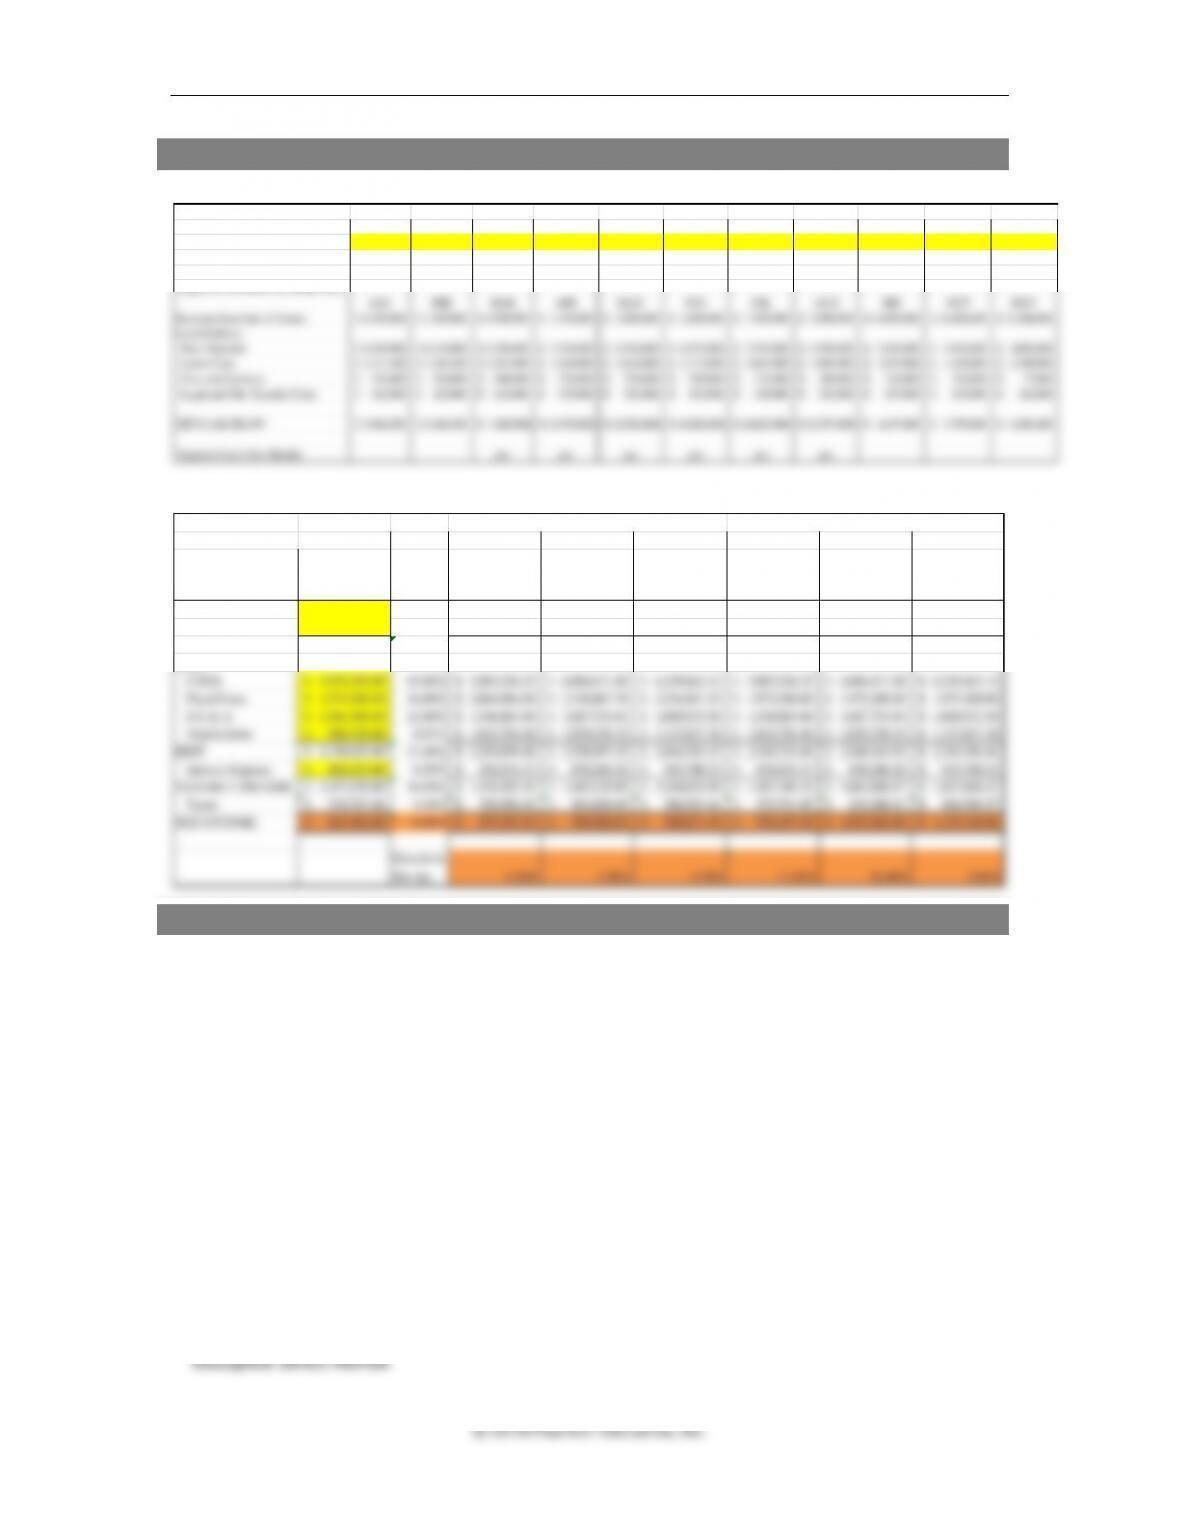
1. Complete the following table of cash inflows for the months of July, August, and
September. Use Table 12.1 as a model.
April
May
June
July
August
September
Regional Construction
Sep Oct Nov Dec
Jan Feb Mar Apr May Jun Jul
Actual and Projected Housing Starts 18 16 11 7
12 12 16 20 32 32 30
Projected Cash Flows by Month 2014
JAN FEB MAR APR MAY JUN JUL AUG SEP OCT NOV
Revenue from Sale of Homes 8,100,000$ 7,200,000$ 4,950,000$ 3,150,000$ 5,400,000$ 5,400,000$ 7,200,000$ 9,000,000$ 14,400,000$ 14,400,000$ 13,500,000$
Cash Outflows
Raw Materials 2,340,000$ 2,418,000$ 3,120,000$ 3,744,000$ 5,304,000$ 6,552,000$ 7,332,000$ 6,708,000$ 5,928,000$ 4,992,000$ 4,056,000$
Labor Costs 1,417,500$ 1,165,500$ 1,354,500$ 1,638,000$ 2,016,000$ 2,772,000$ 3,654,000$ 3,969,000$ 3,654,000$ 3,150,000$ 2,709,000$
Fees and Licences 216,000$ 288,000$ 360,000$ 576,000$ 576,000$ 540,000$ 432,000$ 396,000$ 324,000$ 216,000$ 72,000$
Legal and Title Transfer Costs 162,000$ 162,000$ 216,000$ 270,000$ 432,000$ 432,000$ 405,000$ 324,000$ 297,000$ 243,000$ 162,000$
NET CASH FLOW 3,964,500$ 3,166,500$ (100,500)$ (3,078,000)$ (2,928,000)$ (4,896,000)$ (4,623,000)$ (2,397,000)$ 4,197,000$ 5,799,000$ 6,501,000$
SW ZIA Company
2013 2014 2015 2016 2014 2015 2016
Income Statement
Percent
of
Revenue
Revenue 12,345,000.00$ 100.00% 12,900,525.00$ 13,481,048.63$ 14,087,695.81$ 12,900,525.00$ 13,481,048.63$ 14,087,695.81$
Returns 185,175.00$ 1.50% 193,507.88$ 202,215.73$ 211,315.44$ 193,507.88$ 202,215.73$ 211,315.44$
NET REVENUE 12,159,825.00$ 98.50% 12,707,017.13$ 13,278,832.90$ 13,876,380.38$ 12,707,017.13$ 13,278,832.90$ 13,876,380.38$
Costs
COGS 5,555,250.00$ 45.00% 5,805,236.25$ 6,066,471.88$ 6,339,463.12$ 5,805,236.25$ 6,066,471.88$ 6,339,463.12$
Fixed Costs 1,975,200.00$ 16.00% 2,064,084.00$ 2,156,967.78$ 2,254,031.33$ 1,975,200.00$ 1,975,200.00$ 1,975,200.00$
S G & A 1,481,400.00$ 12.00% 1,548,063.00$ 1,617,725.84$ 1,690,523.50$ 1,548,063.00$ 1,617,725.84$ 1,690,523.50$
Depreciation 988,320.00$ 8.01% 1,032,794.40$ 1,079,270.15$ 1,127,837.30$ 1,032,794.40$ 1,079,270.15$ 1,127,837.30$
EBIT 2,159,655.00$ 17.49% 2,256,839.48$ 2,358,397.25$ 2,464,525.13$ 2,345,723.48$ 2,540,165.03$ 2,743,356.46$
Interest Expense 802,425.00$ 6.50% 838,534.13$ 876,268.16$ 915,700.23$ 838,534.13$ 876,268.16$ 915,700.23$
TAXABLE INCOME 1,357,230.00$ 10.99% 1,418,305.35$ 1,482,129.09$ 1,548,824.90$ 1,507,189.35$ 1,663,896.87$ 1,827,656.23$
Taxes 515,747.40$ 4.18% 538,956.03$ 563,209.05$ 588,553.46$ 572,731.95$ 632,280.81$ 694,509.37$
NET INCOME 841,482.60$ 6.82% 879,349.32$ 918,920.04$ 960,271.44$ 934,457.40$ 1,031,616.06$ 1,133,146.86$
Growth in
Net Inc.
4.50% 4.50% 4.50% 11.05% 10.40% 9.84%
Pro Forma Statement
Adjusted Pro Forma