
394
Chapter 12
Forecasting and Short-Term Financial
Planning
LEARNING OBJECTIVES (Slide 12-2)
1. Understand the sources and uses of cash in building a cash budget.
2. Explain how companies use sales forecasts to predict cash inflow.
3. Understand how production costs vary in terms of cash flow timing.
4. Explain possible ways to cover cash deficits and invest cash surplus.
5. Prepare a pro forma income statement and a pro forma balance sheet.
IN A NUTSHELL…
Financial forecasting and planning are tasks that every financial manager must perform
diligently in order to prevent cash flow problems and unnecessary higher costs of financing in
the future.
A cash budget is the basic financial planning tool for any individual or business, so the author
begins by identifying the various sources and uses of cash that are part of a cash budget. With
sales being the base variable, affecting almost all parts of a budget, the process of sales
forecasting is covered next. This is followed by an explanation of the timing of various
production costs and their consequential effects on possible cash deficits and surpluses. The
alternative sources available to cover cash shortages and the possible options for investing
surplus cash are then discussed. In the last section, the author illustrates the process of
preparing a pro-forma income statement and balance sheet as part of short-term financial
planning.
LECTURE OUTLINE
12.1 Sources and Uses of Cash (Slides 12-3 to 12-5)
Cash is considered to be the life-blood of a business. Cash shortages can be stifling and
expensive while excesses can lead to poor returns.
Because most businesses do not function on a pure cash basis, it is critical for them to forecast
their needs for cash in advance.
The cash budget is the analytical tool that estimates the future timing of cash inflow and cash
outflow and projects potential shortfalls and surpluses.
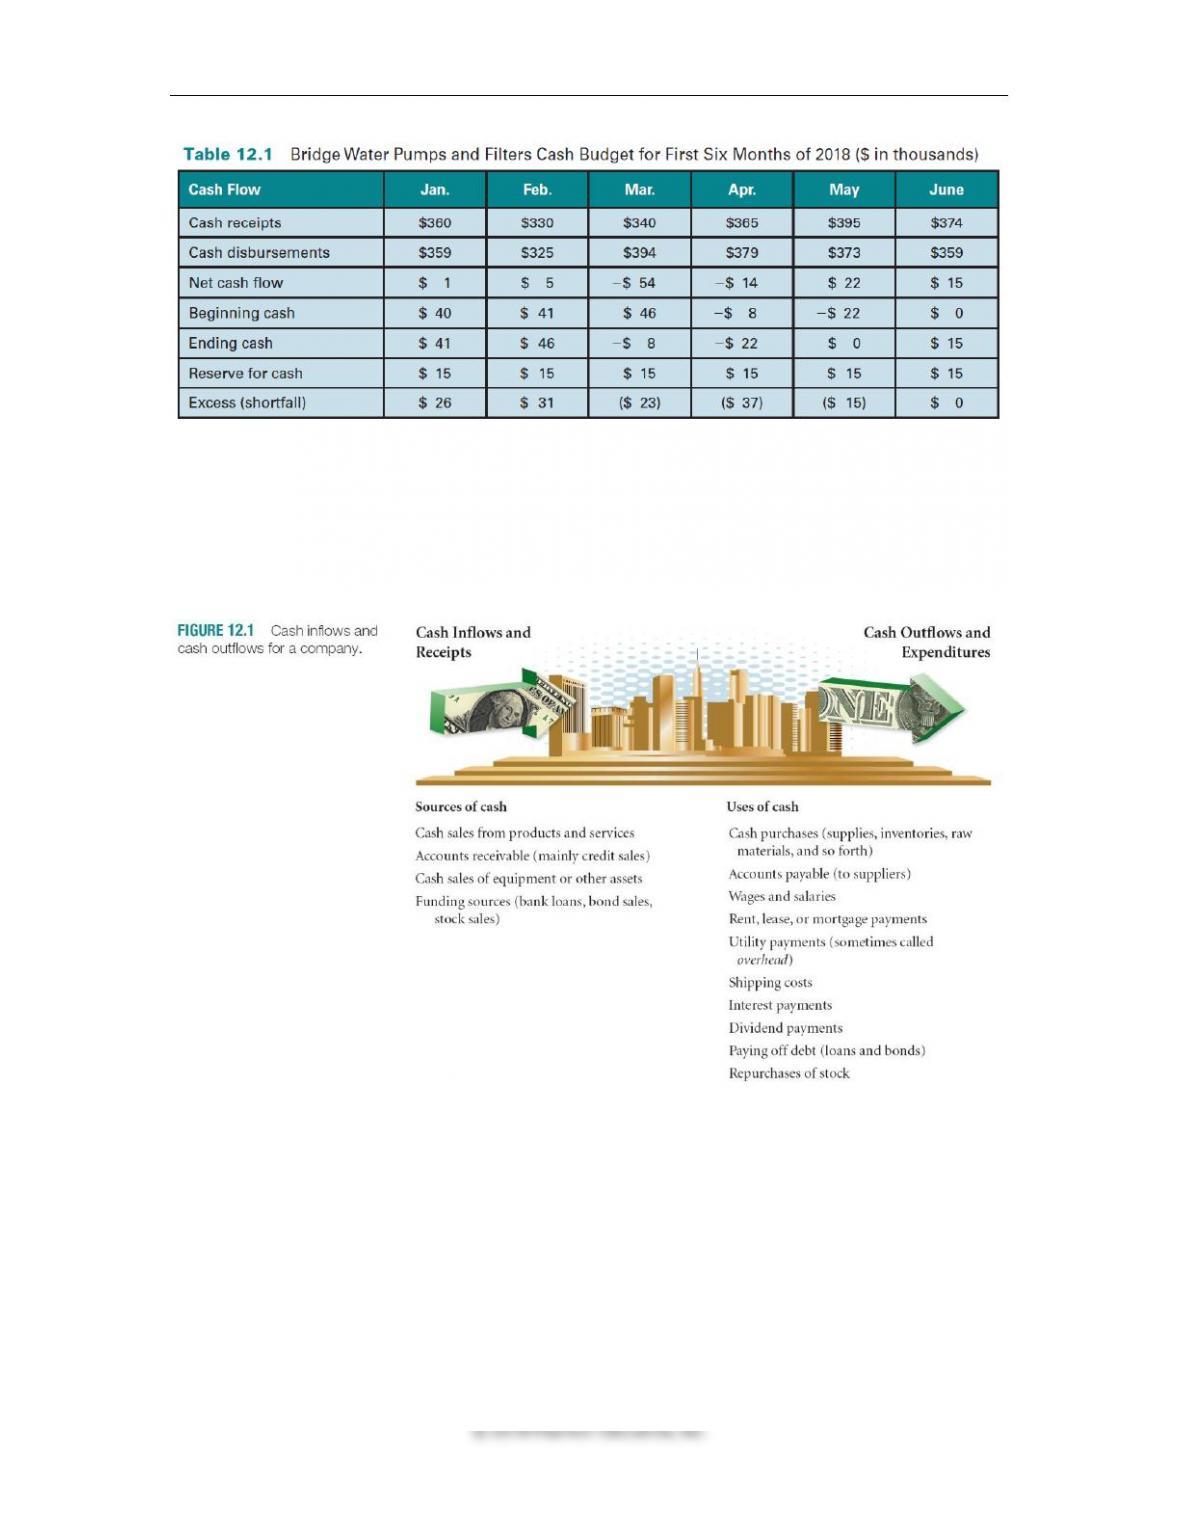
Table 12.1 presents the summary of a cash budget prepared for a hypothetical manufacturing
firm, Bridge Water Pumps and Filters.
Chapter 12 ◼ Forecasting and Short-Term Financial Planning 395
Notice how despite setting up a cash reserve, the firm is projected to have cash shortfalls in
three months and surpluses in two after all cash receipts and disbursements have been
forecasted for the first half of 2018.
Identifying all possible sources and uses of cash is essential for preparing a useful cash budget.
Figure 12.1 lists the various avenues of cash inflow and outflow typically faced by a firm.
This list can serve as a guide when preparing a cash budget.
12.2 Cash Budgeting and the Sales Forecast (Slides 12-6 to 12-10)
Because sales revenue is the base variable driving almost all other items in the cash budget, it is
important to forecast sales as objectively as possible.
Moreover, since there is usually a time lag between when a sale is made and when the cash
receipts come in, keeping track of when the firm receives cash from sales is as important as
determining when the sales materialize.

396 Brooks ◼ Financial Management: Core Concepts, 4e
Companies use internal data (information that is proprietary or unique to the firm) as well as
external data (publicly available information) sources to come up with objective forecasts of
sales.
Chapter 12 ◼ Forecasting and Short-Term Financial Planning 397
Cash Inflow from Sales: Firms typically sell products and services partially for cash and
partially on credit.
Thus, an analysis of a firm’s collection policy can help project cash inflow from sales.
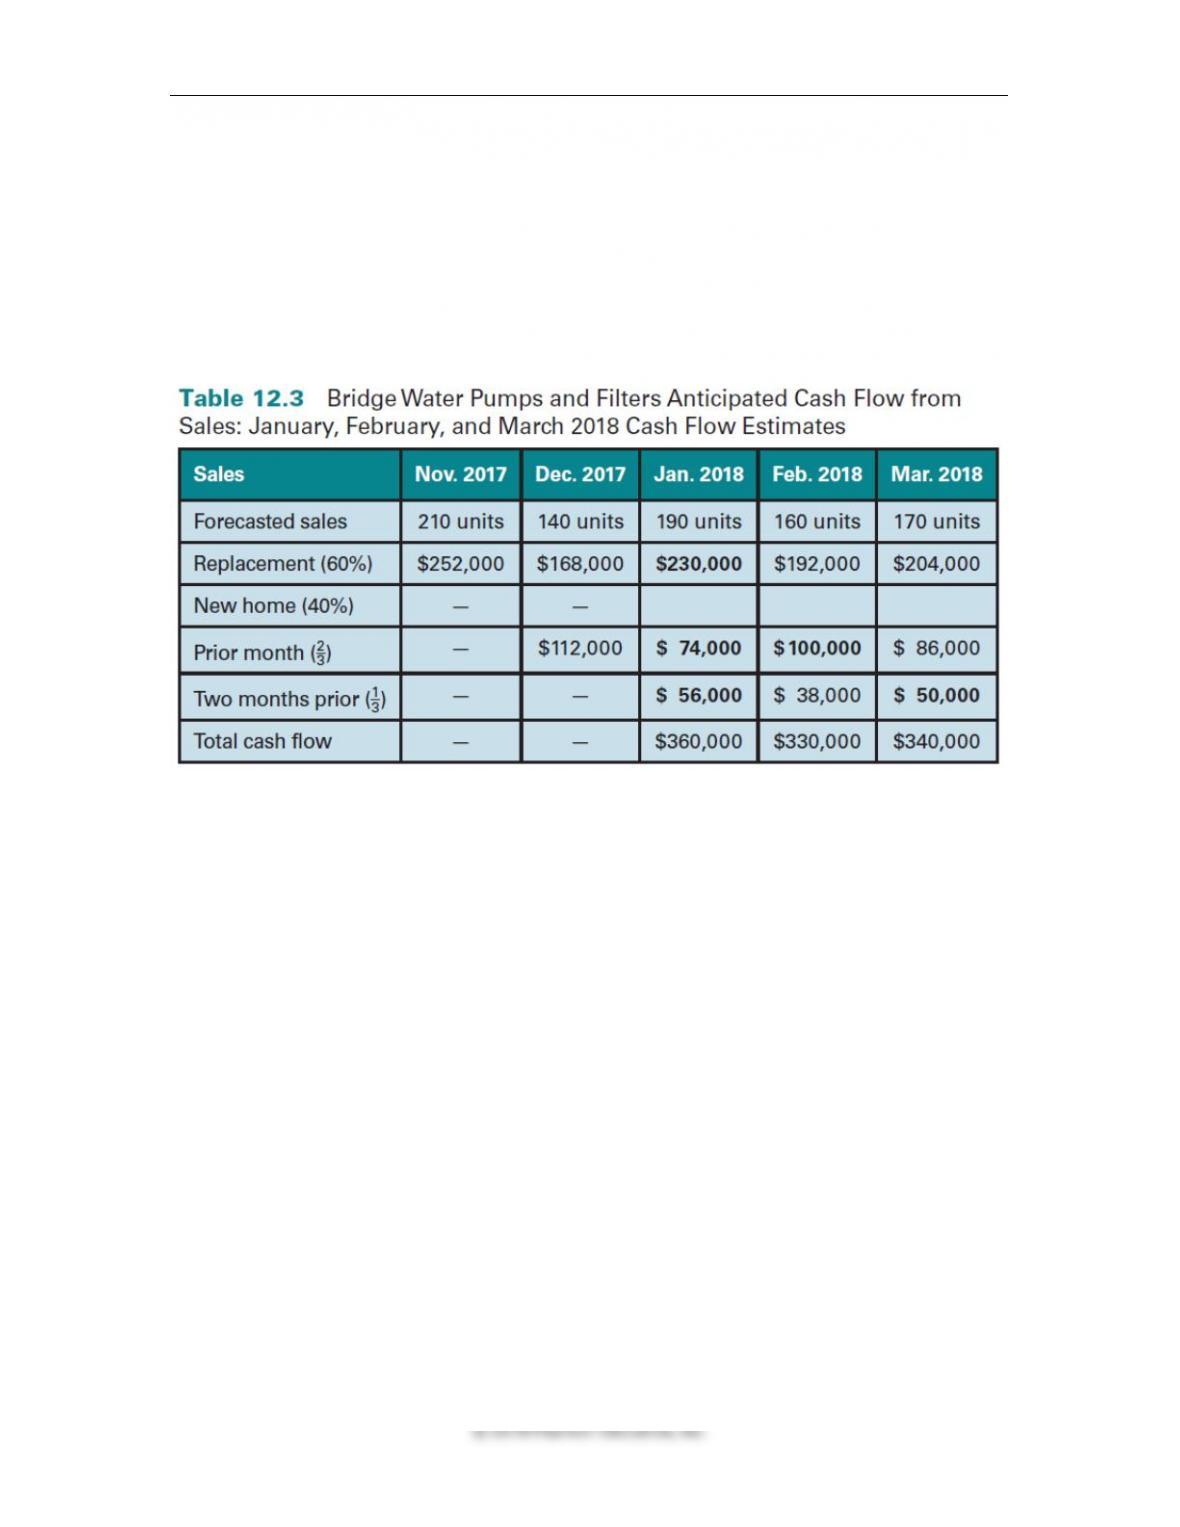
It is quite common for firms to collect some of their receivables in the two months following the
sale, i.e., November 2017’s credit sales will be partially collected in December and January.
Table 12.3 presents an example of how the cash inflow from a firm’s forecasted sales are
allocated for the purpose of preparing a cash budget.
Managers often figure in a small percentage of the forecasted sales as bad debts when
preparing a cash budget.
Other Cash Receipts: Besides sales, which are the main contributor to a firm’s cash inflow, the
timing and magnitude of other occasional sources of cash such as asset sales, funds raised
through issuance and sale of securities, and income earned on investments (dividends, interest,
etc.) must be forecasted when preparing a cash budget.
12.3 Cash Outflow from Production (Slide 12-11)
The magnitude and timing of the various cash disbursements of a firm depend to a large extent
on its forecasted sales.
These cash outflow items include payments for raw materials, labor costs, overheads such as
utilities and rent, shipping costs, etc.
As in the case of sales, there is often a time lag between when the firm receives and records the
benefit, and when it actually makes the payment for it. The cash budget can be used as a handy
planning document to keep track of the projected disbursements.
Note: Students often assume that depreciation should be accounted for as a cash disbursement,
which is incorrect because depreciation is merely a tax write-off and not a cash outflow.

Chapter 12 ◼ Forecasting and Short-Term Financial Planning 399
statement) or total assets (balance sheet) for the coming year to develop pro forma financial
statements.
For example, let’s say that the cash balance for the prior year is $2 million and the total assets
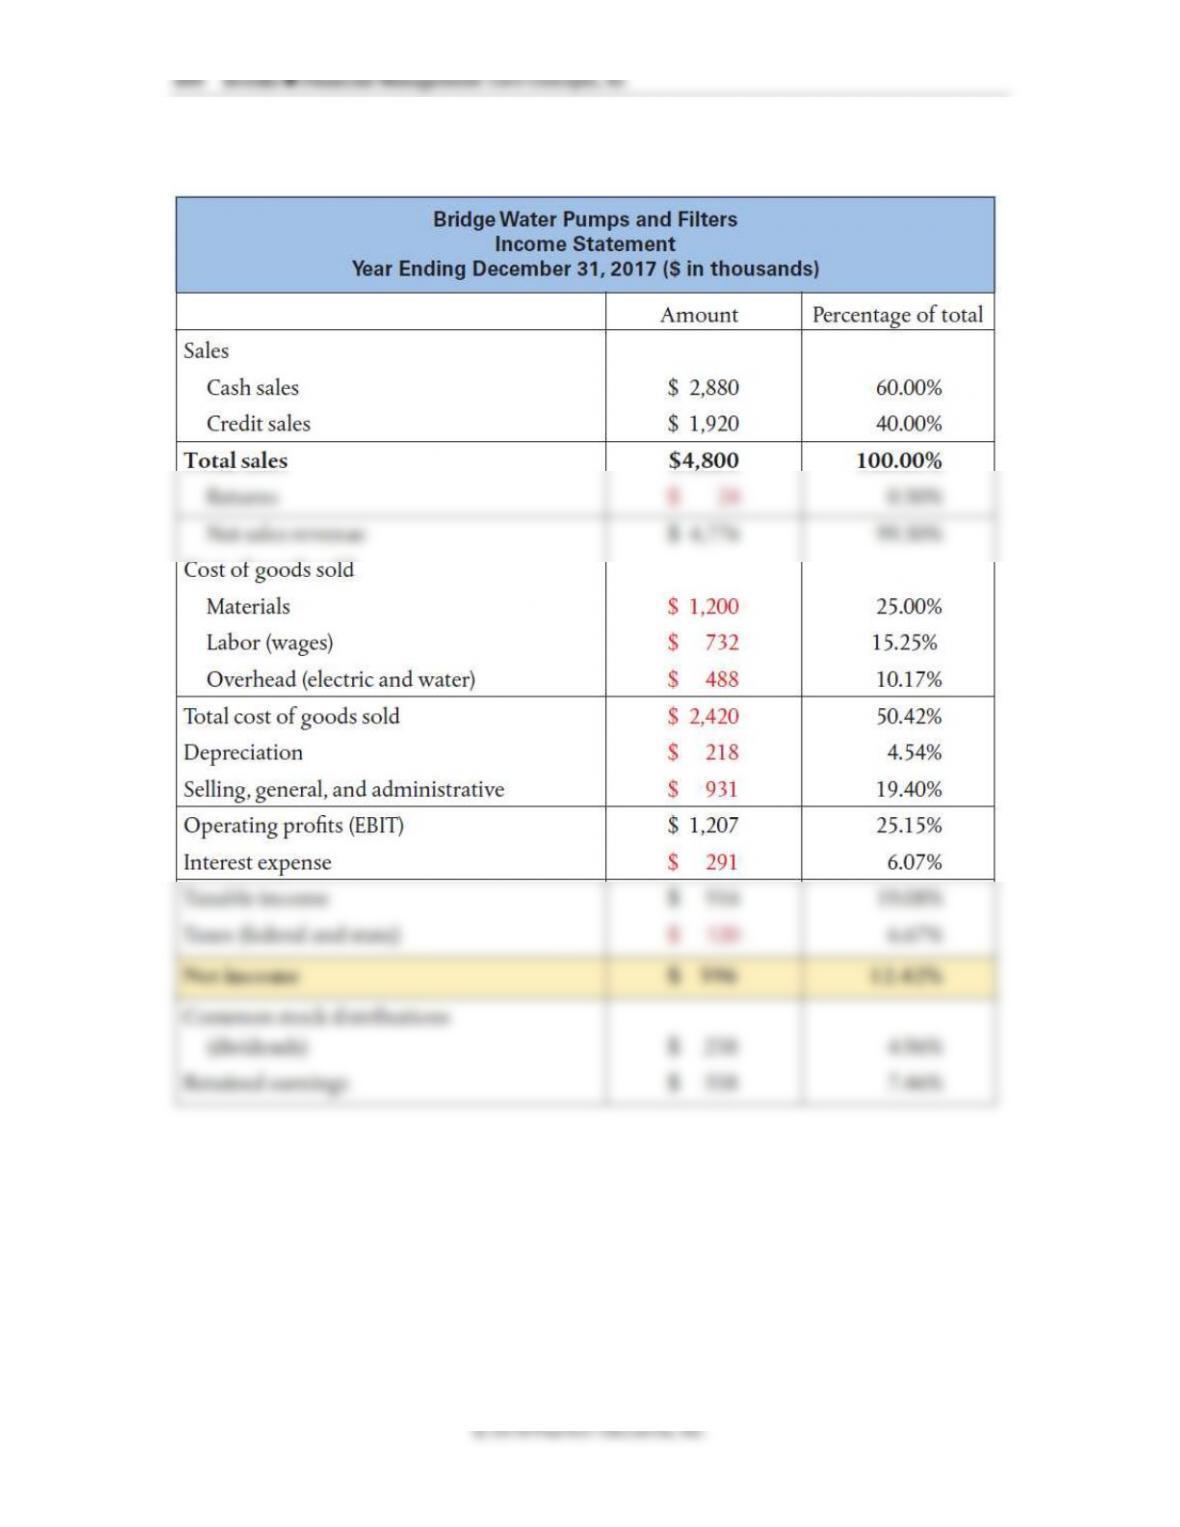
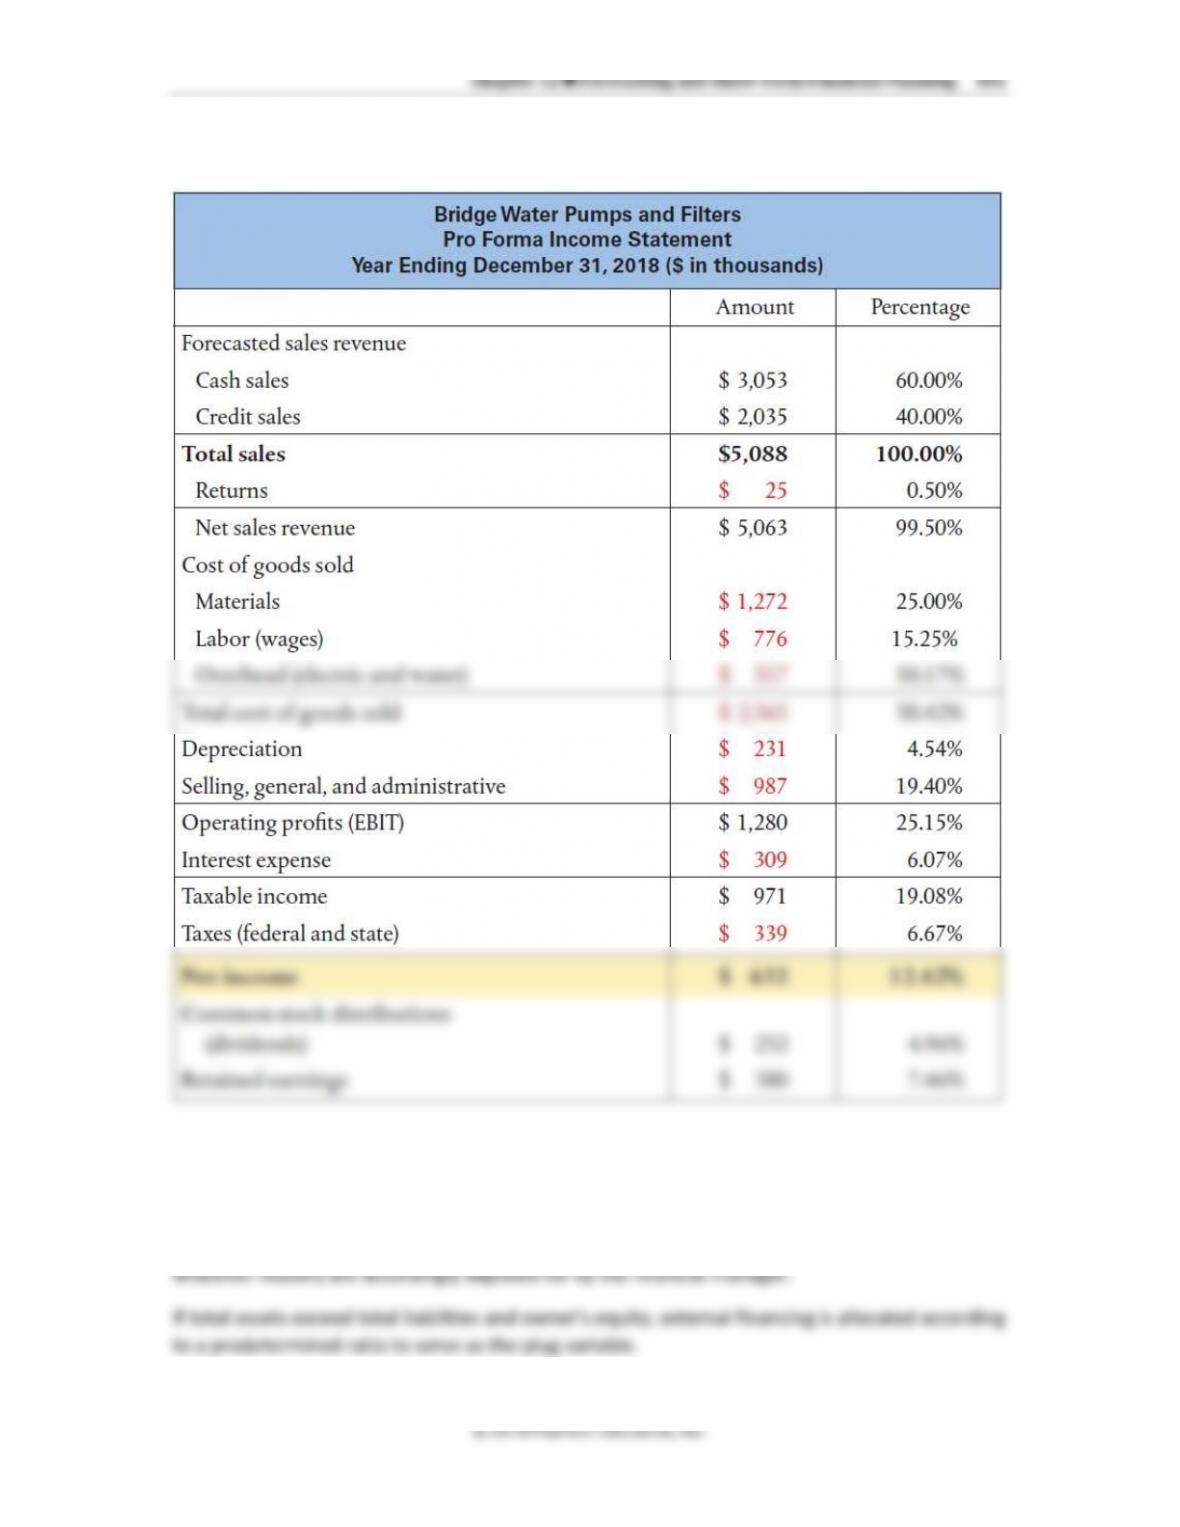
Pro Forma Income Statement: Figure 12.3 shows how each income statement item is
expressed as a percentage of sales.
Figure 12.4, shows how the pro forma income statement is developed, i.e., by multiplying the
percentages of each item to sales by the forecasted sales for the next period.
This approach, although a good first step, can be considered too simplistic in reality because
many financial statement items do not vary proportionately with sales. In particular,
depreciation decreases over time and cost of goods sold often declines due to economies of
scale.
The manager would have to fine-tune the forecasted values to make them more in line with
reality.

Chapter 12 ◼ Forecasting and Short-Term Financial Planning 403
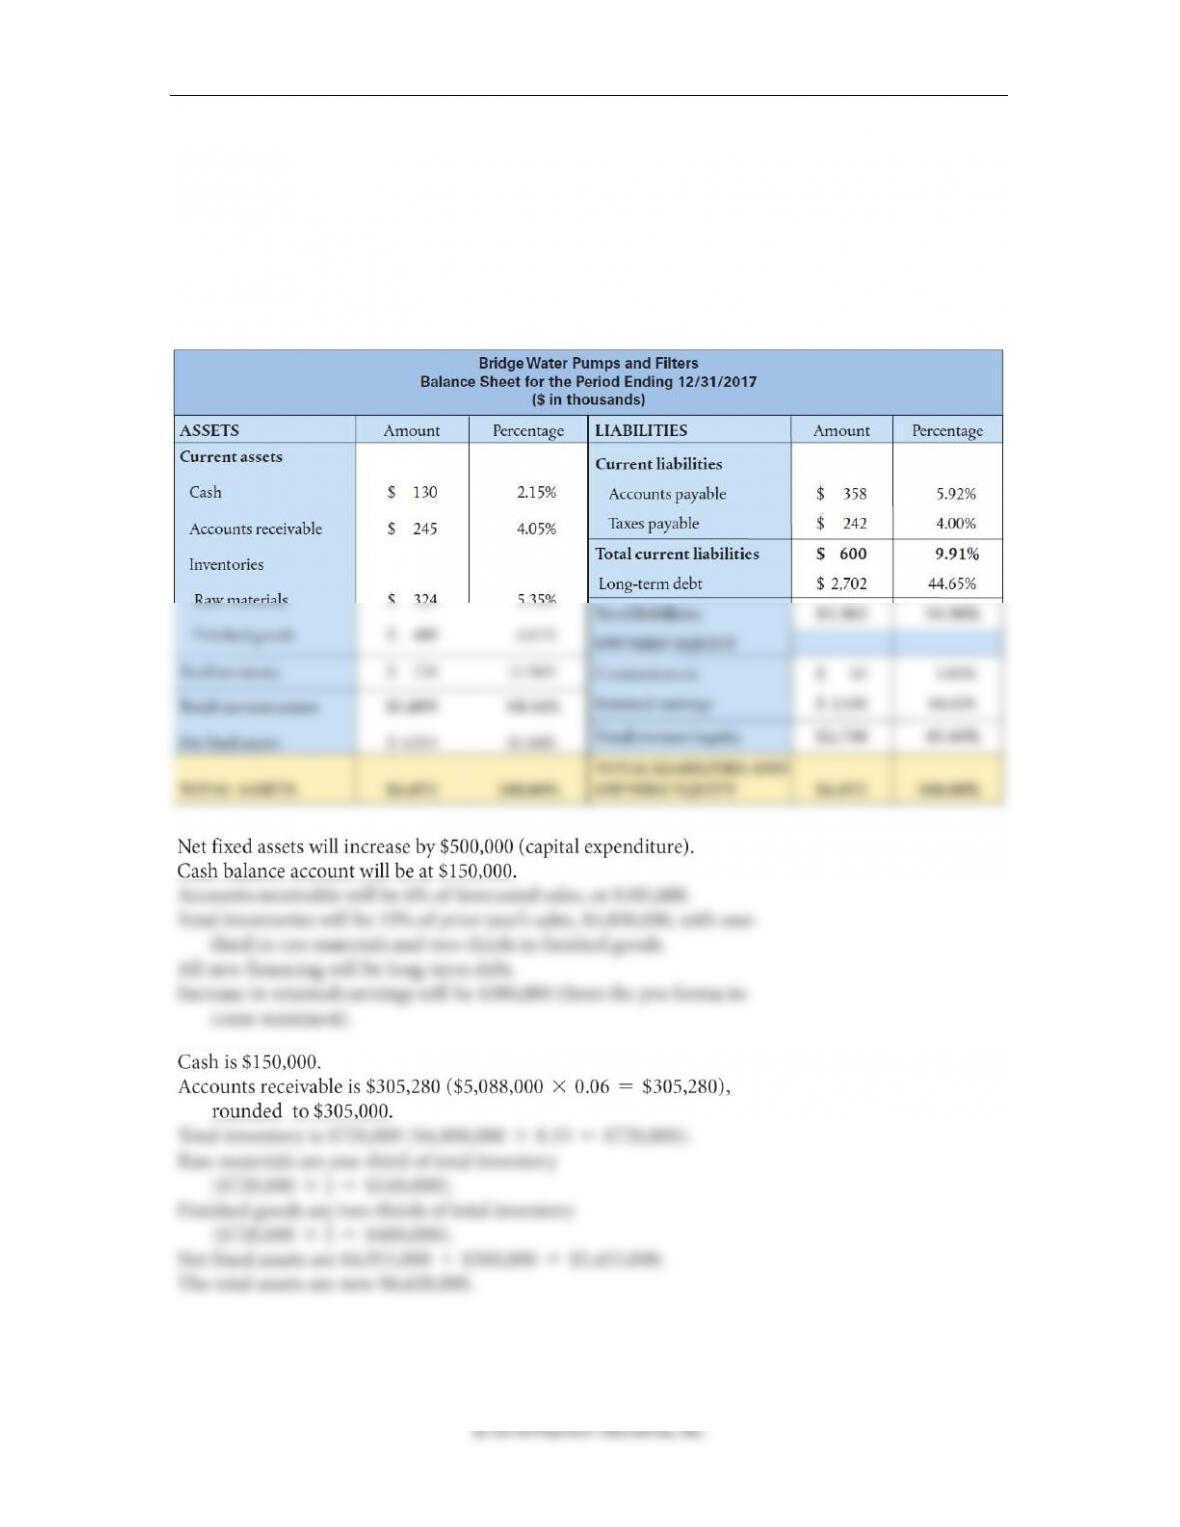
Figure 12.5 shows the balance sheet items of Bridge Water Pumps and Filters, expressed as a
percentage of total assets.
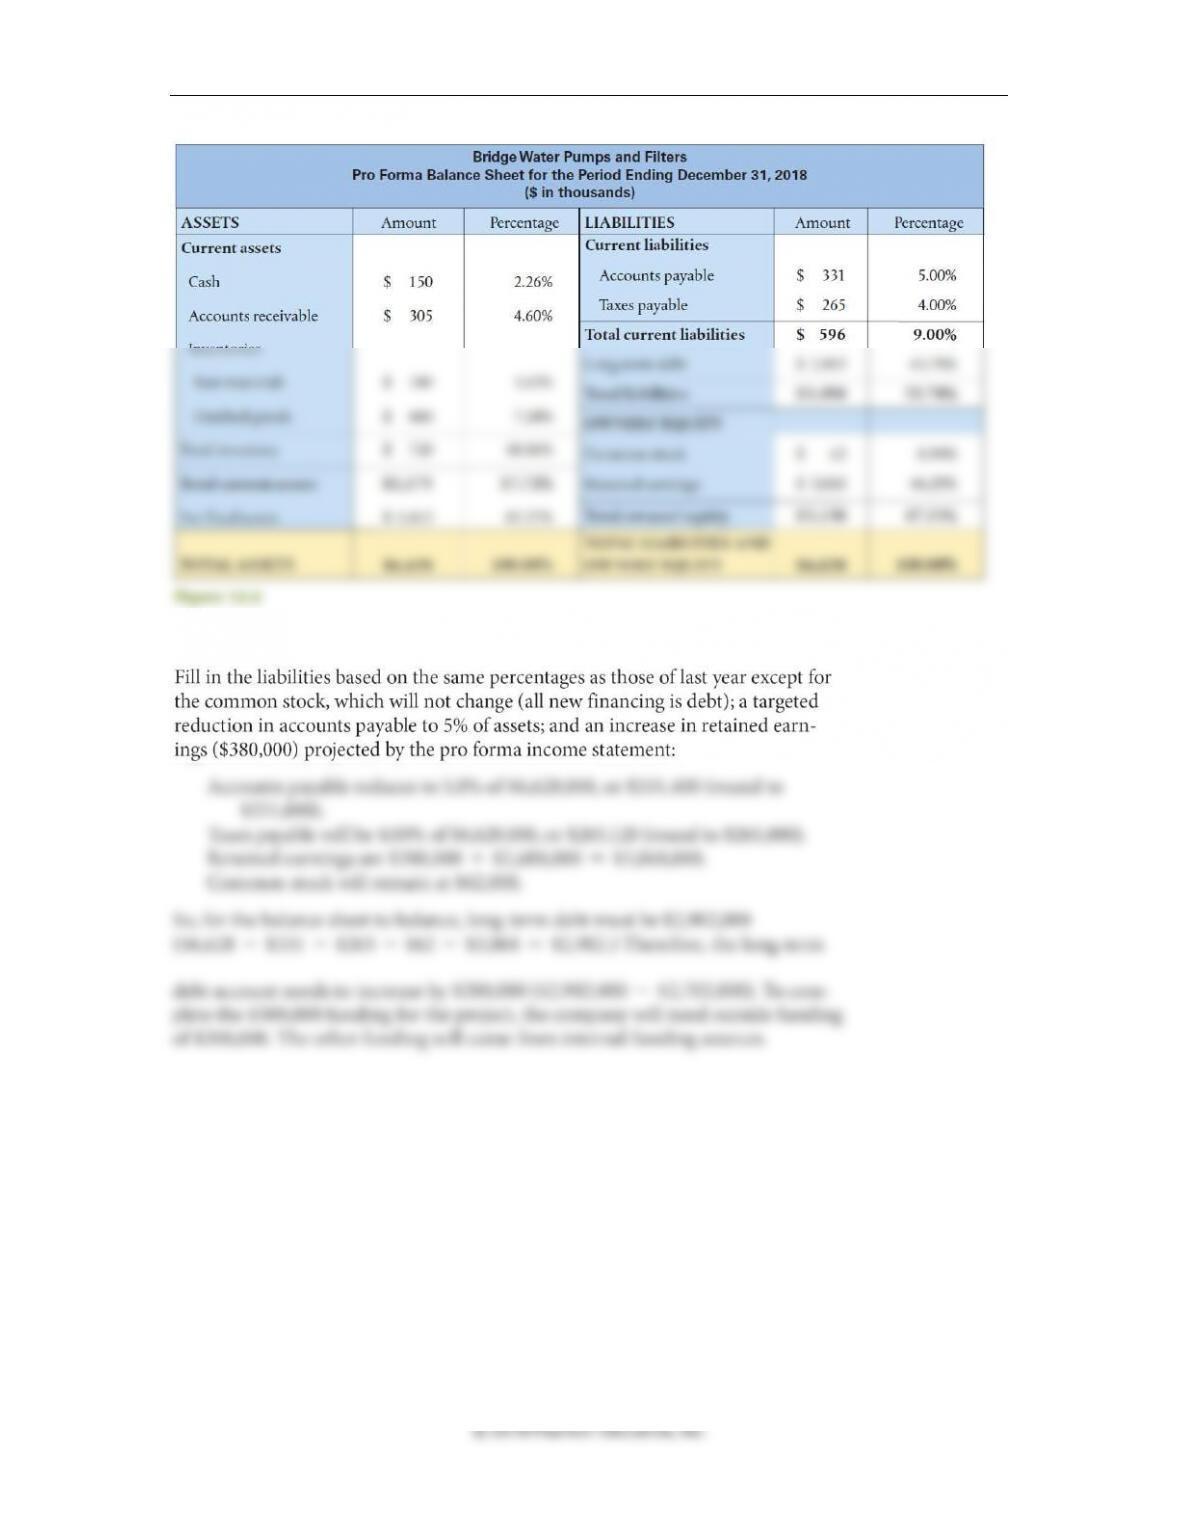
Based on the following assumptions, a pro forma balance sheet is developed in Figure 12.6.
Figure 12.5
404 Brooks ◼ Financial Management: Core Concepts, 4e
© 2018 Pearson Education, Inc.
Key calculations include:
Chapter 12 ◼ Forecasting and Short-Term Financial Planning 405
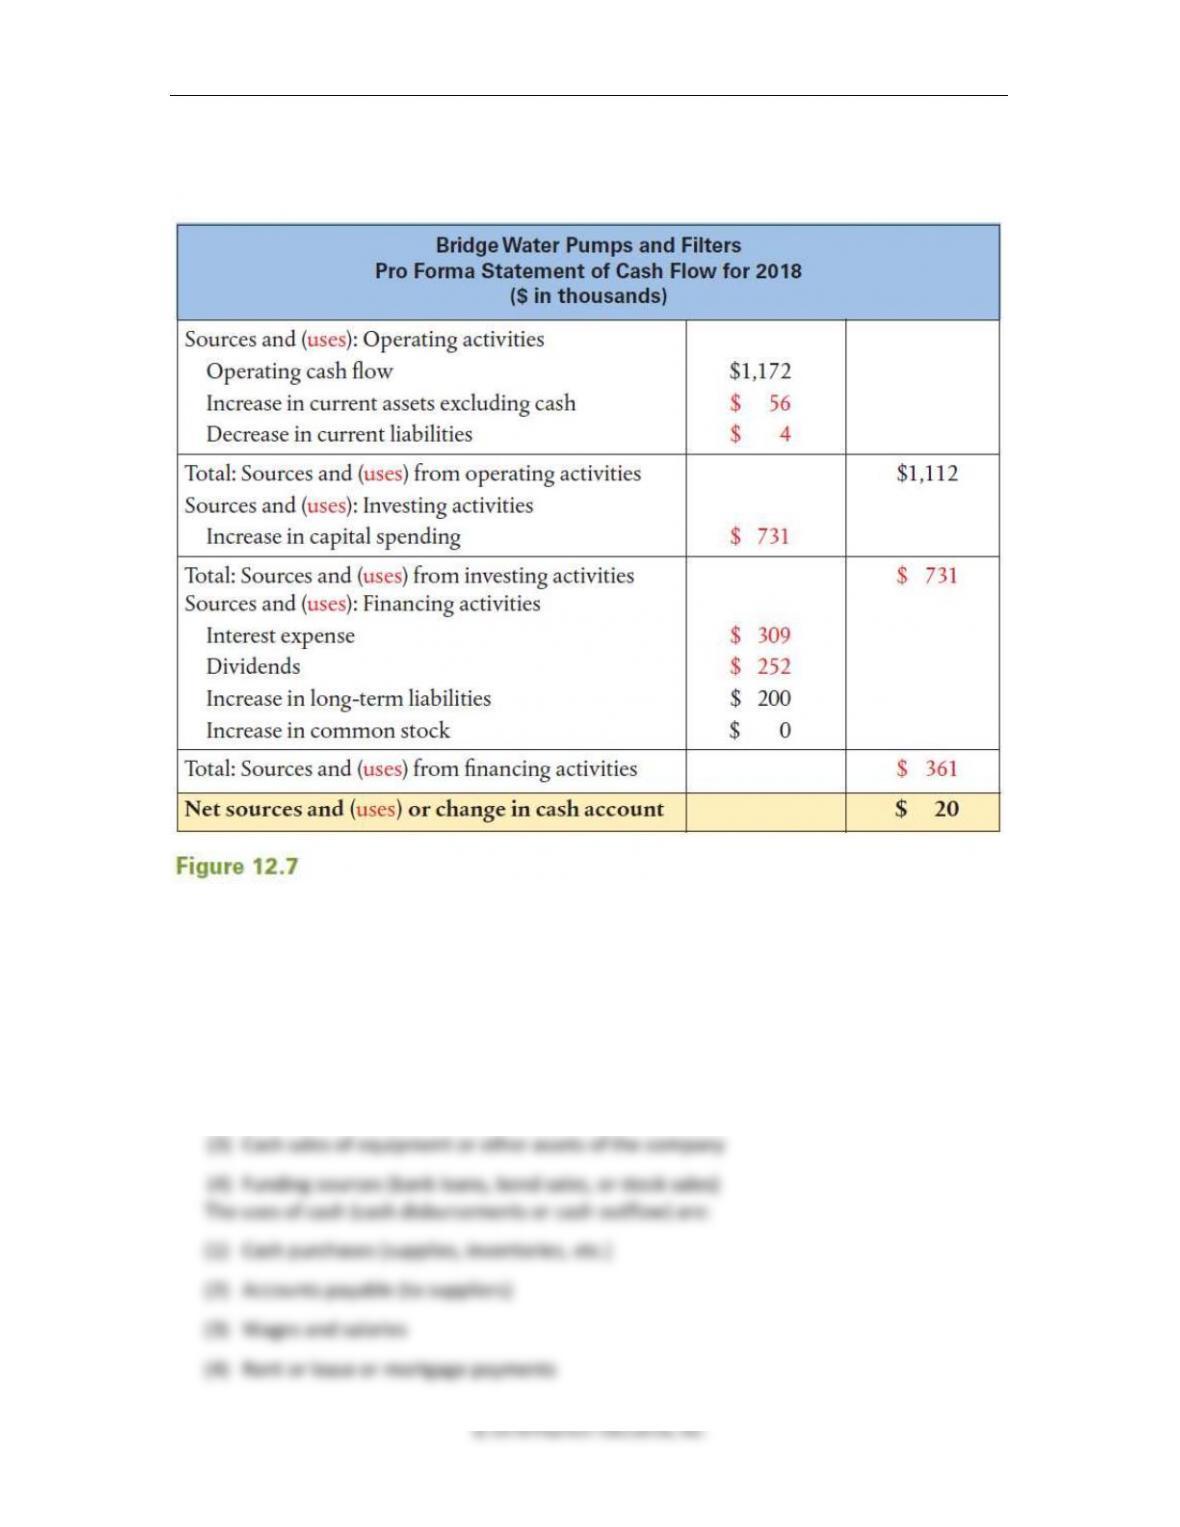
Finally, the pro forma cash flow statement (Figure 12.7) is prepared to tie together all the
changes in operating, investment, and financing cash flows.
Questions
1. What are a company’s main sources of cash for a company? What are a company’s main
uses of cash?
The sources of cash (cash receipts or cash inflow) are as follows:
(1) Cash sales from products and services
(2) Payments received on accounts receivables (mainly credit sales)
© 2018 Pearson Education, Inc.
2. What are two key timing issues with respect to predicting cash inflow for a sales forecast?
3. What are some of the production costs that are tied to the sales forecast?
4. What is a line of credit? Why would a bank require a company with a line of credit to have
a zero balance in its line of credit for at least sixty days a year?
5. What is the difference between a secured and an unsecured loan?
6. Why can excess cash be an opportunity cost for a company?
7. If a pro forma income statement has 5% for the net income line, what does this mean in
terms of a company’s total sales and per dollar sales?
8. When preparing a pro forma income statement, why would a finance manager make
changes in the prior year’s percentages for different line items? Give an example of a line
item that you would expect to vary in percentage every year as sales forecasts grow.
408 Brooks ◼ Financial Management: Core Concepts, 4e
Prepping for Exams
1. a
2. c
Problems
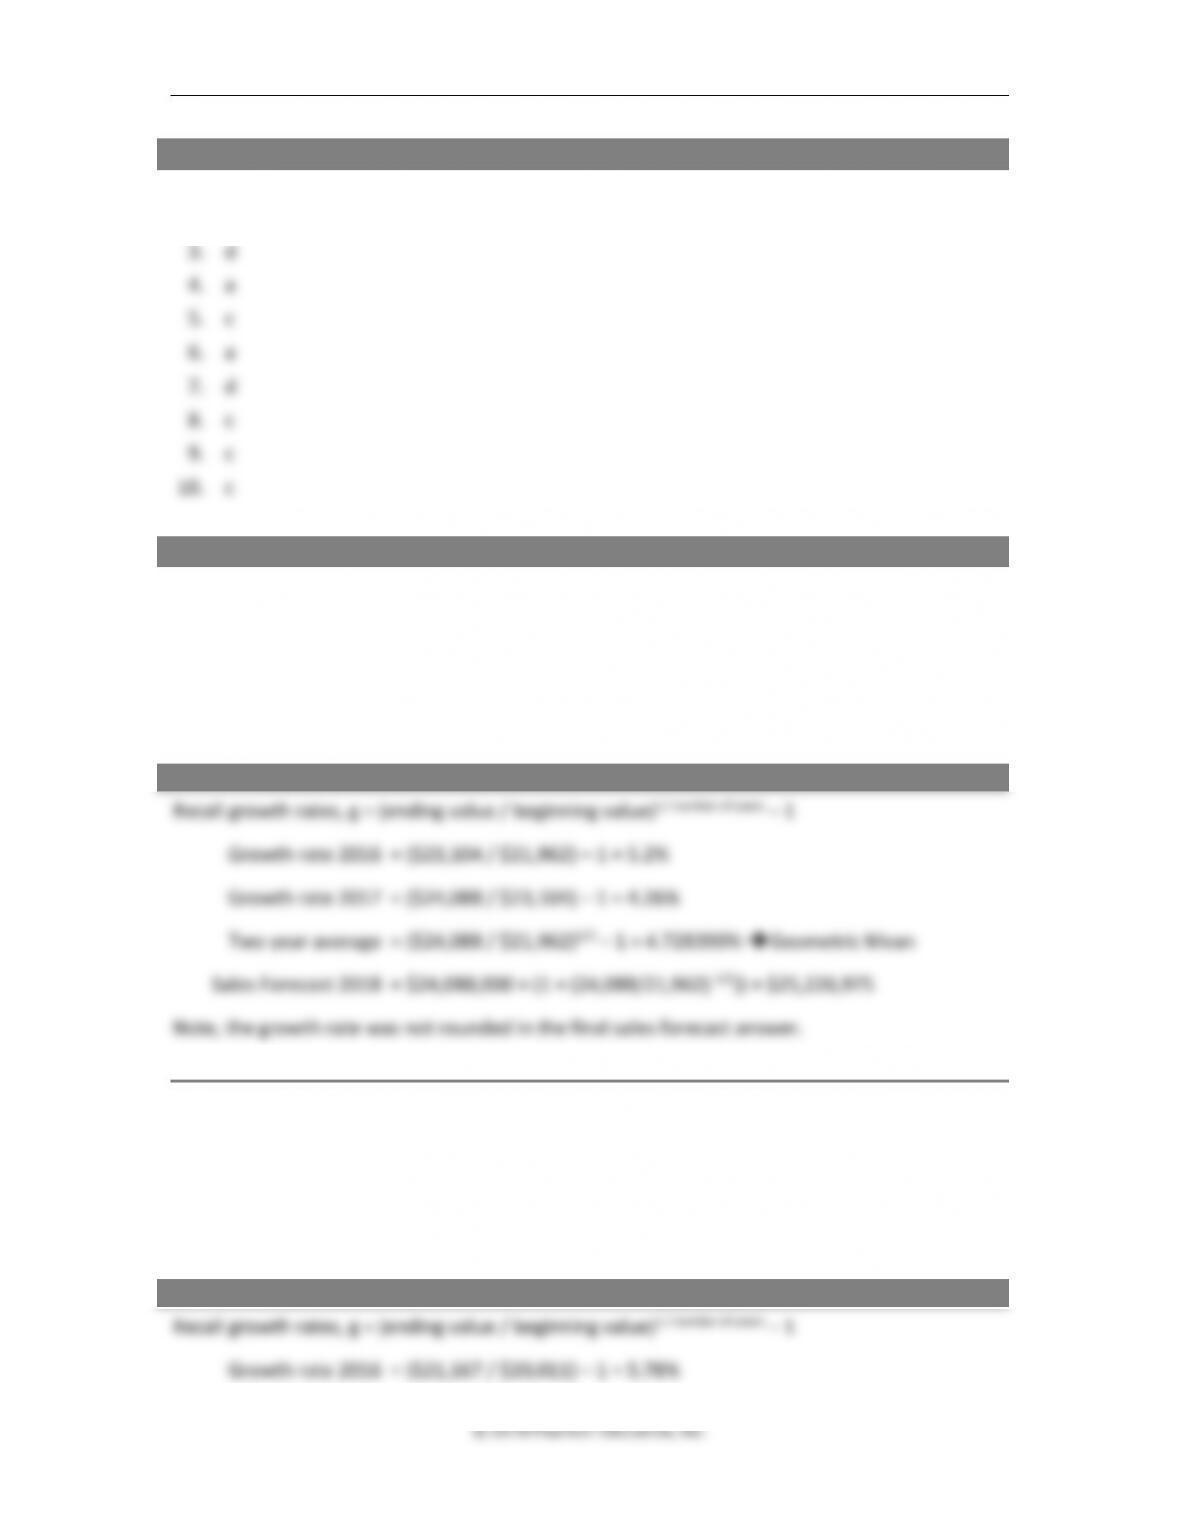
1. Sales forecasts. For the prior three years, sales for National Beverage Company have been
$21,962,000 (2015), $23,104,000 (2016), and $24,088,000 (2017). The company uses the
prior two year’s average growth rate to predict the coming year’s sales. What were the sales
growth rates for 2016 and 2017? What is the expected sales growth rate using a two-year
average for 2018? What is the sales forecast for 2018?
Remind students that this would be the geometric mean!
ANSWER
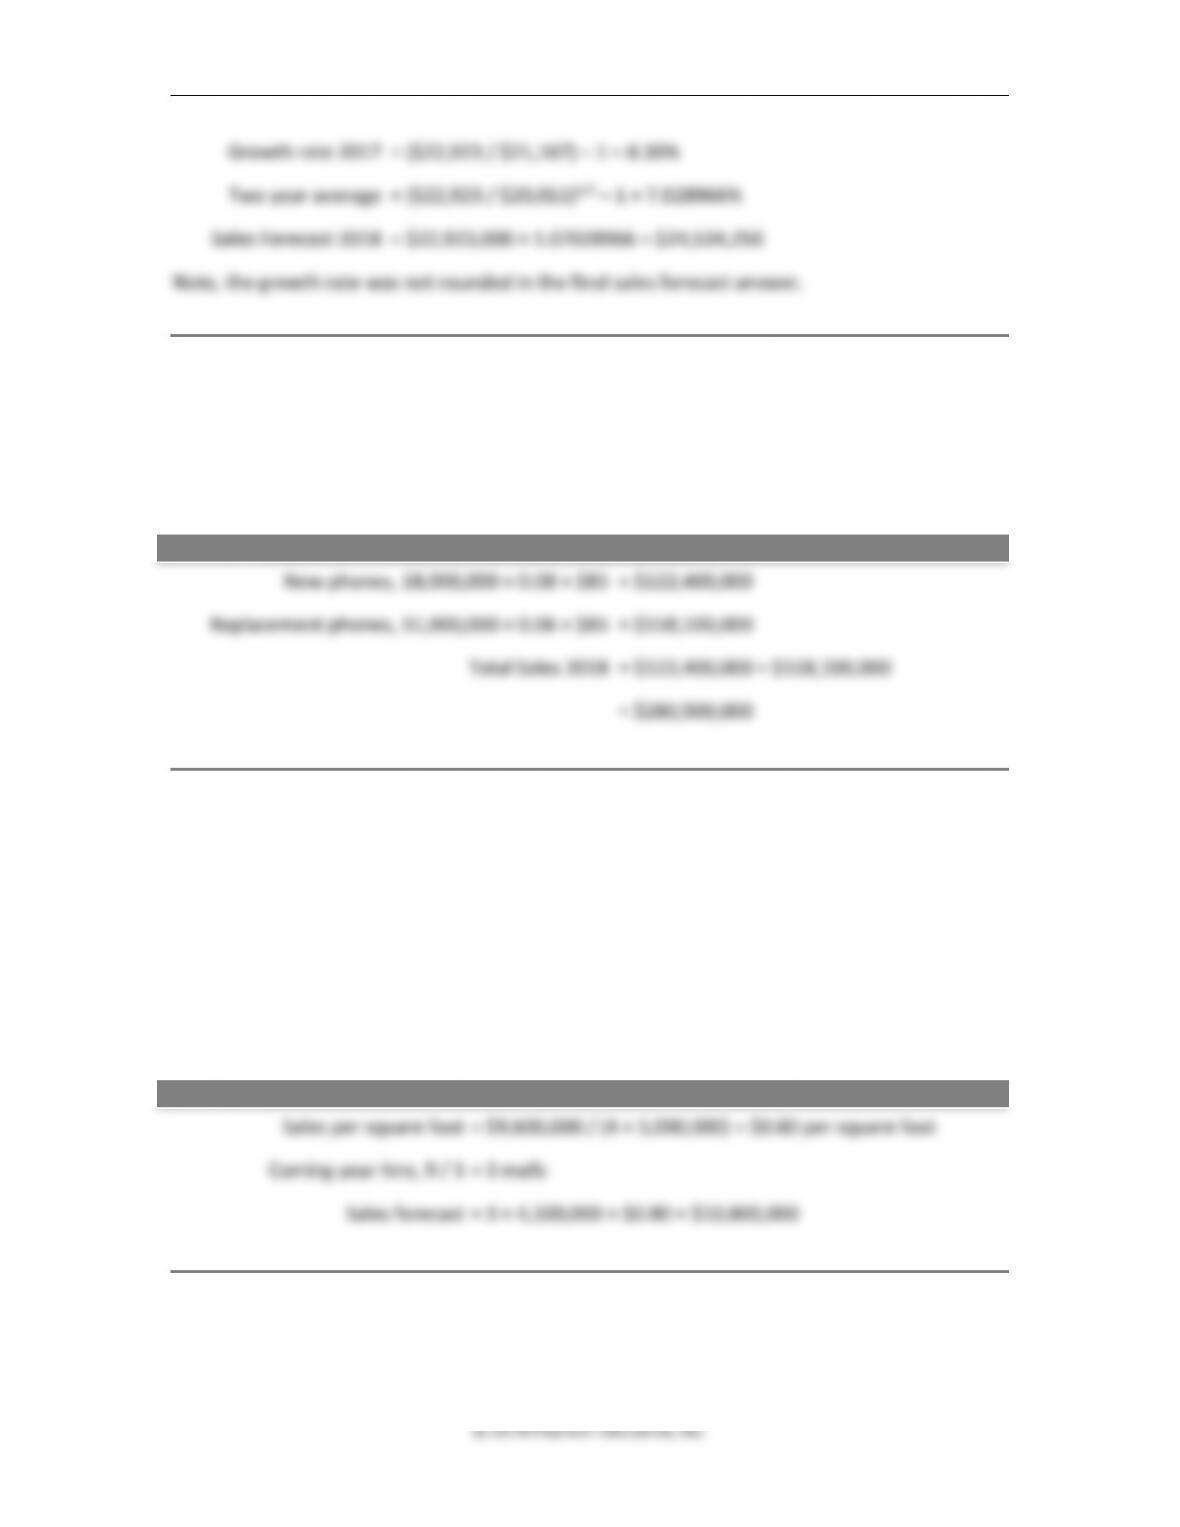
2. Sales forecasts. For the prior three years, sales for California Cement Company have been
$20,011,000 (2015), $21,167,000 (2016), and $22,923,000 (2017). CCC uses the prior two
year’s average growth rate to predict the coming year’s sales. What were the sales growth
rates for 2016 and 2017? What is the expected sales growth rate using a two-year average
for 2018? What is the sales forecast for 2018?
ANSWER
Chapter 12 ◼ Forecasting and Short-Term Financial Planning 409
© 2018 Pearson Education, Inc.
Growth rate 2017 = ($22,923 / $21,167) – 1 = 8.30%
Two year average = ($22,923 / $20,011)1/2 – 1 = 7.028966%
Sales Forecast 2018 = $22,923,000 × 1.07028966 = $24,534,250
Note, the growth rate was not rounded in the final sales forecast answer.
3. Sales forecast based on external data. Raspberry Phones uses external data to forecast the
coming year’s sales. The company has 8% of all new-phone sales in the United States and 6%
of all replacement-phones sales. Industry forecasts predict an additional 18 million new–
phone buyers and 31 million replacement-phone buyers in 2018. If the average Raspberry
phone costs $85, what sales revenues is the company forecasting for 2018?
ANSWER
4. Sales forecast based on external data. Nelson Heating and Ventilating Company estimates
the coming year’s sales revenue based on external data. The company’s main business is
new shopping mall construction, and it uses the square footage of each mall as a “yardstick”
for many financial statements and projections. The company does business in four Midwest
states. Last year, it completed heating and ventilating systems on four shopping malls with
an average size of 3,000,000 square feet for sales revenues of $9,600,000. Nelson is the
primary contractor for one-third of the new malls in the four- state area. This coming year,
nine new malls are being built with an average footage of 4,500,000 square feet. What is
Nelson’s anticipated sales revenue for the coming year?
ANSWER
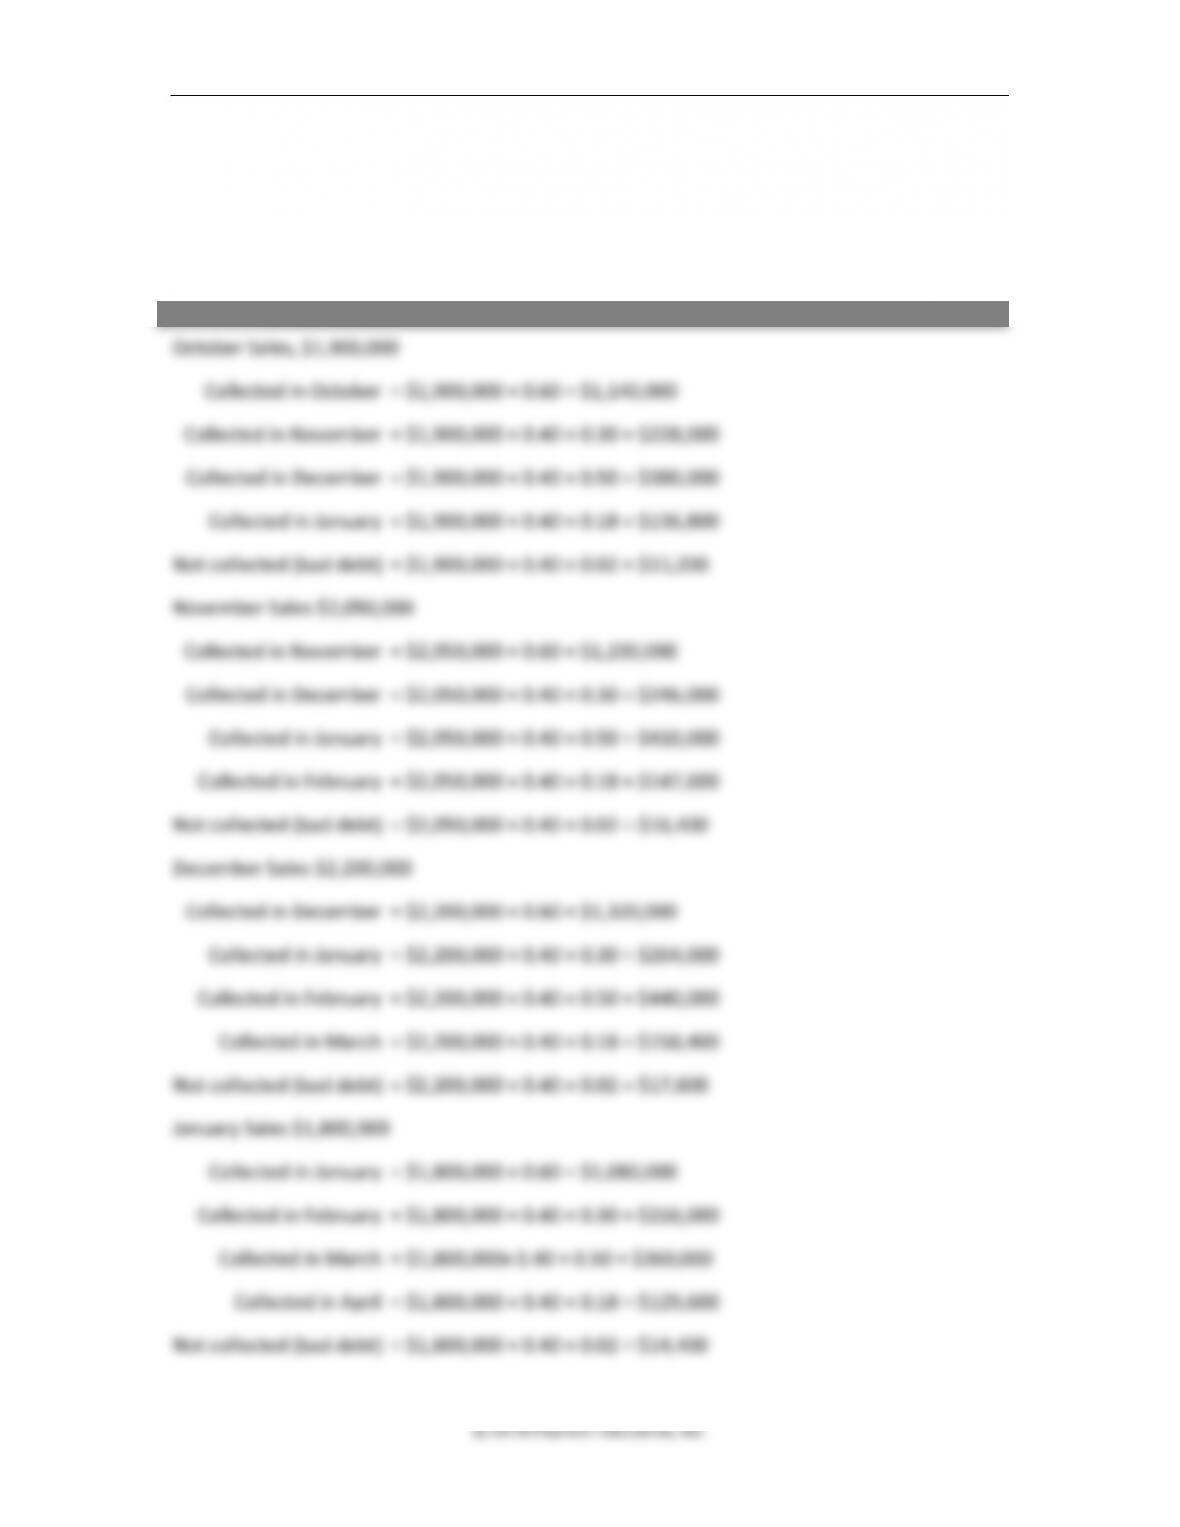
5. Sales receipts. National Beverage Company anticipates the following first-quarter sales for
2018: $1,800,000 (January), $1,600,000 (February), and $2,100,000 (March). It posted the
410 Brooks ◼ Financial Management: Core Concepts, 4e
following sales figures for the last quarter of 2017: $1,900,000 (October), $2,050,000
(November), and $2,200,000 (December). The company sells 40% of its products on credit,
and 60% are cash sales. The company collects credit sales as follows: 30% in the following
month, 50% two months later, and 18% three months later with 2% defaults. What are the
anticipated cash inflows for the first quarter of 2018?
ANSWER
Chapter 12 ◼ Forecasting and Short-Term Financial Planning 411
© 2018 Pearson Education, Inc.
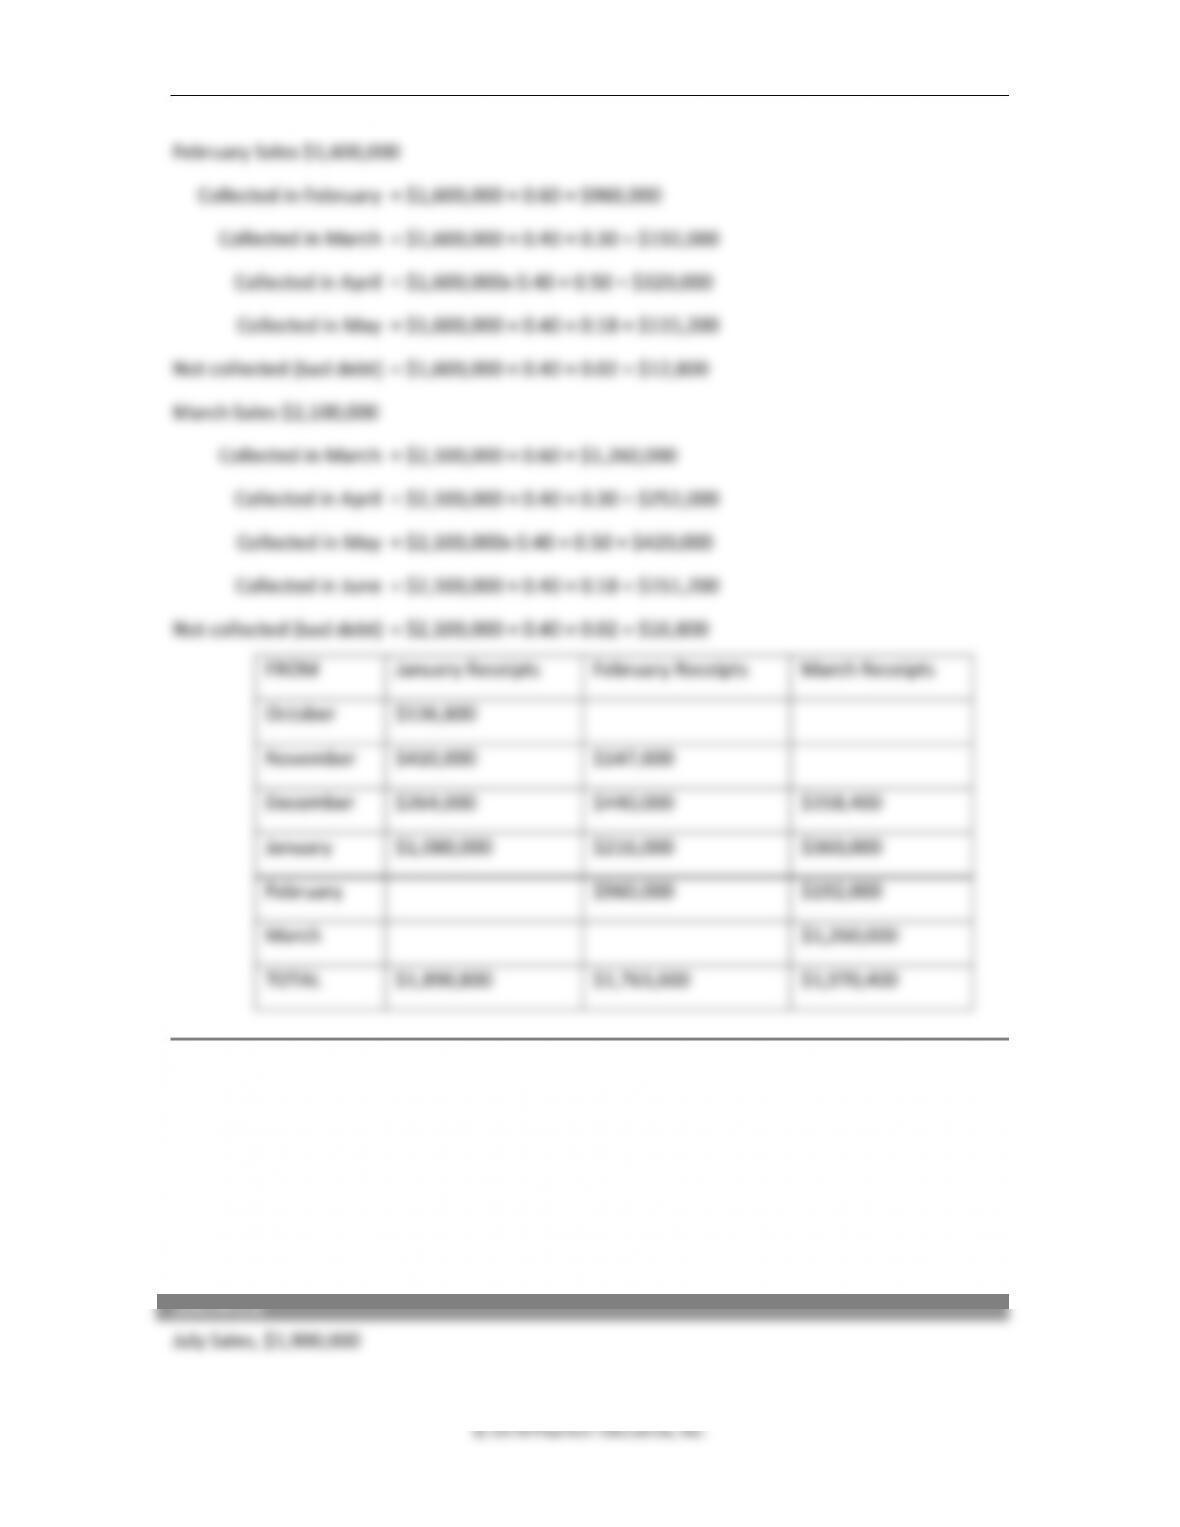
February Sales $1,600,000
Collected in February = $1,600,000 × 0.60 = $960,000
Collected in March = $1,600,000 × 0.40 × 0.30 = $192,000
Collected in April = $1,600,000x 0.40 × 0.50 = $320,000
Collected in May = $1,600,000 × 0.40 × 0.18 = $115,200
Not collected (bad debt) = $1,600,000 × 0.40 × 0.02 = $12,800
March Sales $2,100,000
Collected in March = $2,100,000 × 0.60 = $1,260,000
Collected in April = $2,100,000 × 0.40 × 0.30 = $252,000
Collected in May = $2,100,000x 0.40 × 0.50 = $420,000
Collected in June = $2,100,000 × 0.40 × 0.18 = $151,200
Not collected (bad debt) = $2,100,000 × 0.40 × 0.02 = $16,800
FROM
January Receipts
February Receipts
March Receipts
October
$136,800
November
$410,000
$147,600
December
$264,000
$440,000
$158,400
January
$1,080,000
$216,000
$360,000
February
$960,000
$192,000
March
$1,260,000
TOTAL
$1,890,800
$1,763,600
$1,970,400
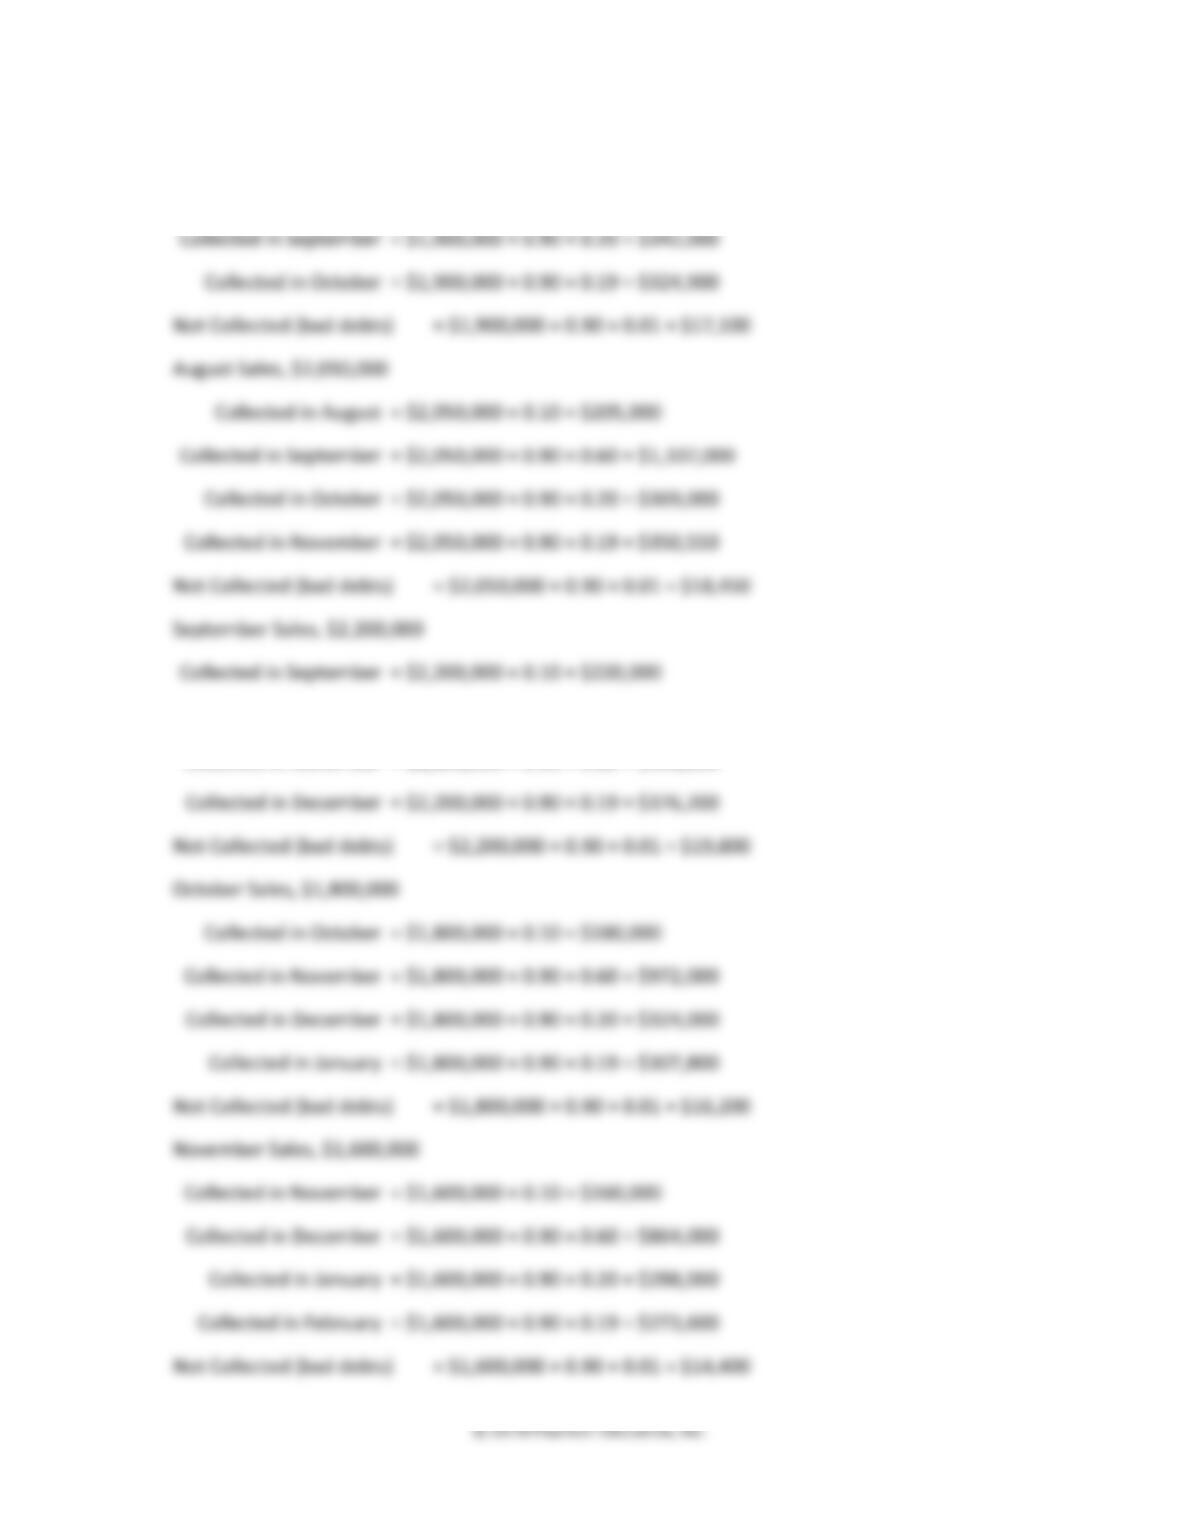
6. Sales receipts. California Cement Company anticipates the following fourth-quarter sales for
2018: $1,800,000 (October), $1,600,000 (November), and $2,100,000 (December). It posted
the following sales figures for the third quarter of 2018: $1,900,000 (July), $2,050,000
(August), and $2,200,000 (September). The company sells 90% of its products on credit, and
10% are cash sales. The credit sales are collected as follows: 60% in the following month,
20% two months later, 19% three months later, with 1% defaults. What are the anticipated
cash inflows for the last quarter of 2018?
412 Brooks ◼ Financial Management: Core Concepts, 4e
Collected in July = $1,900,000 × 0.10 = $190,000
Collected in August = $1,900,000 × 0.90 × 0.60 = $1,026,000
Collected in October = $2,200,000 × 0.90 × 0.60 = $1,188,000
Collected in November = $2,200,000 × 0.90 × 0.20 = $396,000

Chapter 12 ◼ Forecasting and Short-Term Financial Planning 413
© 2018 Pearson Education, Inc.
December Sales, $2,100,000
Collected in December = $2,100,000 × 0.10 = $210,000
Collected in January = $2,100,000 × 0.90 × 0.60 = $1,134,000
Collected in February = $2,100,000 × 0.90 × 0.20 = $378,000
Collected in March = $2,100,000 × 0.90 × 0.19 = $359,100
Not Collected (bad debts) = $2,100,000 × 0.90 × 0.01 = $18,900
FROM
October Receipts
November Receipts
December Receipts
July
$324,900
August
$369,000
$350,550
September
$1,188,000
$396,000
$376,200
October
$180,000
$972,000
$324,000
November
$160,000
$864,000
December
$210,000
TOTAL
$2,061,900
$1,878,550
$1,774,200