Chapter 10 ◼ Cash Flow Estimation 349
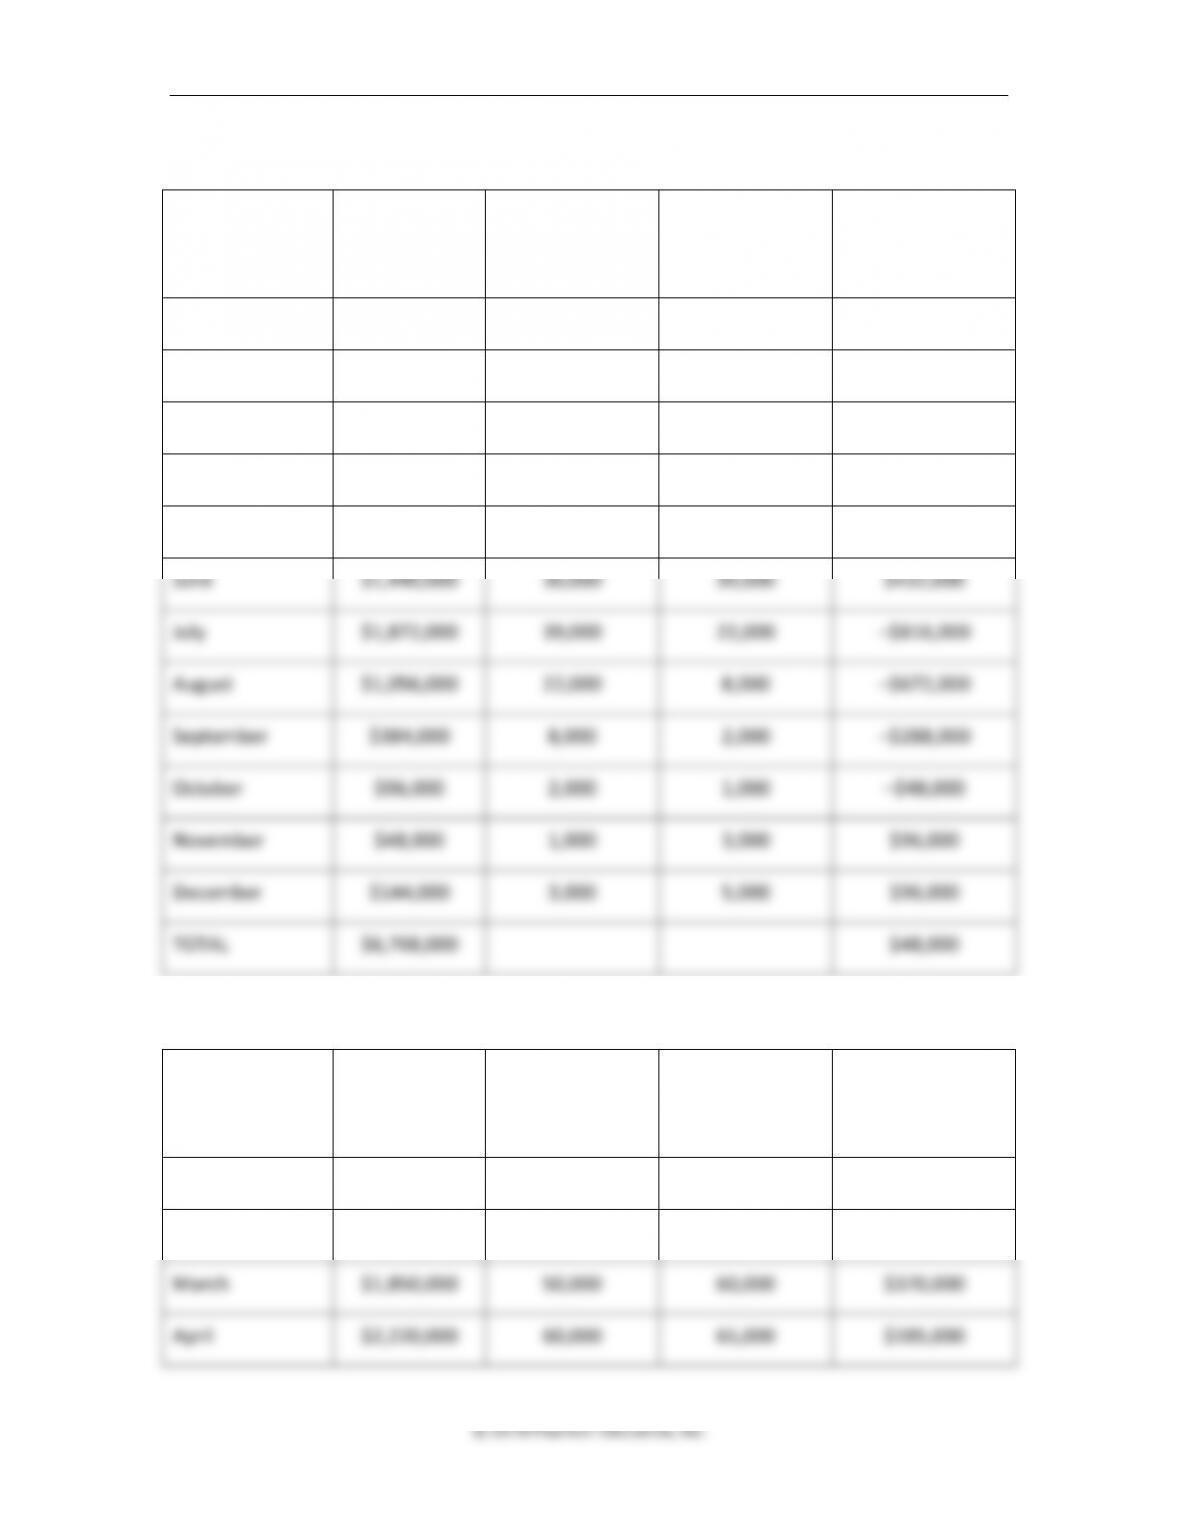
All-Terrain Tire Working Capital and COGS
Month
Anticipated
COGS
Beginning
Inventory
Balance
Ending Inventory
Balance
Working Capital
Increase
January
$192,000
4,000
5,000
$48,000
February
$240,000
5,000
7,000
$96,000
March
$336,000
7,000
8,000
$48,000
April
$384,000
8,000
12,000
$192,000
May
$576,000
12,000
30,000
$864,000
June
$1,440,000
30,000
39,000
$432,000
July
$1,872,000
39,000
22,000
–$816,000
August
$1,056,000
22,000
8,000
–$672,000
September
$384,000
8,000
2,000
–$288,000
October
$96,000
2,000
1,000
–$48,000
November
$48,000
1,000
3,000
$96,000
December
$144,000
3,000
5,000
$96,000
TOTAL
$6,768,000
$48,000
All-Purpose Tire Working Capital and COGS
Month
Anticipated
COGS
Beginning
Inventory
Balance
Ending Inventory
Balance
Working Capital
Increase
January
$2,220,000
60,000
54,000
–$222,000
February
$1,998,000
54,000
50,000
–$148,000
March
$1,850,000
50,000
60,000
$370,000
April
$2,220,000
60,000
65,000
$185,000
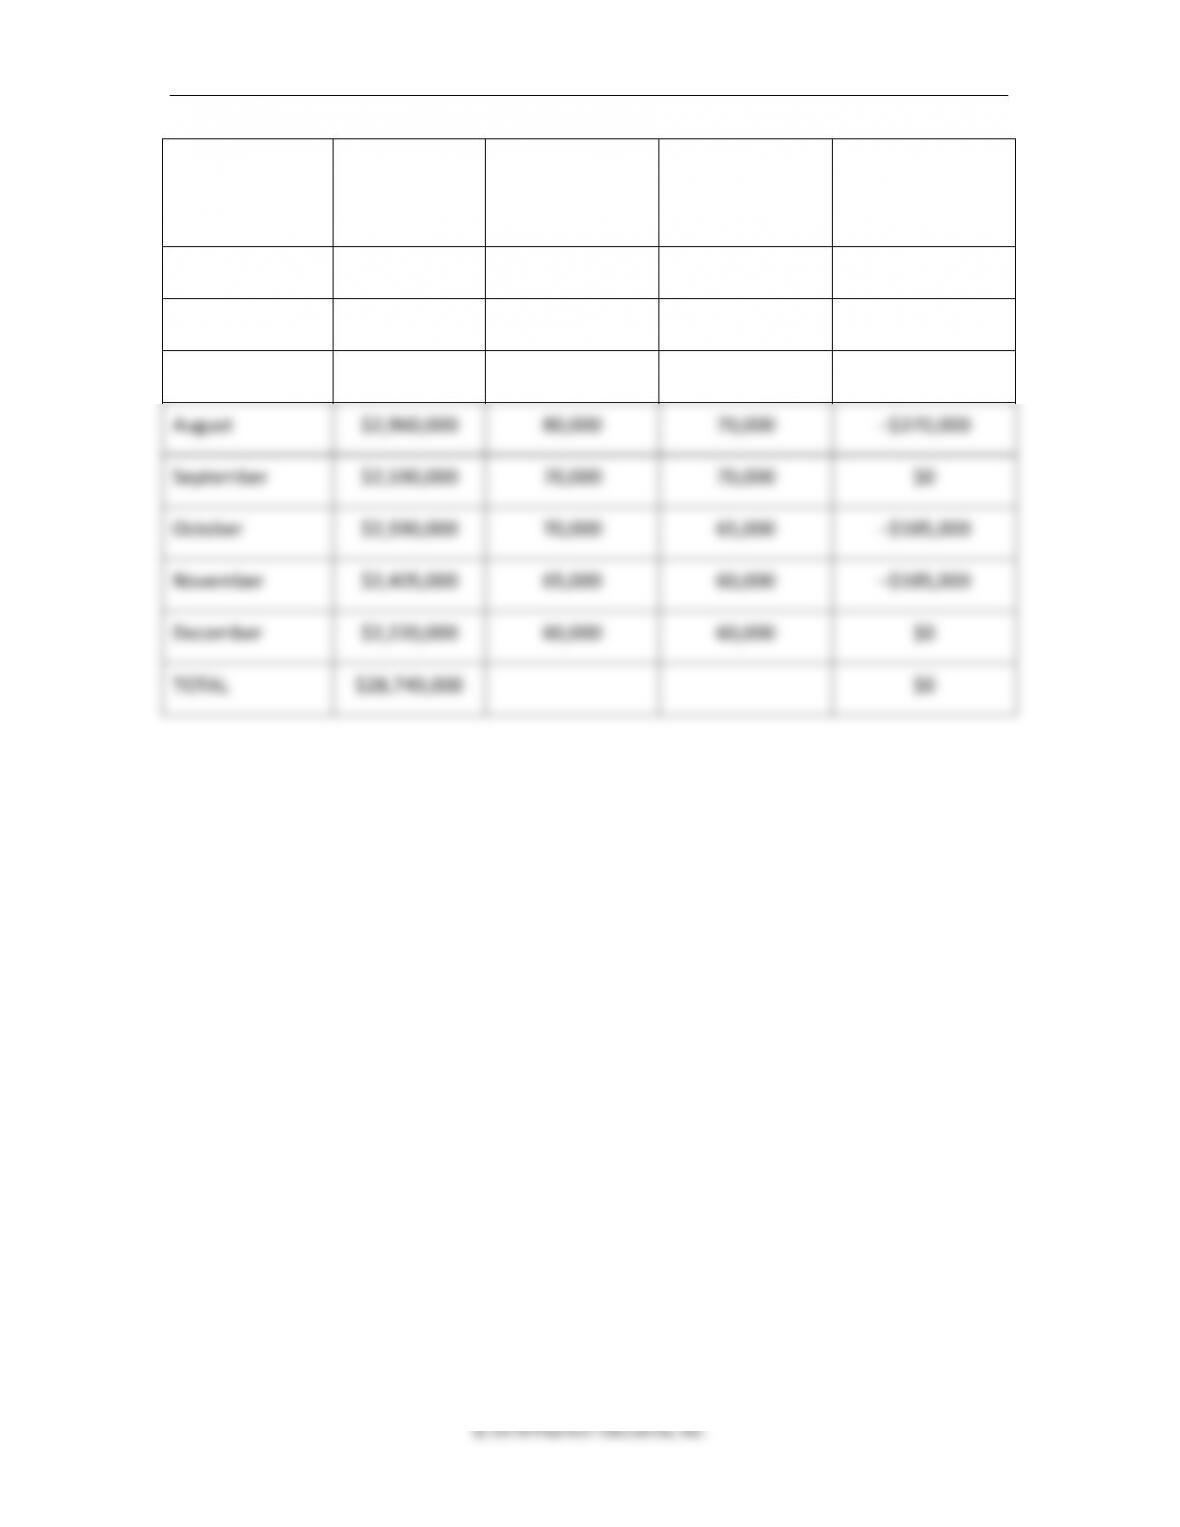
350 Brooks ◼ Financial Management: Core Concepts, 4e
Month
Anticipated
COGS
Beginning
Inventory
Balance
Ending Inventory
Balance
Working Capital
Increase
May
$2,405,000
65,000
68,000
$111,000
June
$2,516,000
68,000
75,000
$259,000
July
$2,775,000
75,000
80,000
$185,000
August
$2,960,000
80,000
70,000
–$370,000
September
$2,590,000
70,000
70,000
$0
October
$2,590,000
70,000
65,000
–$185,000
November
$2,405,000
65,000
60,000
–$185,000
December
$2,220,000
60,000
60,000
$0
TOTAL
$28,749,000
$0
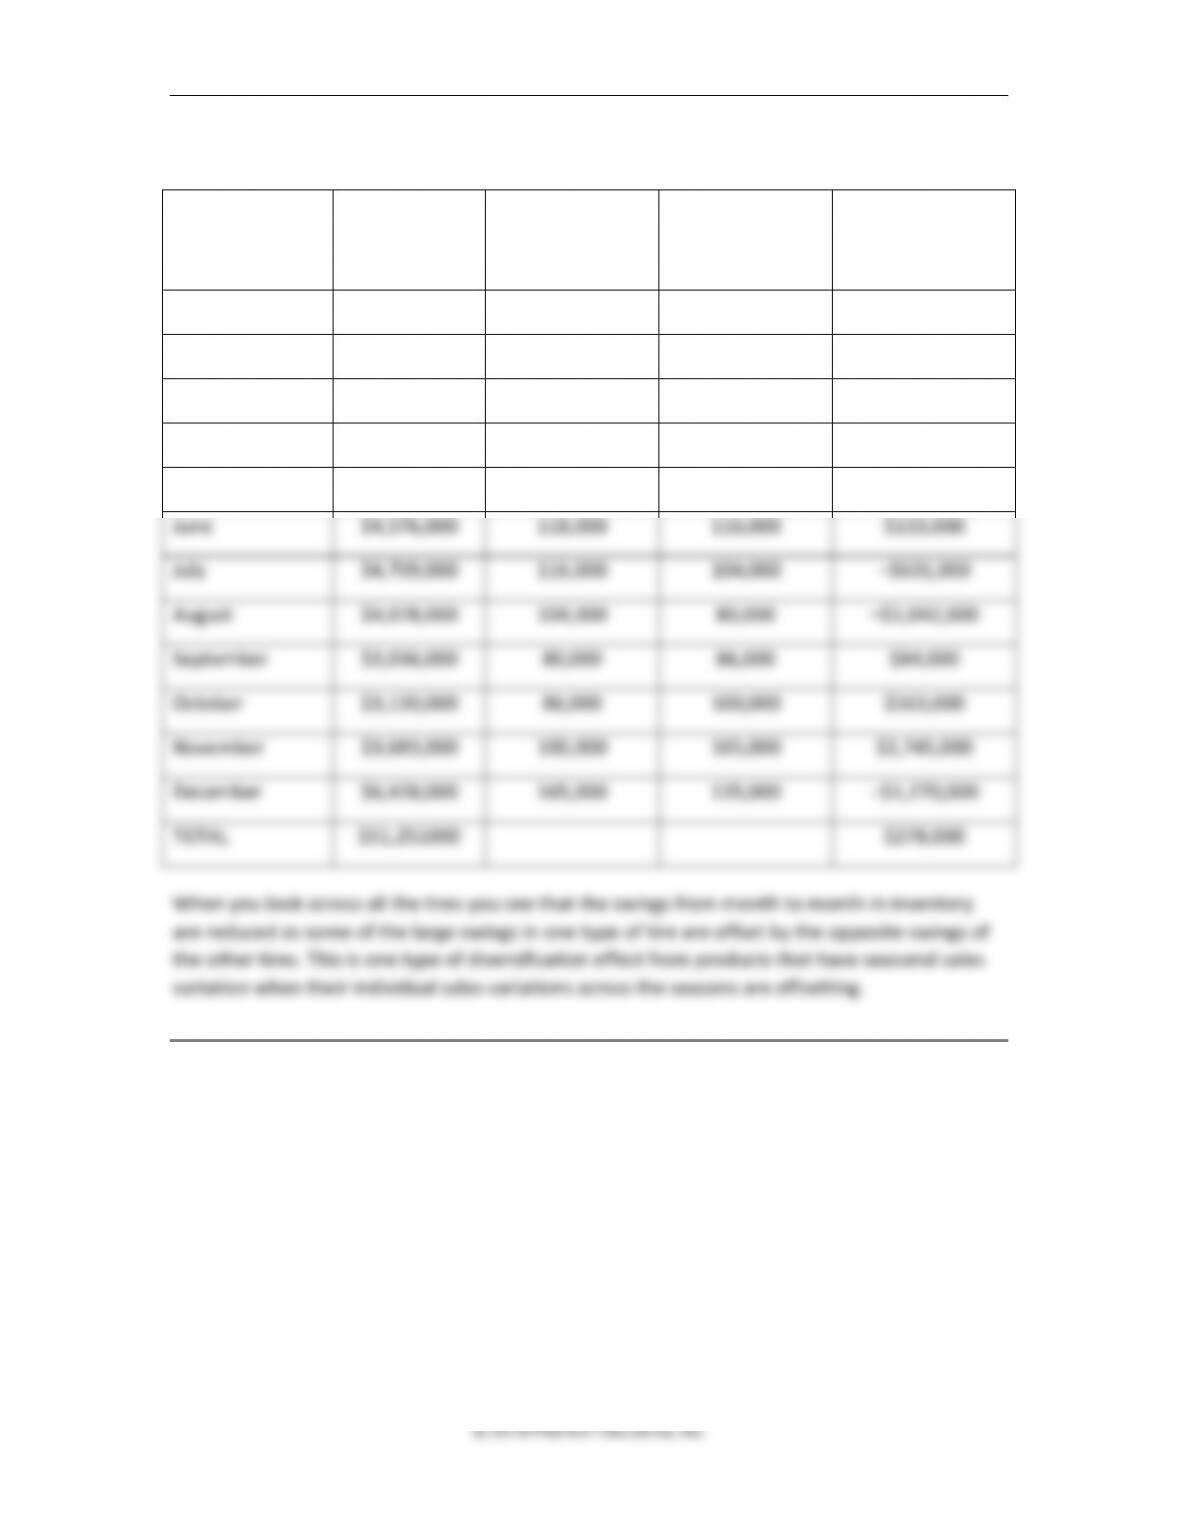
Chapter 10 ◼ Cash Flow Estimation 351
All Tires Working Capital and COGS
Month
Anticipated
COGS
Beginning
Inventory
Balance
Ending Inventory
Balance
Working Capital
Increase
January
$4,880,000
128,000
133,000
$70,000
February
$4,950,000
133,000
117,000
–$750,000
March
$4,200,000
117,000
92,000
–$830,000
April
$3,370,000
92,000
117,000
$851,000
May
$4,221,000
117,000
118,000
$355,000
June
$4,576,000
118,000
116,000
$133,000
July
$4,709,000
116,000
104,000
–$631,000
August
$4,078,000
104,000
80,000
–$1,042,000
September
$3,036,000
80,000
86,000
$84,000
October
$3,120,000
86,000
100,000
$563,000
November
$3,683,000
100,000
165,000
$2,745,000
December
$6,428,000
165,000
135,000
–$1,270,000
TOTAL
$51,251000
$278,000
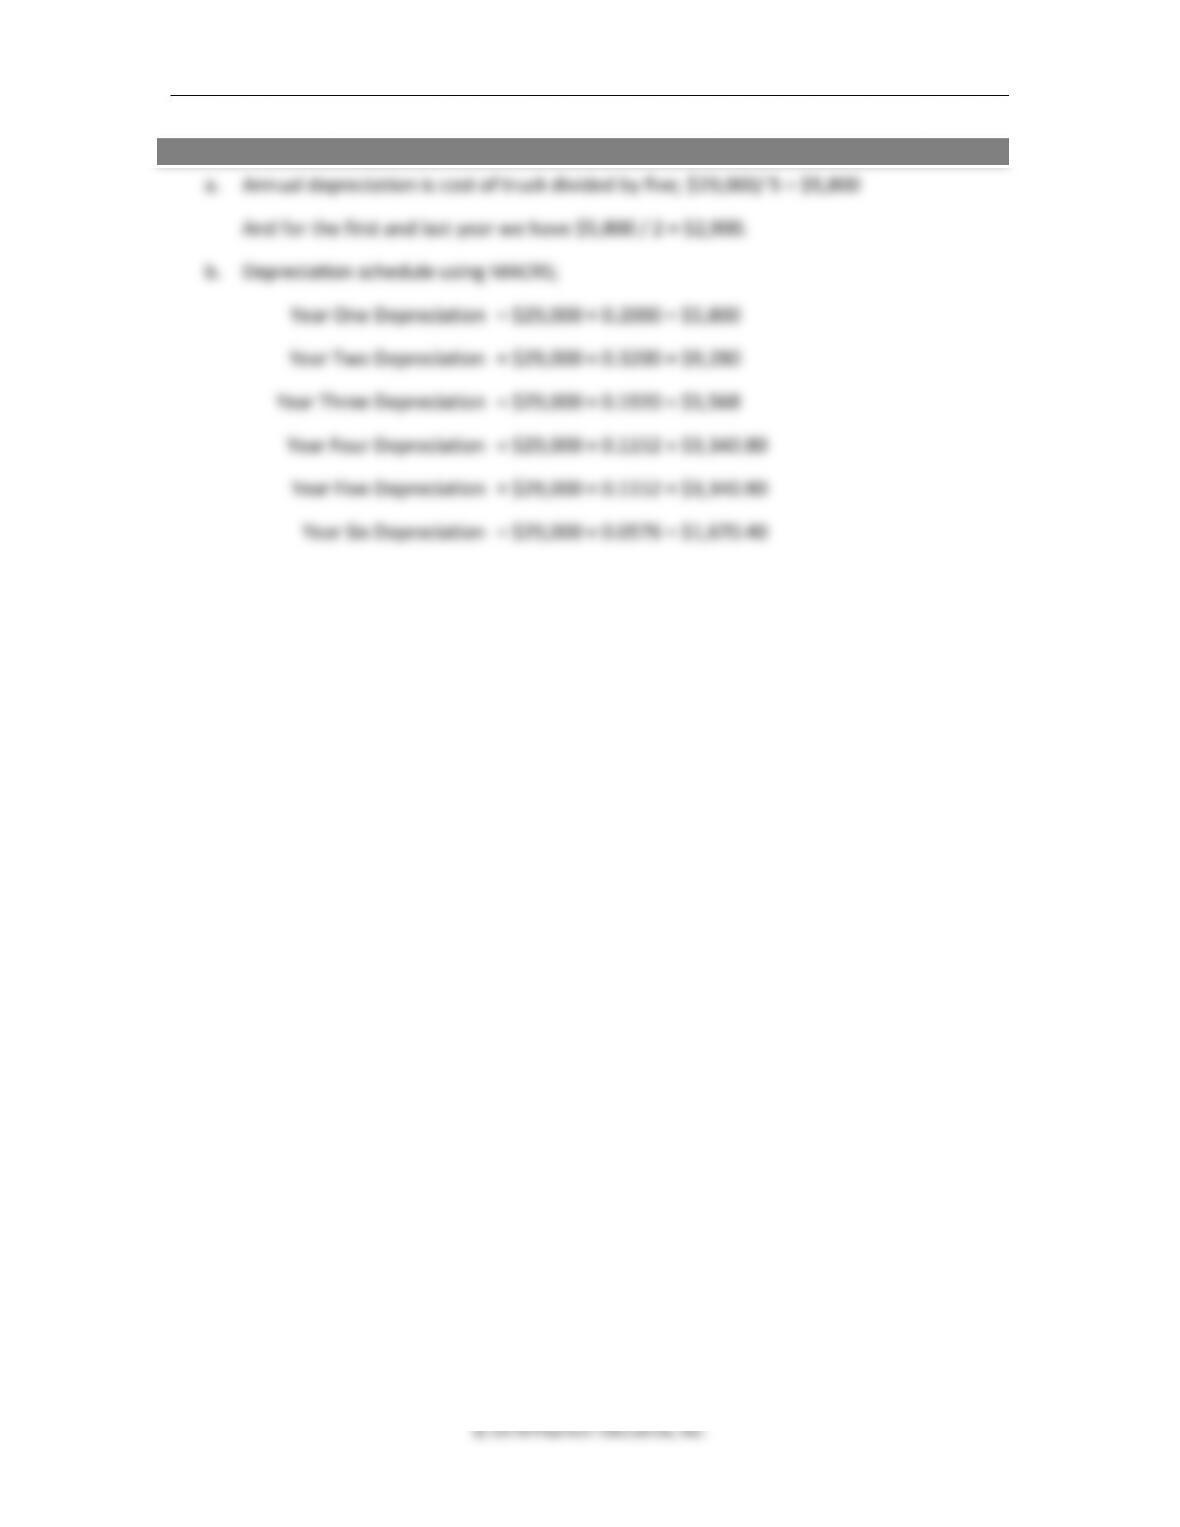
7. Depreciation expense. Brock Florist Company buys a new delivery truck for $29,000. It is
classified as a light-duty truck.
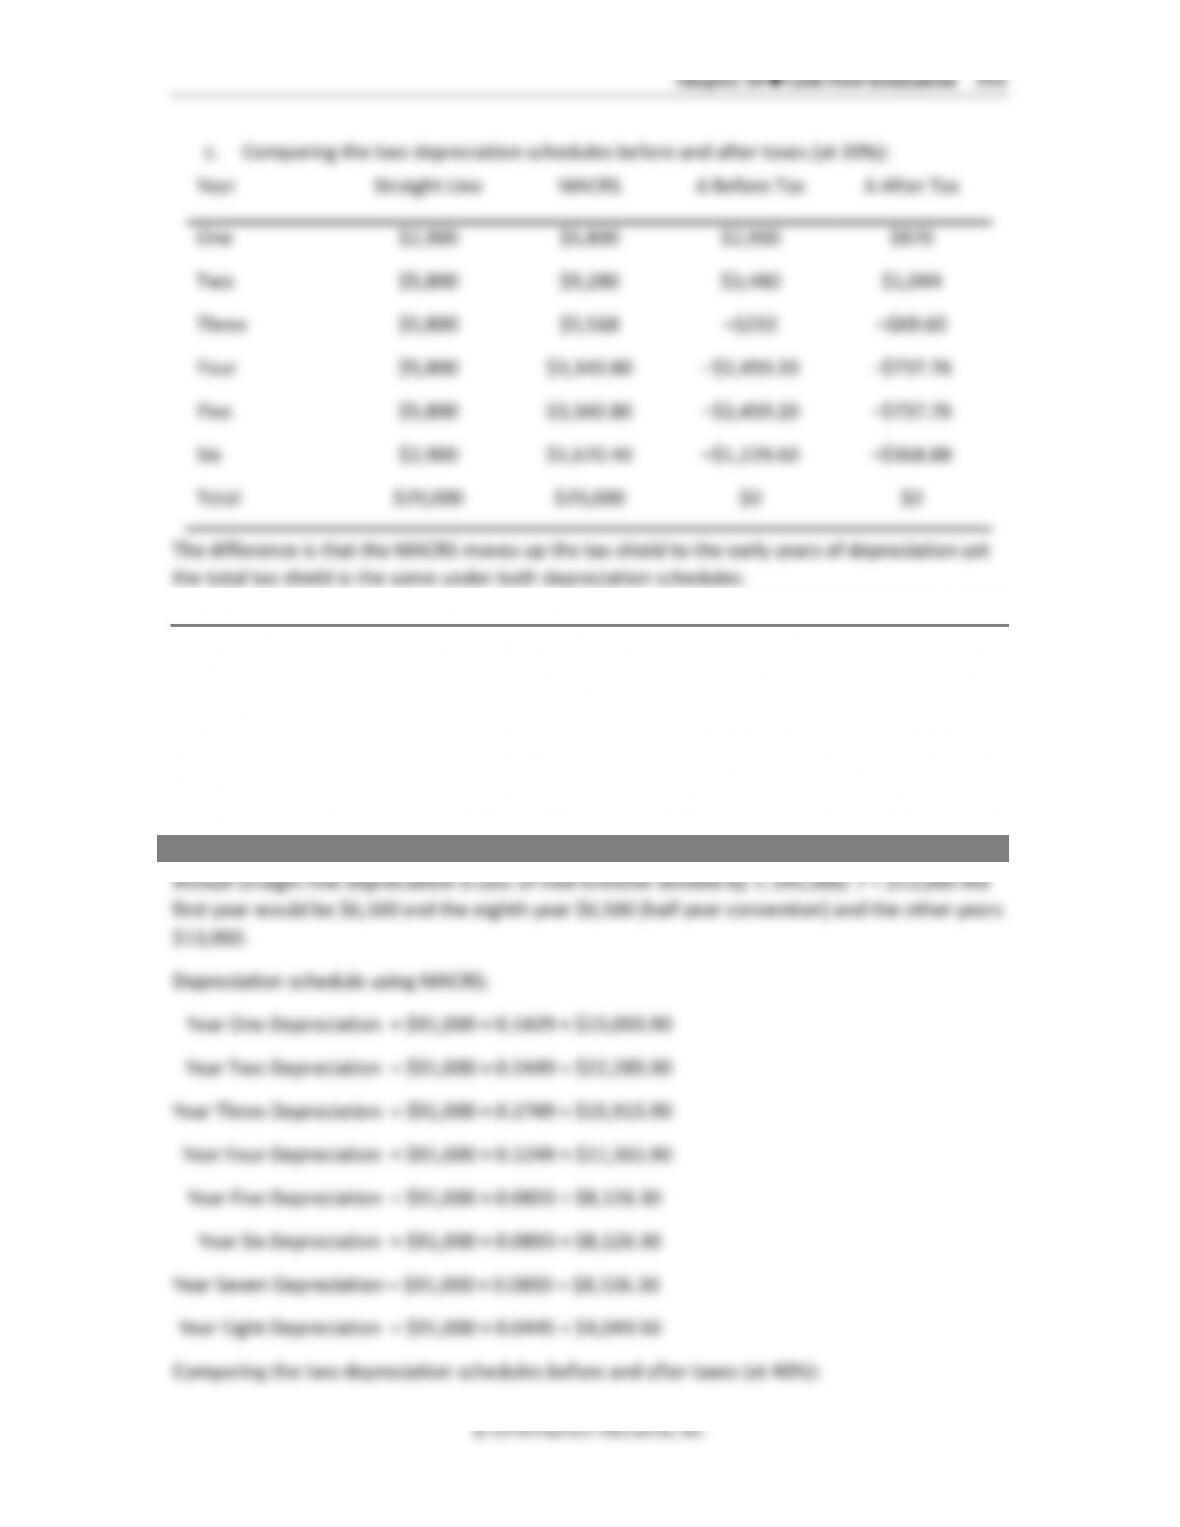
a. Calculate the depreciation schedule using a five-year life, straight-line depreciation, and
the half-year convention for the first and last years.
b. Calculate the depreciation schedule using a five year life and MACRS depreciation.
c. Compare the depreciation schedules from parts (a) and (b) before and after taxes with a
30% tax rate. What do you notice about the difference between these two methods?
352 Brooks ◼ Financial Management: Core Concepts, 4e
ANSWER
© 2018 Pearson Education, Inc.
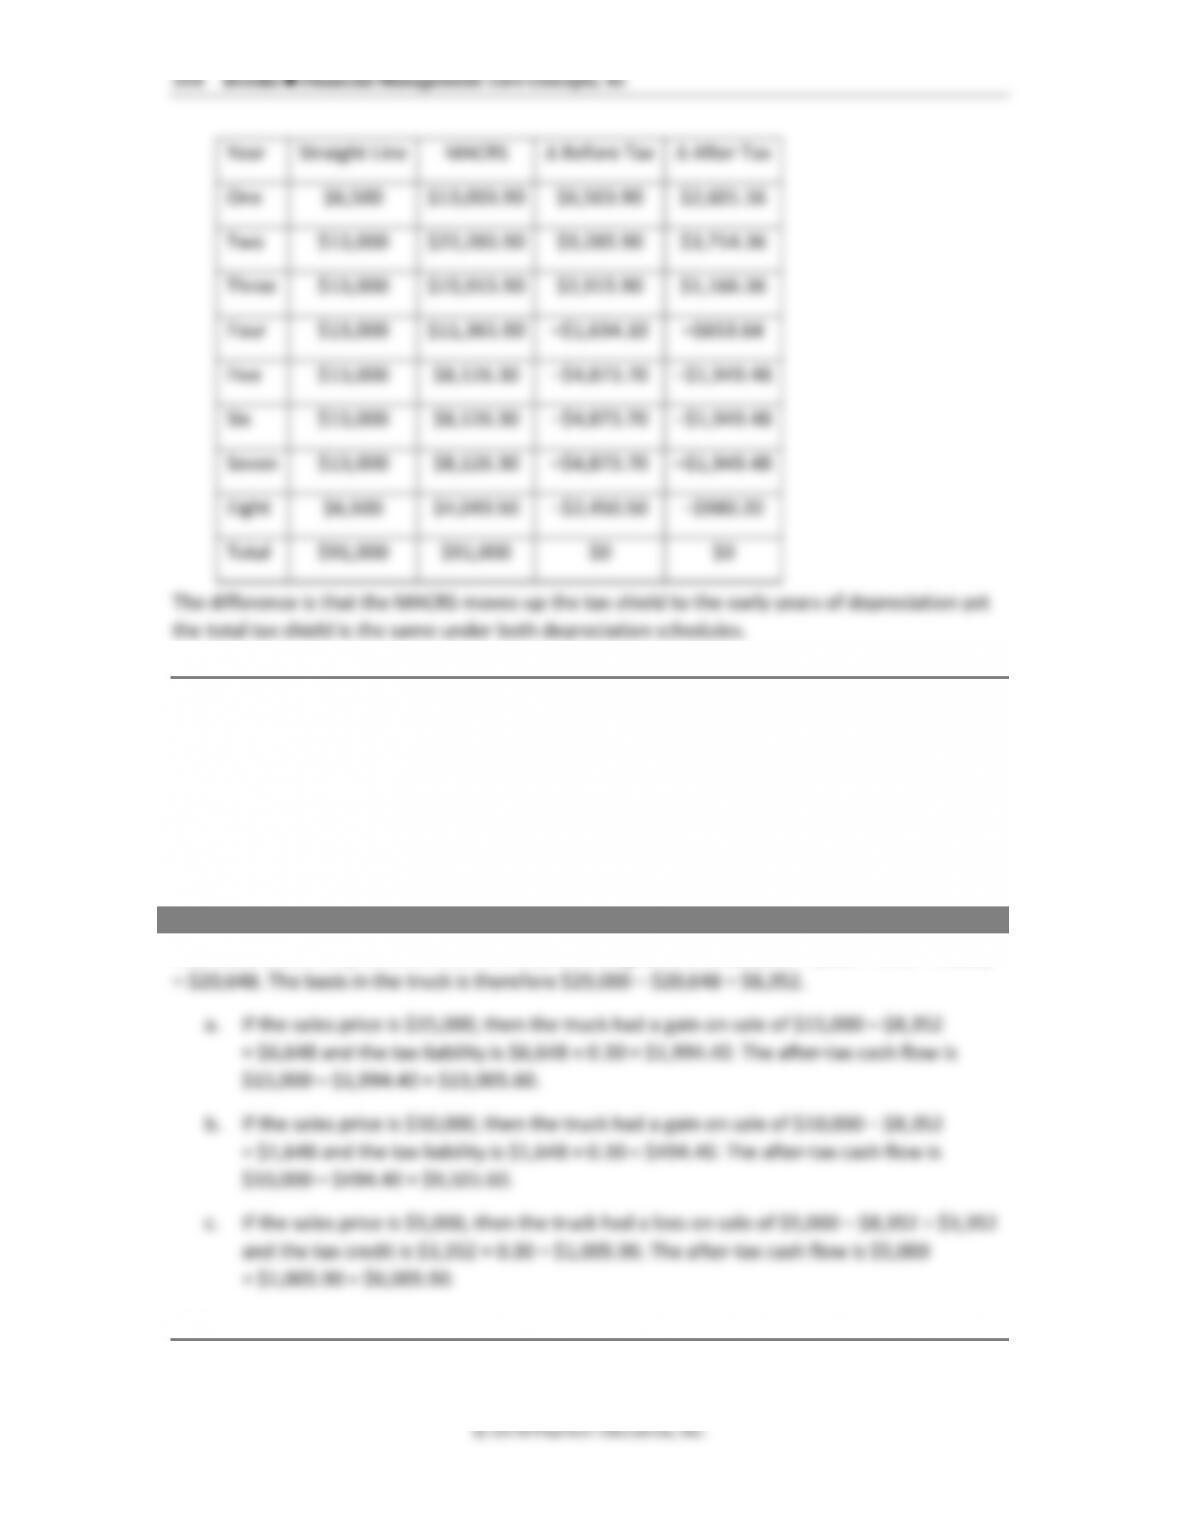
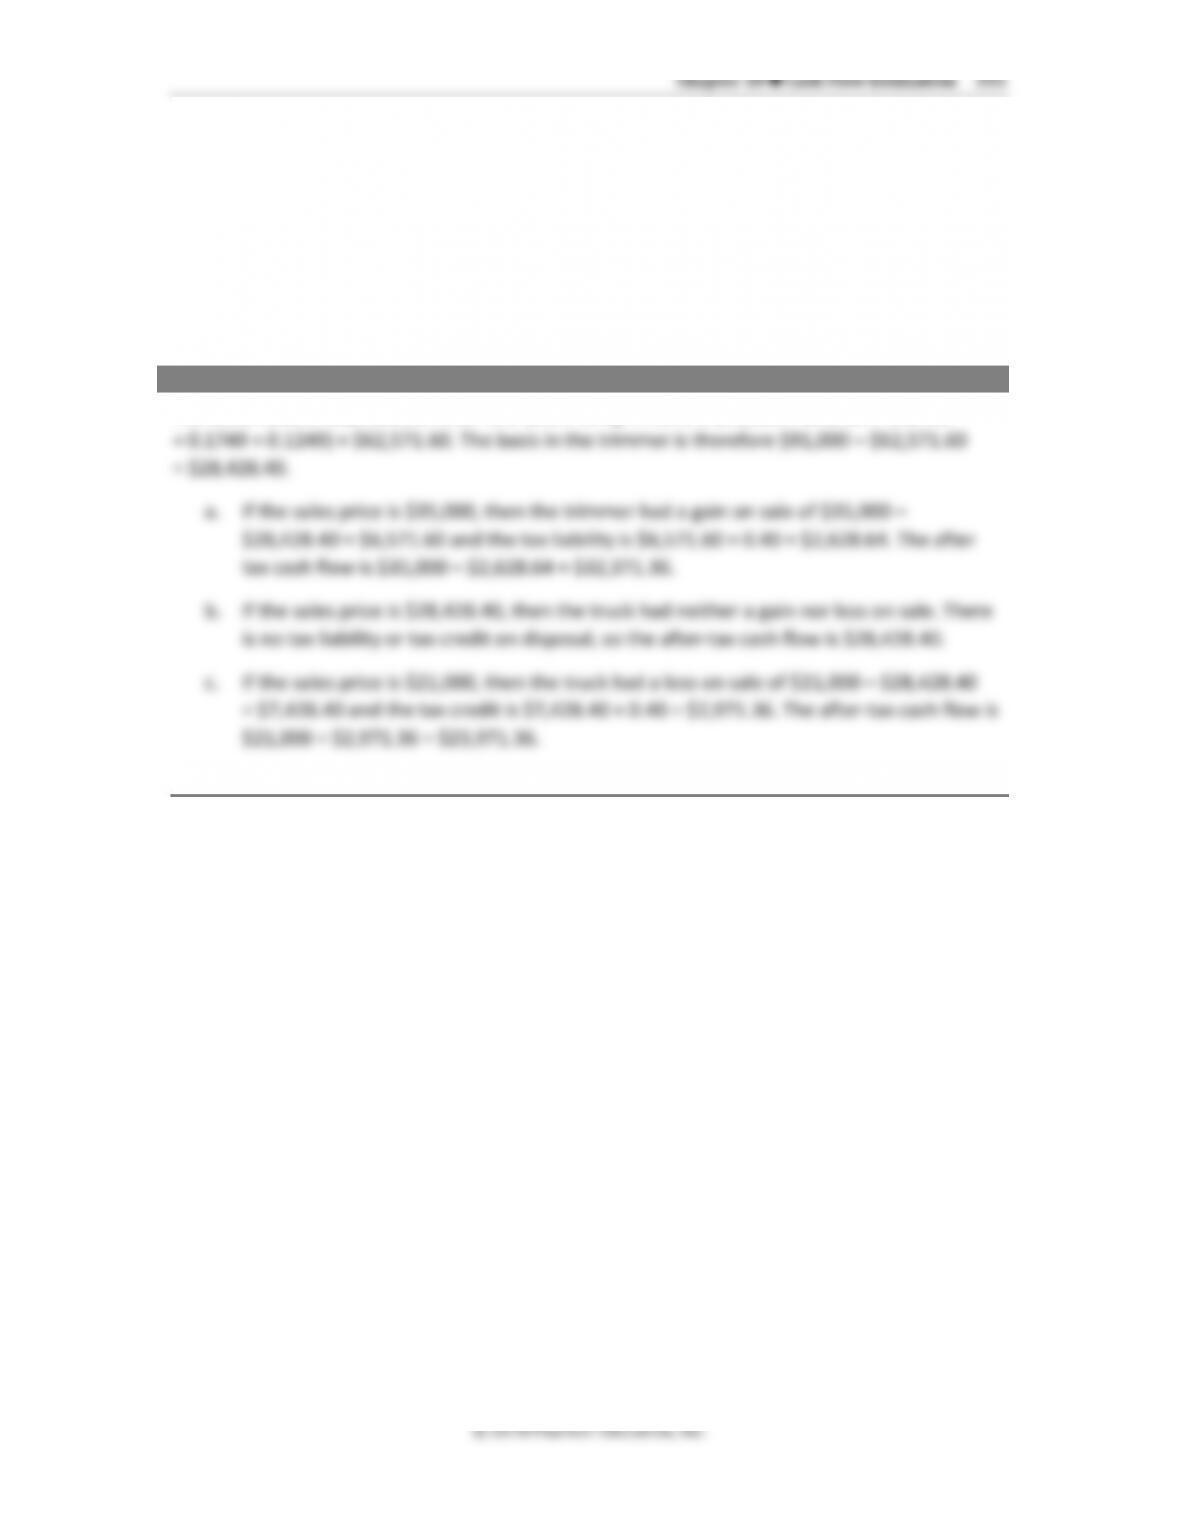
8. Depreciation expense. Richards’ Tree Farm, Inc. has just purchased a new aerial tree
trimmer for $91,000. Calculate the depreciation schedule using the property class category
of a single-purpose agricultural and horticultural structure (from Table 10.3) for both
straight line depreciation and MACRS. Use the half-year convention for both methods.
Compare the depreciation schedules before and after taxes using a 40% tax rate. What do
you notice about the difference between these two methods?
ANSWER
© 2018 Pearson Education, Inc.
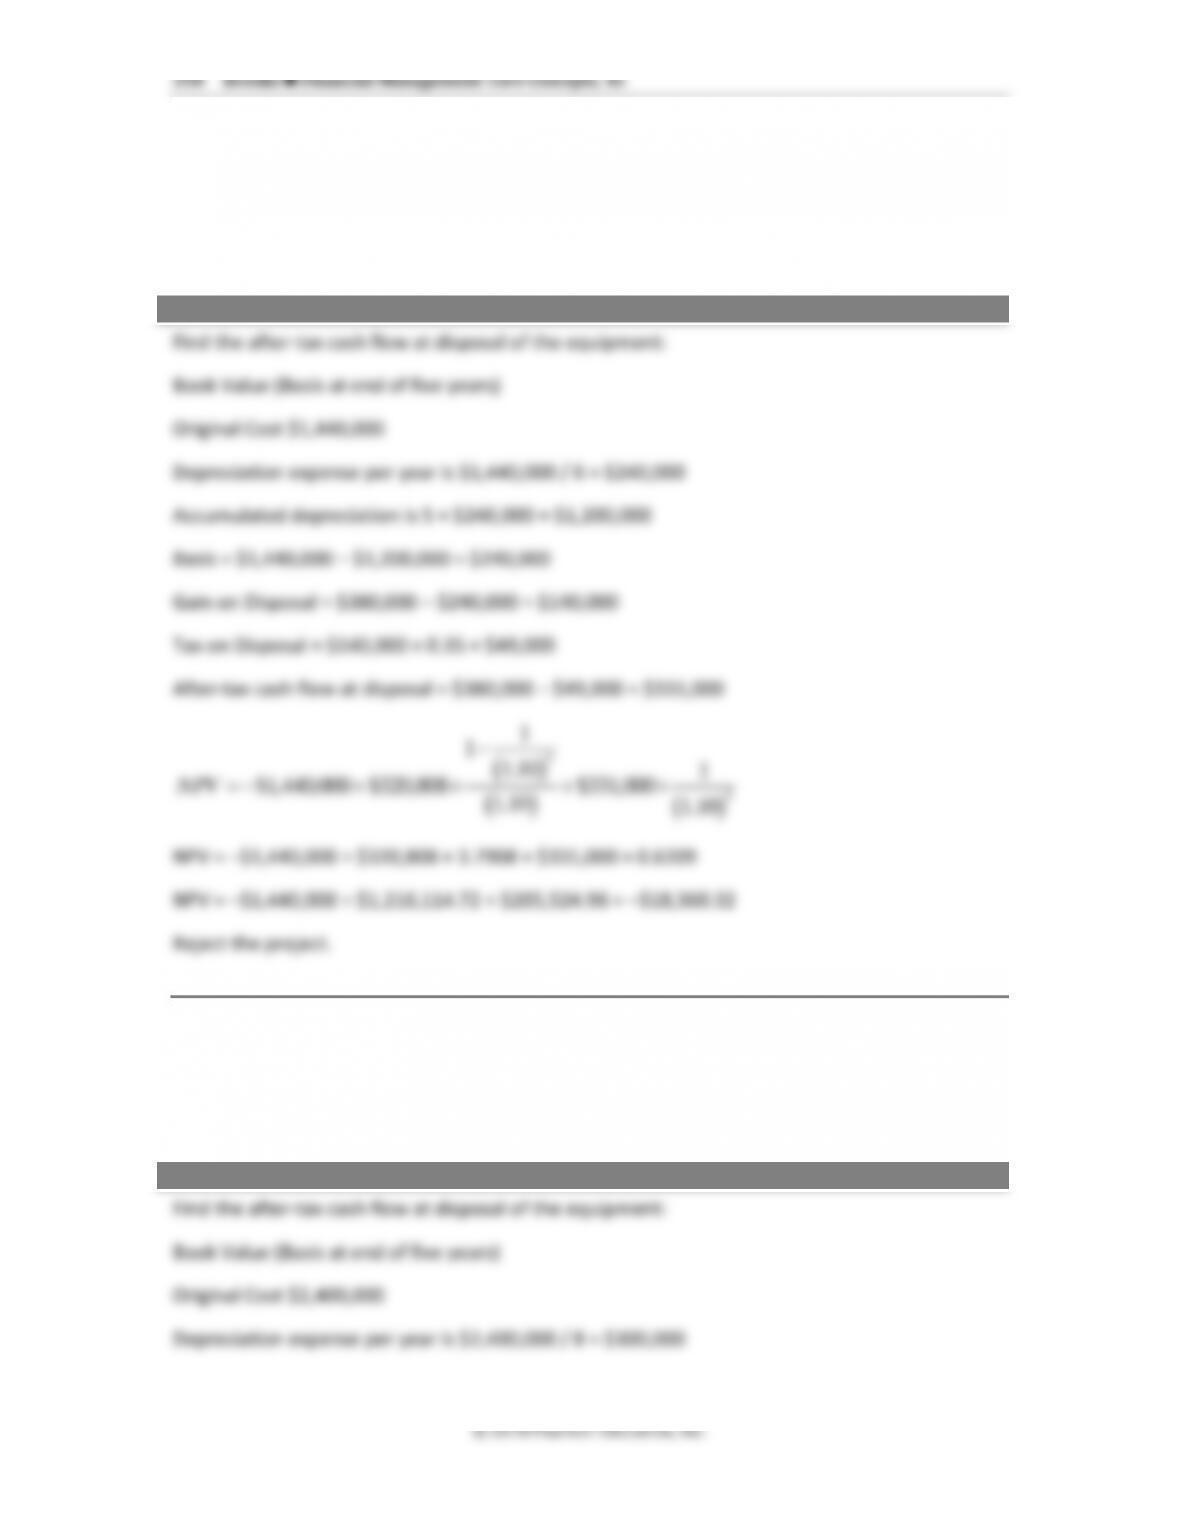
9. Cost recovery. Brock Florist Company sold their delivery truck in problem (see Problem 7)
after three years of service. If MACRS was used for the depreciation schedule, what is the
after-tax cash flow from the sale of the truck (continue to use 30% tax rate) if
a. the sales price was $15,000?
b. the sales price was $10,000?
c. the sales price was $5,000?
ANSWER
The accumulated depreciation after three years using MACRS is $29,000 × (0.20 + 0.32 + 0.192)

Chapter 10 ◼ Cash Flow Estimation 357
© 2018 Pearson Education, Inc.
Operating Cash Flow (per year) $ 667,674
Chapter 10 ◼ Cash Flow Estimation 359
© 2018 Pearson Education, Inc.
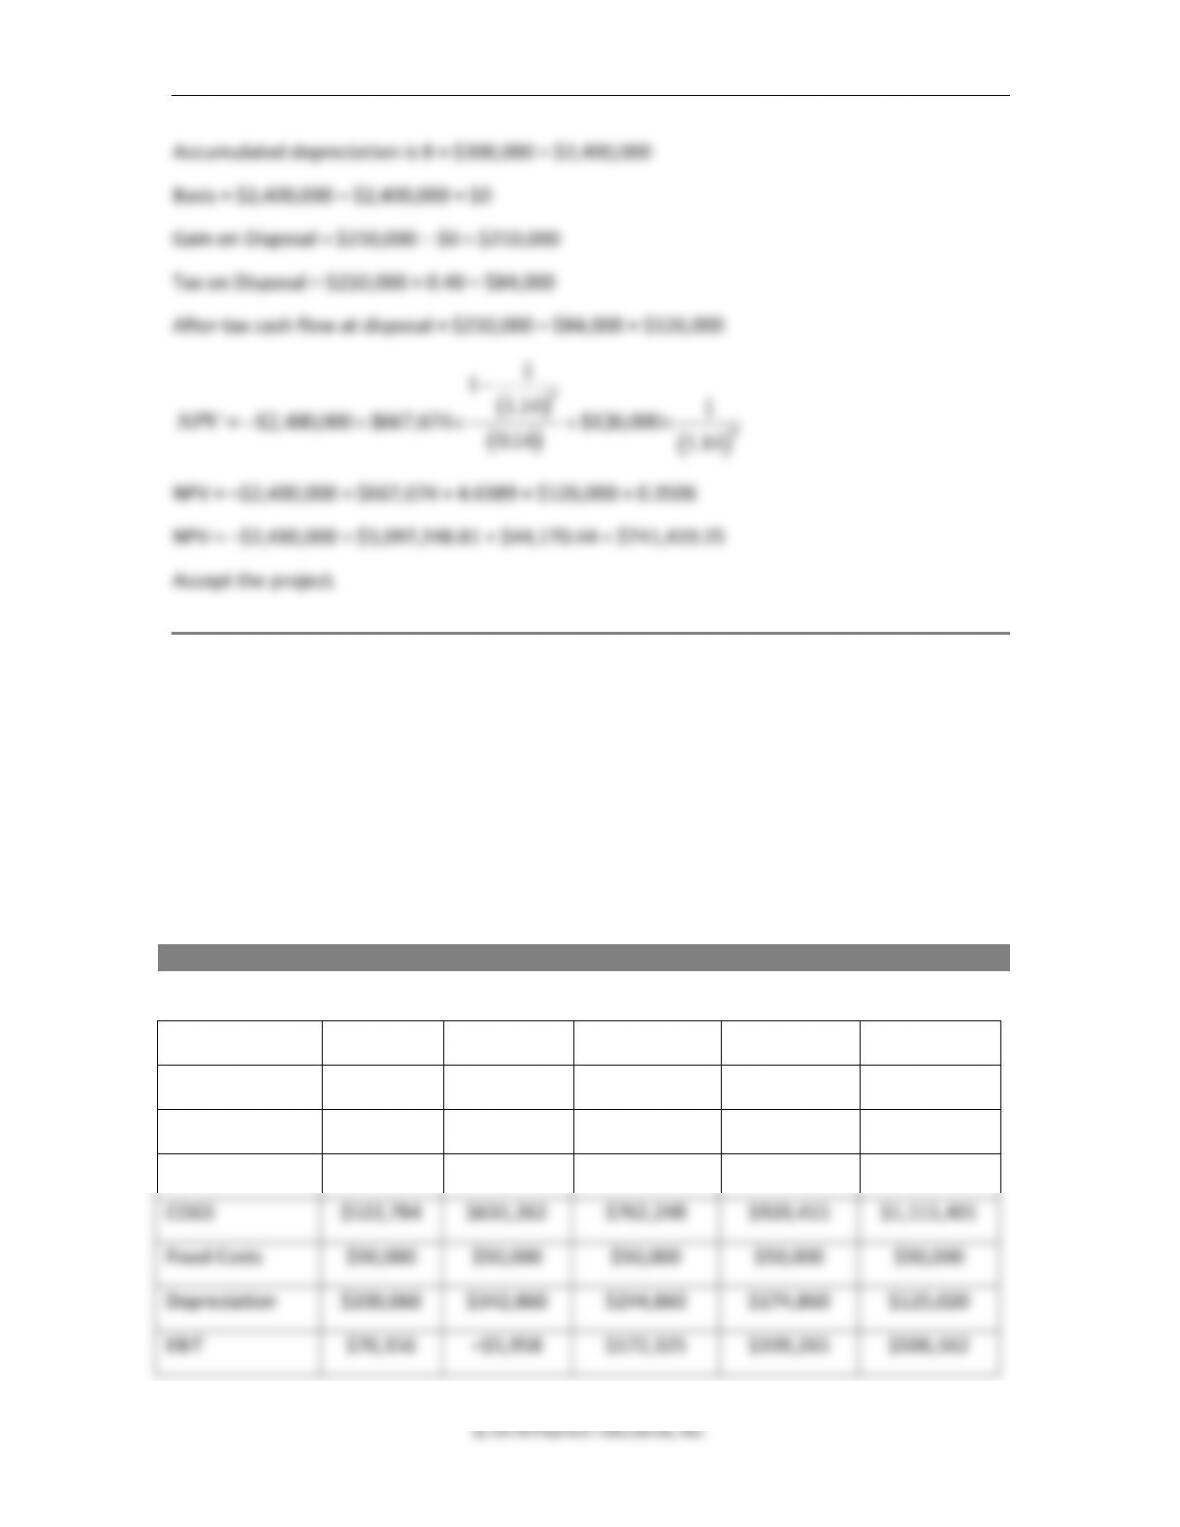
Accumulated depreciation is 8 × $300,000 = $2,400,000
Basis = $2,400,000 – $2,400,000 = $0
Gain on Disposal = $210,000 – $0 = $210,000
Tax on Disposal = $210,000 × 0.40 = $84,000
After-tax cash flow at disposal = $210,000 – $84,000 = $126,000
( )
( ) ( )
8
8
1
1
1.14 1
$2,400,000 $667,674 $126,000
0.14 1.14
NPV
−
= − + +
NPV = –$2,400,000 + $667,674 × 4.6389 + $126,000 × 0.3506
NPV = –$2,400,000 + $3,097,248.81 + $44,170.44 = $741,419.25
Accept the project.
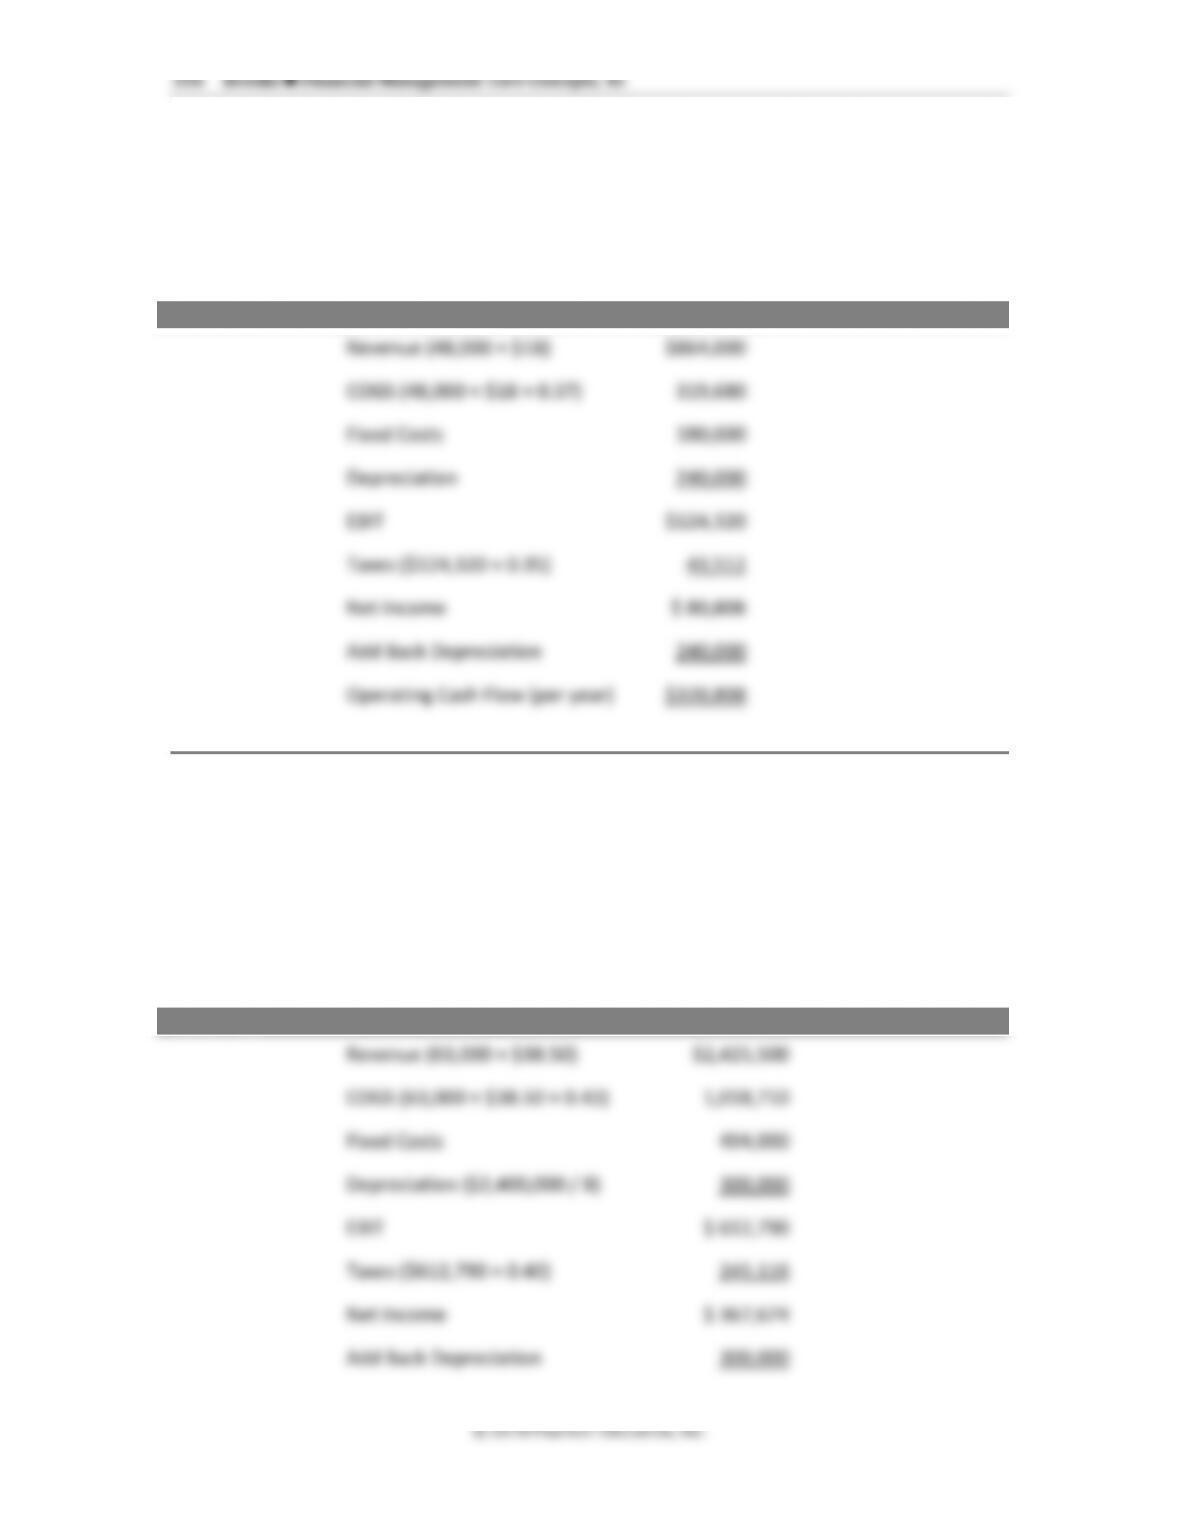
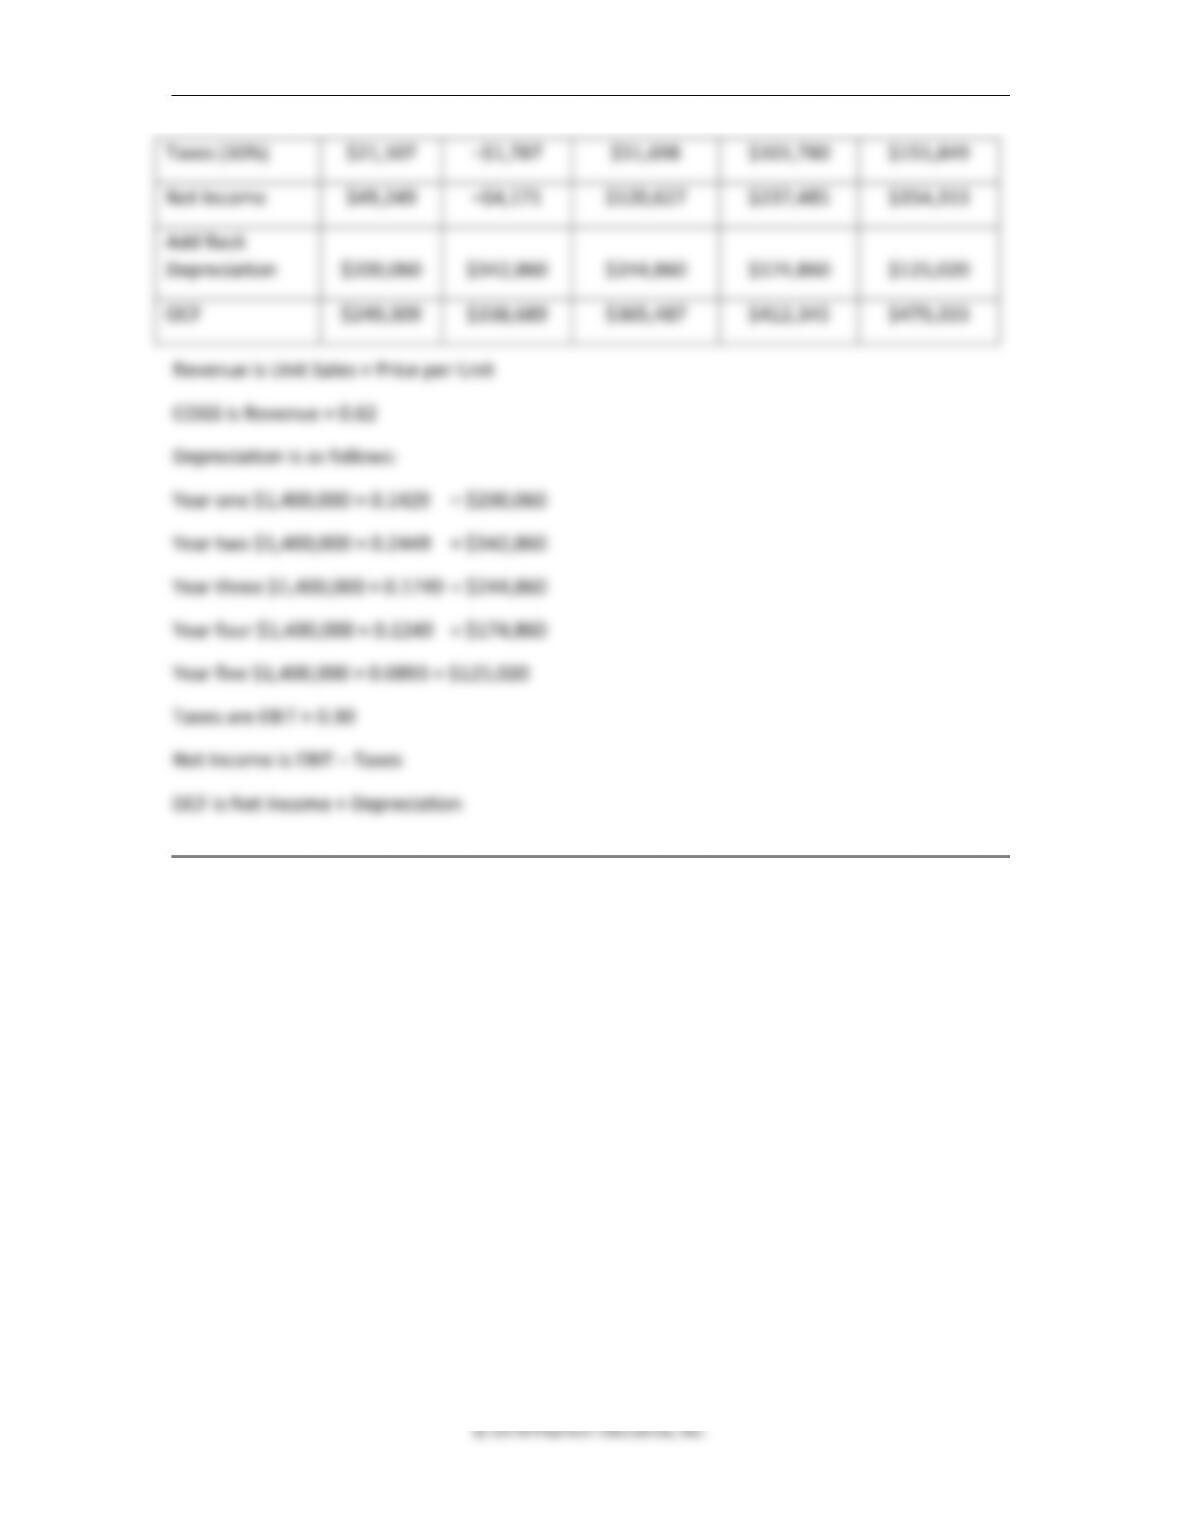
15. Operating cash flow (growing each year; MACRS). Mathews Mining Company is looking at
a project that has the following forecasted sales: first-year sales are 6,800 units and will
grow at 15% over the next four years (a five-year project). The price of the product will start
at $124 per unit and increase each year at 5%. The production costs are expected to be 62%
of the current year’s sales price. The manufacturing equipment to aid this project will have a
total cost (including installation) of $1,400,000. It will be depreciated using MACRS and has a
seven-year MACRS life classification. Fixed costs will be $50,000 per year. Mathews Mining
has a tax rate of 30%.What is the operating cash flow for this project over these five years?
Hint: Use a spreadsheet.
ANSWER
Set up in a spreadsheet
Year
1
2
3
4
5
Unit Sales
6,800
6,800 × 1.15
6,800 × 1.152
6,800 × 1.153
6,800 × 1.154
Price per unit
$124
$124 × 1.05
$124 × 1.052
$124 × 1.053
$124 × 1.054
Revenue
$843,200
$1,018,164
$1,229,433
$1,484,540
$1,792,583
COGS
$522,784
$631,262
$762,248
$920,415
$1,111,401
Fixed Costs
$50,000
$50,000
$50,000
$50,000
$50,000
Depreciation
$200,060
$342,860
$244,860
$174,860
$125,020
EBIT
$70,356
–$5,958
$172,325
$339,265
$506,162
360 Brooks ◼ Financial Management: Core Concepts, 4e
© 2018 Pearson Education, Inc.
Taxes (30%)
$21,107
–$1,787
$51,698
$101,780
$151,849
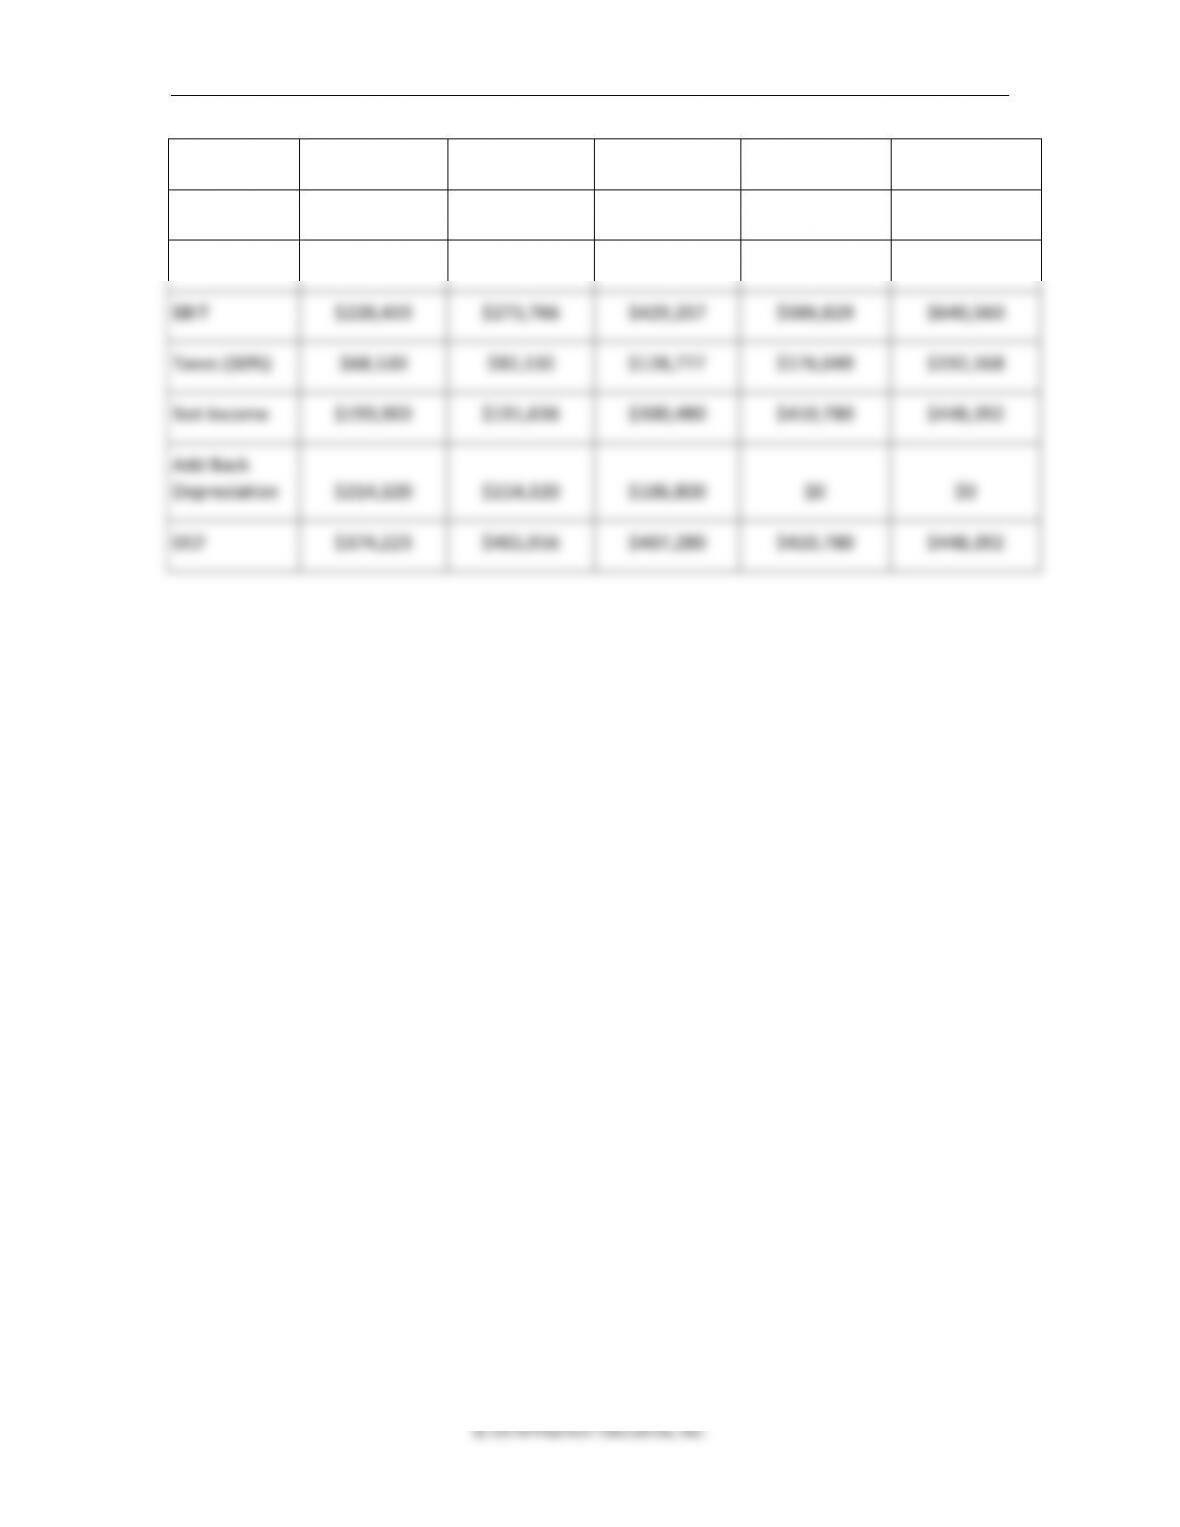
Net Income
$49,249
–$4,171
$120,627
$237,485
$354,313
Add Back
Depreciation
$200,060
$342,860
$244,860
$174,860
$125,020
OCF
$249,309
$338,689
$365,487
$412,345
$479,333
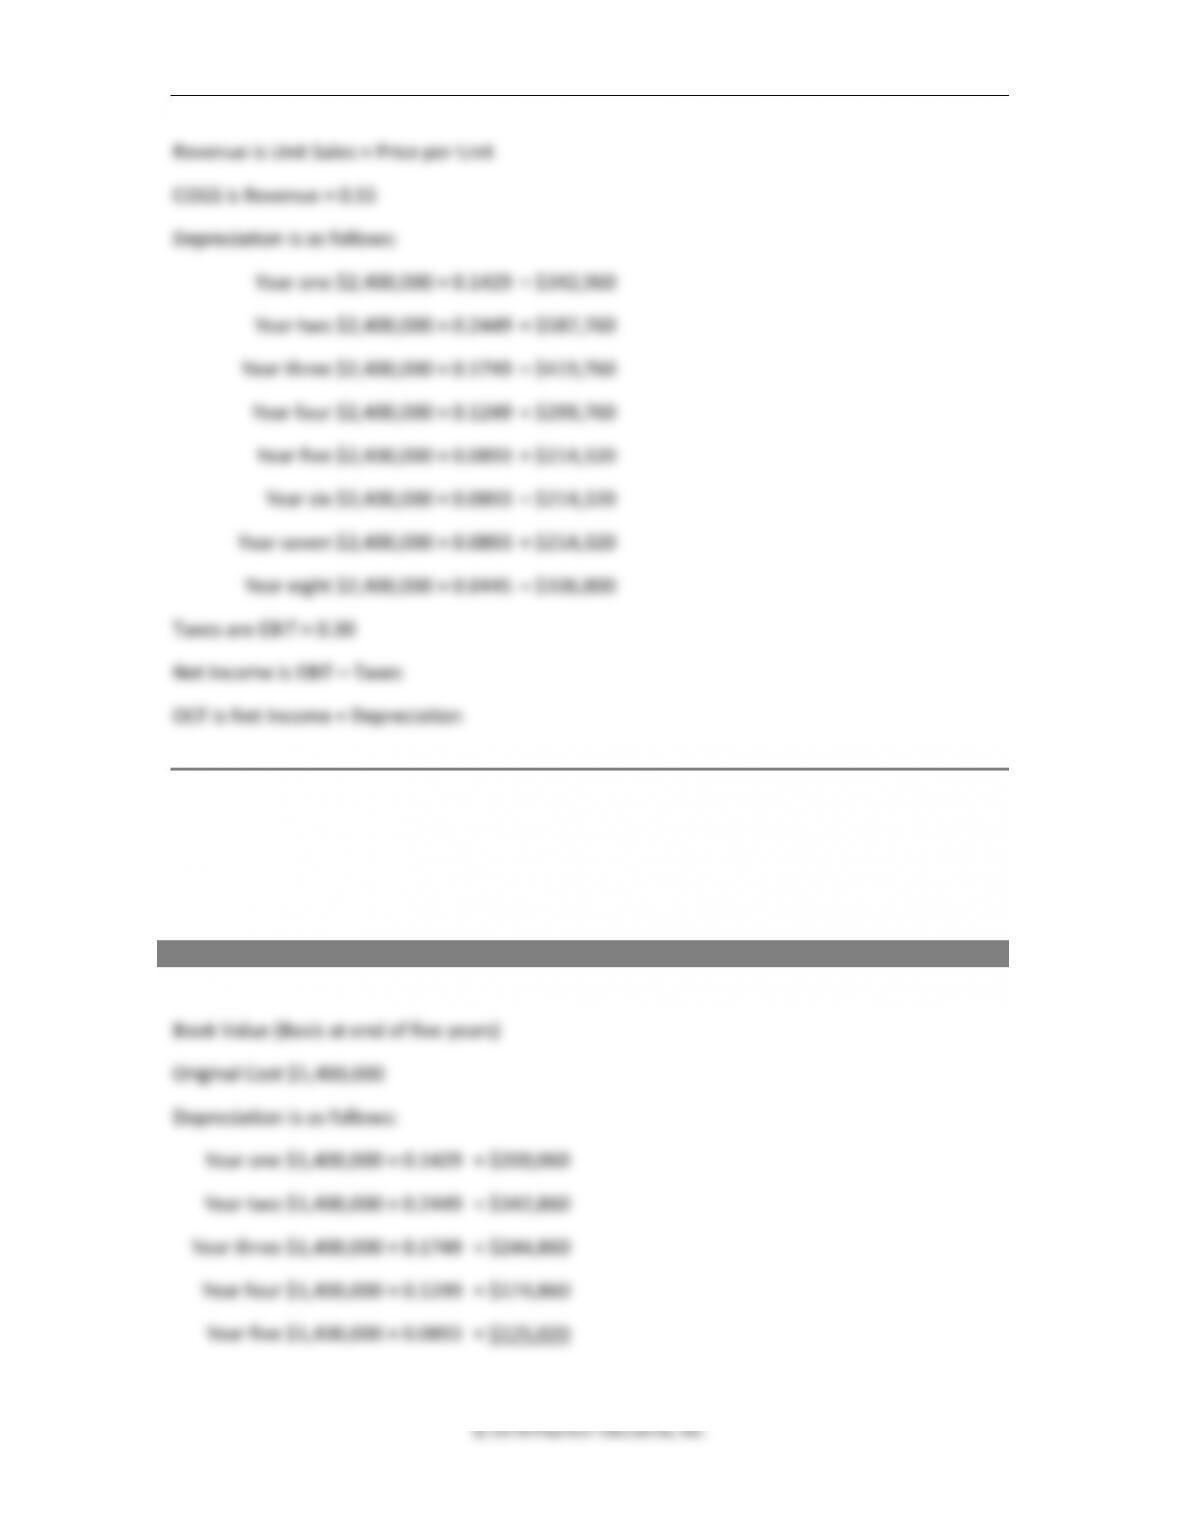
Revenue is Unit Sales × Price per Unit
COGS is Revenue × 0.62
Depreciation is as follows:
Year one $1,400,000 × 0.1429 = $200,060
Year two $1,400,000 × 0.2449 = $342,860
Year three $1,400,000 × 0.1749 = $244,860
Year four $1,400,000 × 0.1249 = $174,860
Year five $1,400,000 × 0.0893 = $125,020
Taxes are EBIT × 0.30
Net Income is EBIT – Taxes
OCF is Net Income + Depreciation
362 Brooks ◼ Financial Management: Core Concepts, 4e
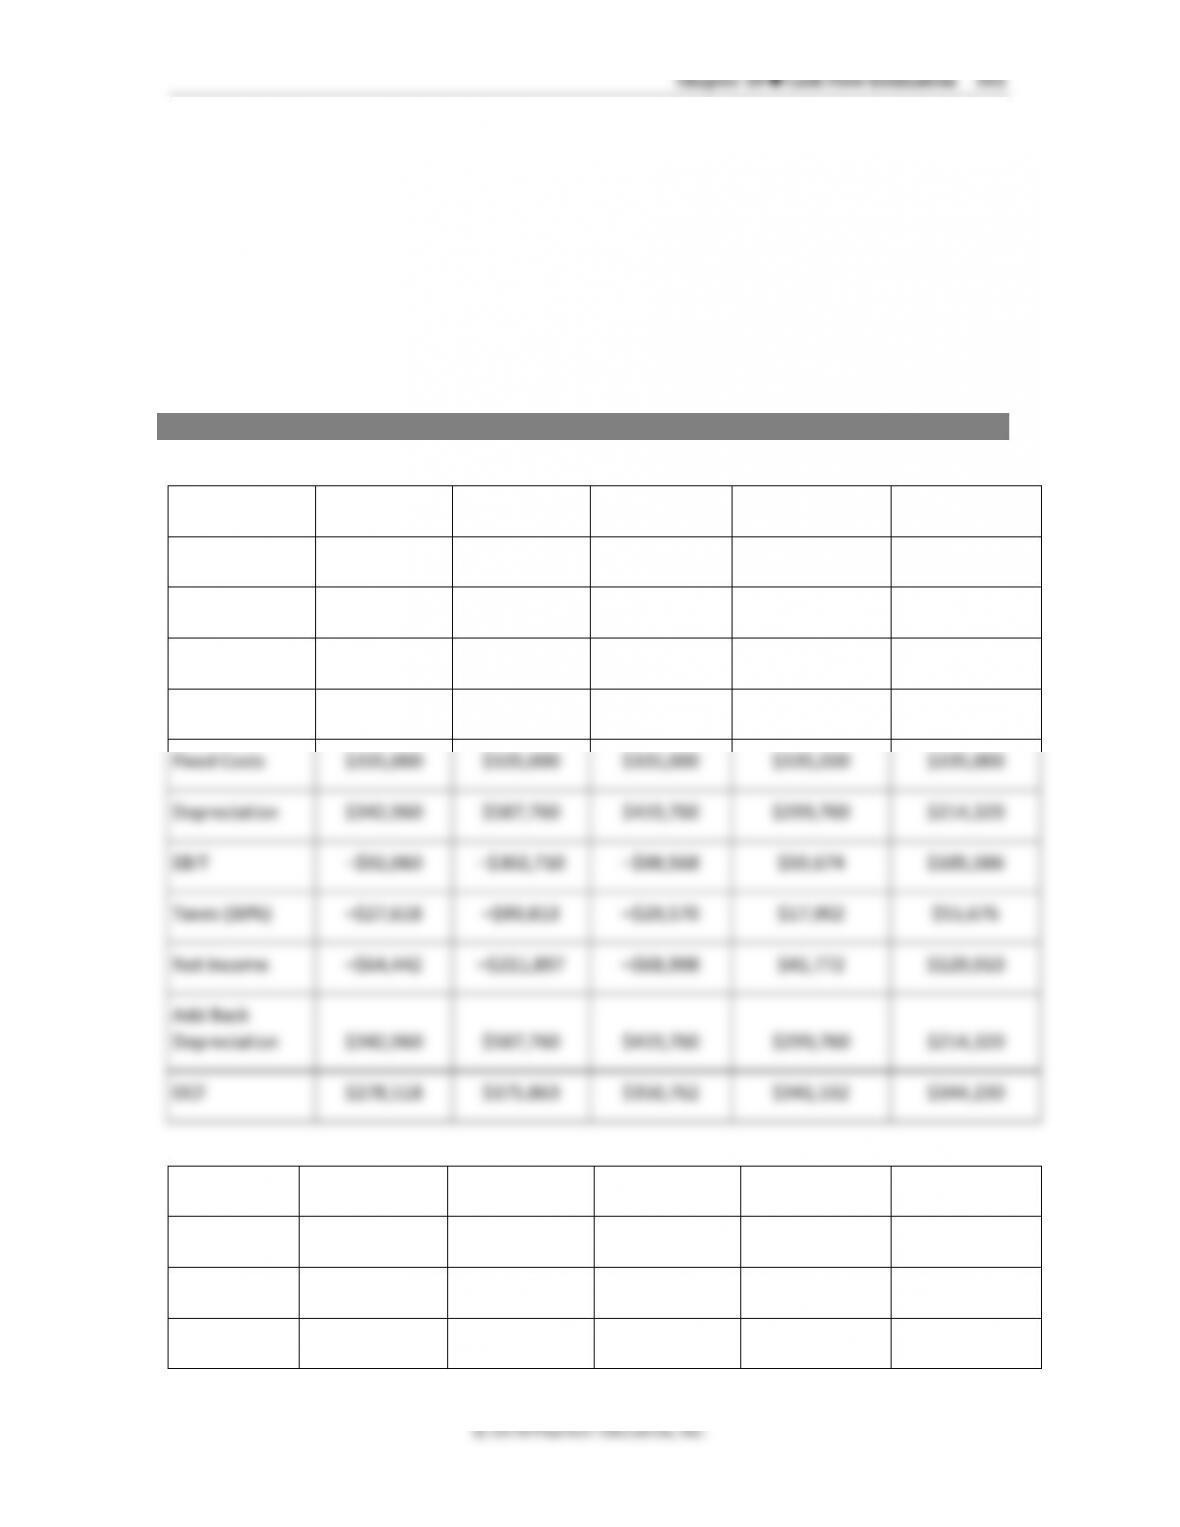
COGS
$950,588
$1,005,995
$1,064,625
$1,126,679
$1,192,350
Fixed Costs
$335,000
$335,000
$335,000
$335,000
$335,000
Depreciation
$214,320
$214,320
$106,800
$0
$0
EBIT
$228,433
$273,766
$429,257
$586,829
$640,560
Taxes (30%)
$68,530
$82,130
$128,777
$176,049
$192,168
Net Income
$159,903
$191,636
$300,480
$410,780
$448,392
Add Back
Depreciation
$214,320
$214,320
$106,800
$0
$0
OCF
$374,223
$405,956
$407,280
$410,780
$448,392
Chapter 10 ◼ Cash Flow Estimation 363
© 2018 Pearson Education, Inc.
Revenue is Unit Sales × Price per Unit
COGS is Revenue × 0.55
Depreciation is as follows:
Year one $2,400,000 × 0.1429 = $342,960
Year two $2,400,000 × 0.2449 = $587,760
Year three $2,400,000 × 0.1749 = $419,760
Year four $2,400,000 × 0.1249 = $299,760
Year five $2,400,000 × 0.0893 = $214,320
Year six $2,400,000 × 0.0893 = $214,320
Year seven $2,400,000 × 0.0893 = $214,320
Year eight $2,400,000 × 0.0445 = $106,800
Taxes are EBIT × 0.30
Net Income is EBIT – Taxes
OCF is Net Income + Depreciation
17. NPV. Using the operating cash flow information from Problem 15, find the NPV of the
project for Mathews Mining if the manufacturing equipment can be sold for $80,000 at the
end of the five-year project and the cost of capital for this project is 12%. Hint: Use a
spreadsheet.
ANSWER
Find the after-tax cash flow at disposal of the equipment:
364 Brooks ◼ Financial Management: Core Concepts, 4e
© 2018 Pearson Education, Inc.
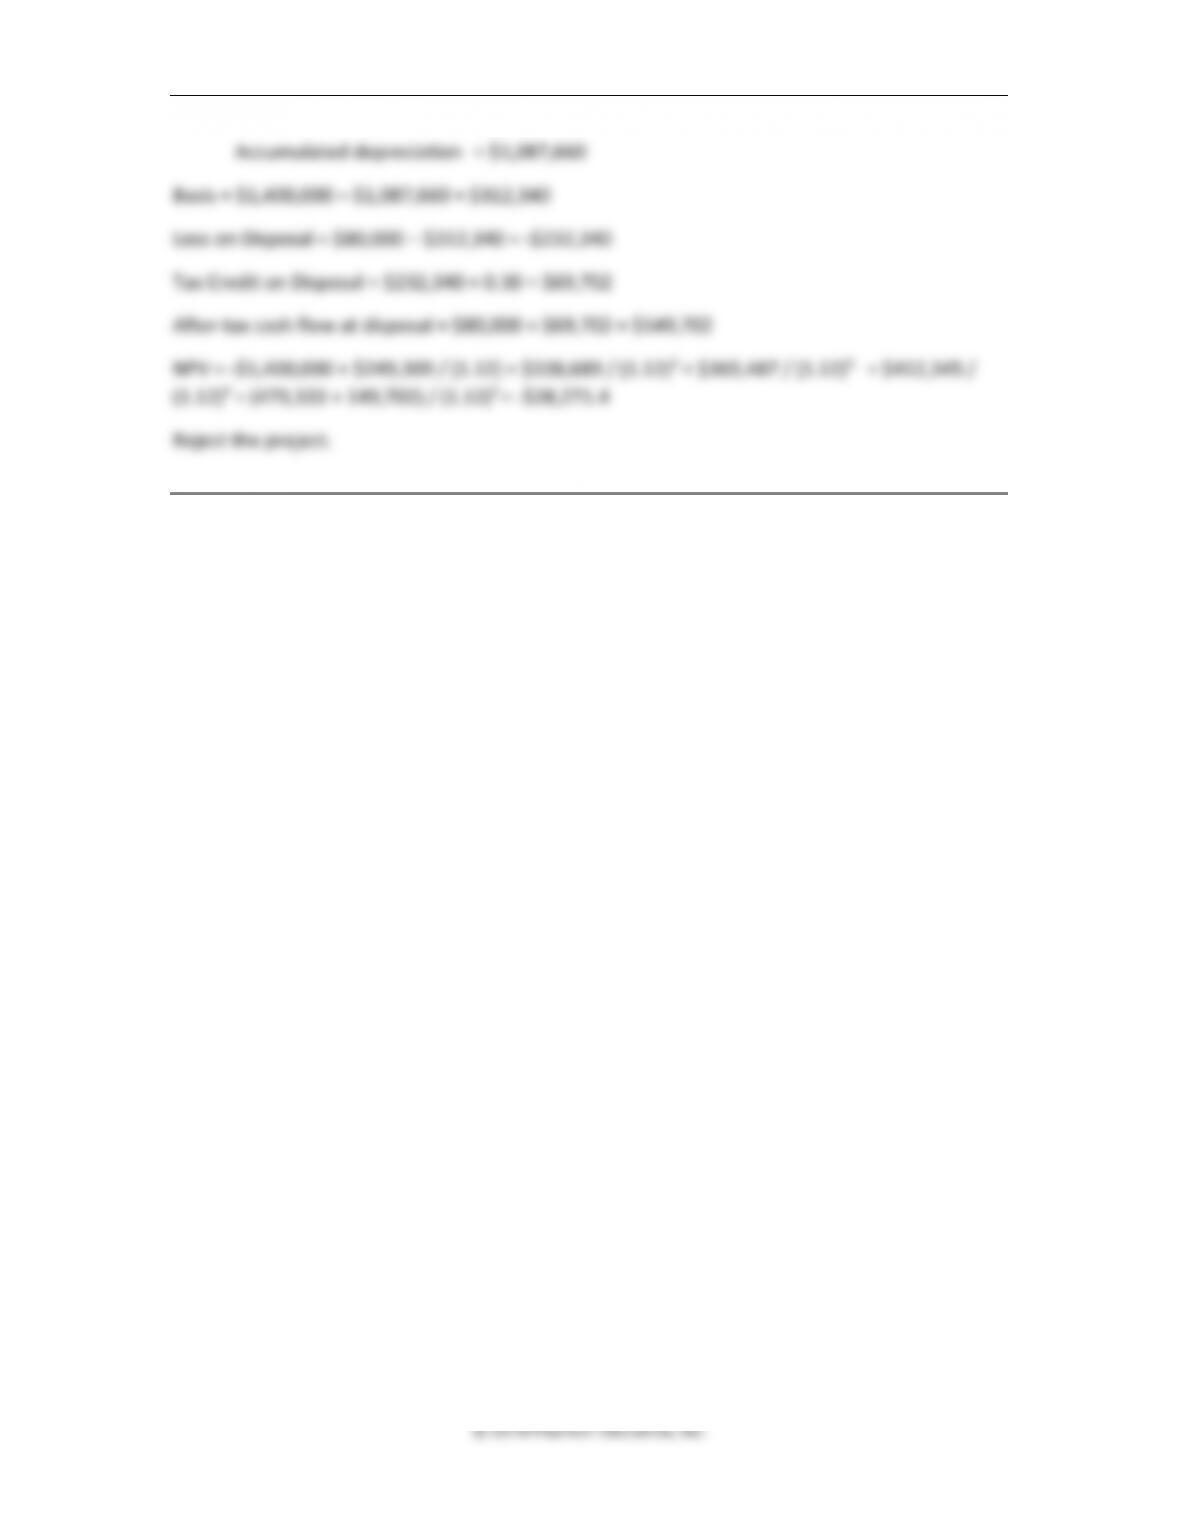
Accumulated depreciation = $1,087,660
Basis = $1,400,000 – $1,087,660 = $312,340
Loss on Disposal = $80,000 – $312,340 = –$232,340
Tax Credit on Disposal = $232,340 × 0.30 = $69,702
After-tax cash flow at disposal = $80,000 + $69,702 = $149,702
NPV = -$1,400,000 + $249,309 / (1.12) + $338,689 / (1.12)2 + $365,487 / (1.12)3 + $412,345 /
(1.12)4 + (479,333 + 149,702) / (1.12)5 = –$28,271.4
Reject the project.