SOLUTION
(3040 min.) Straightforward coverage of manufacturing overhead, standard-costing
system.
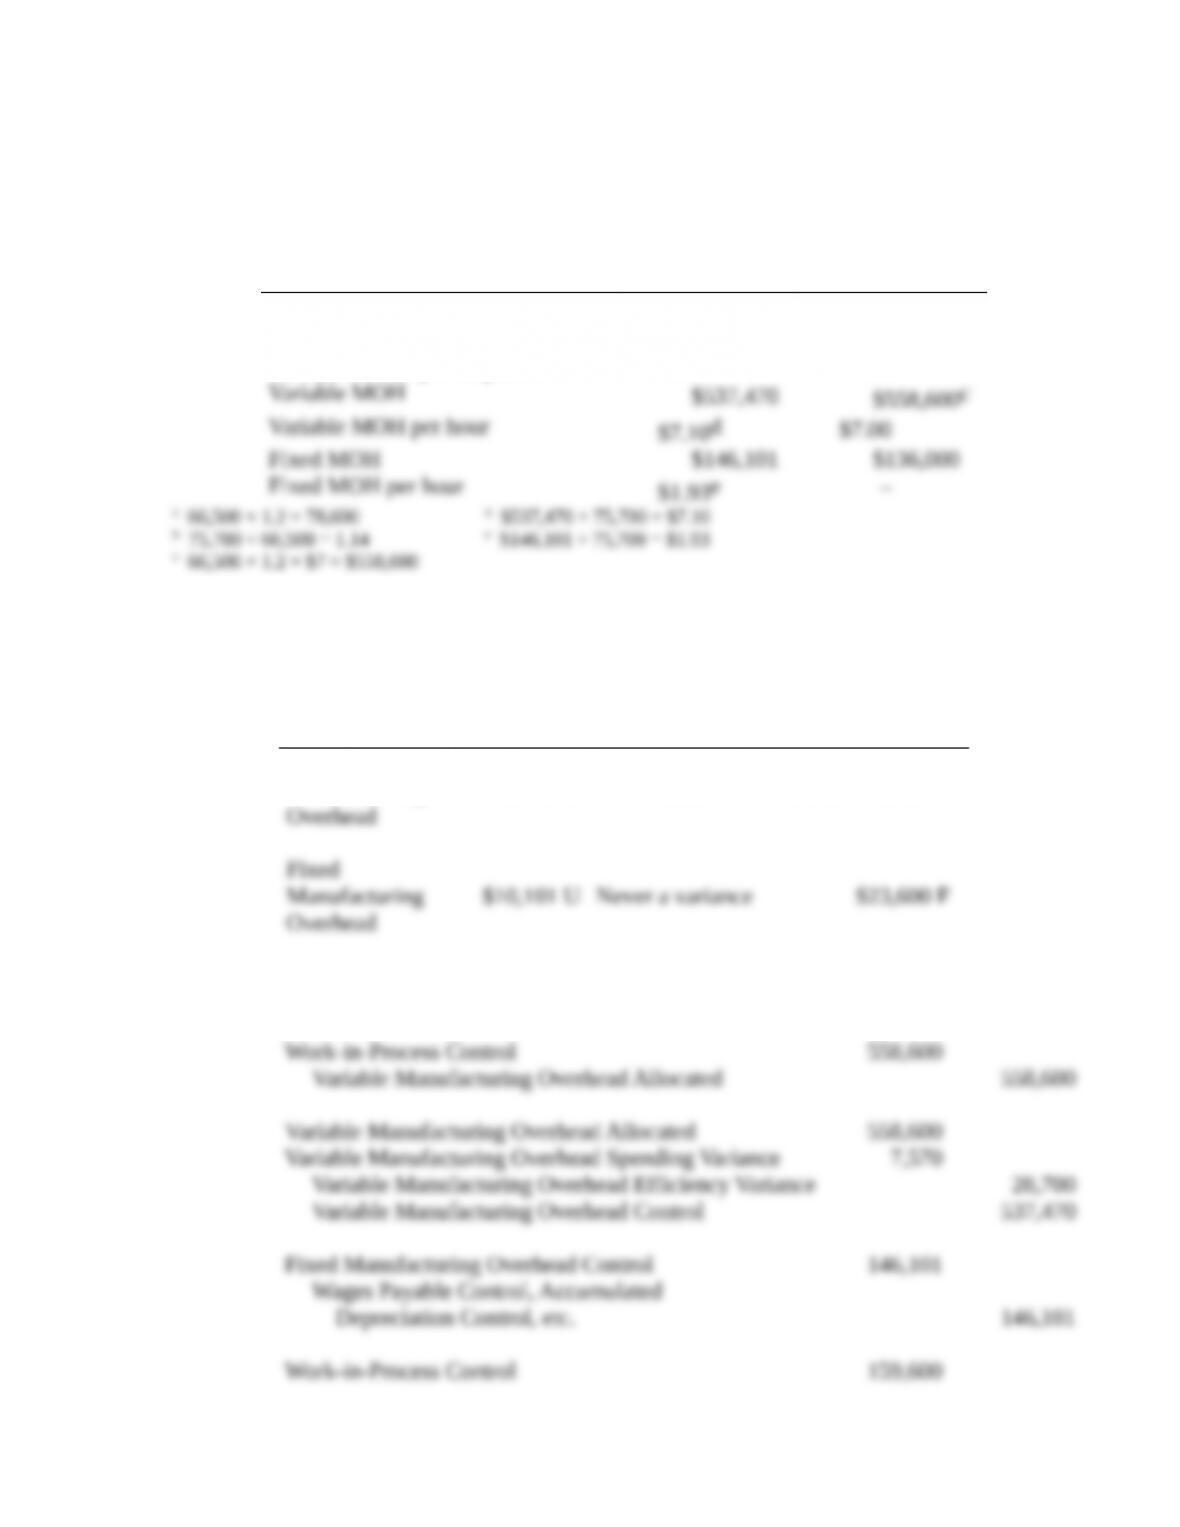
1. Solution Exhibit 8-28 shows the computations. Summary details are:
Actual Flexible Budget
Output units 66,500 66,500
Allocation base (machine-hours) 75,700 79,800a
Allocation base per output unit 1.14b1.2
An overview of the 4-variance analysis is:
4-Variance
Analysis
Spending
Variance
Efficiency
Variance
Production
Volume Variance
Variable
Manufacturing
$7,570 U $28,700 F Never a variance
2. Variable Manufacturing Overhead Control 537,470
Accounts Payable Control and other accounts 537,470
3. The control of variable manufacturing overhead requires the identification of the cost
drivers for such items as energy, supplies, and repairs. Control often entails monitoring
4. The variable overhead spending variance is unfavorable. This means the actual rate
applied to the manufacturing costs is higher than the budgeted rate. Since variable overhead
consists of several different costs, this could be for a variety of reasons, such as the utility rates
being higher than estimated or the indirect materials costs per unit of denominator activity being
more than estimated.
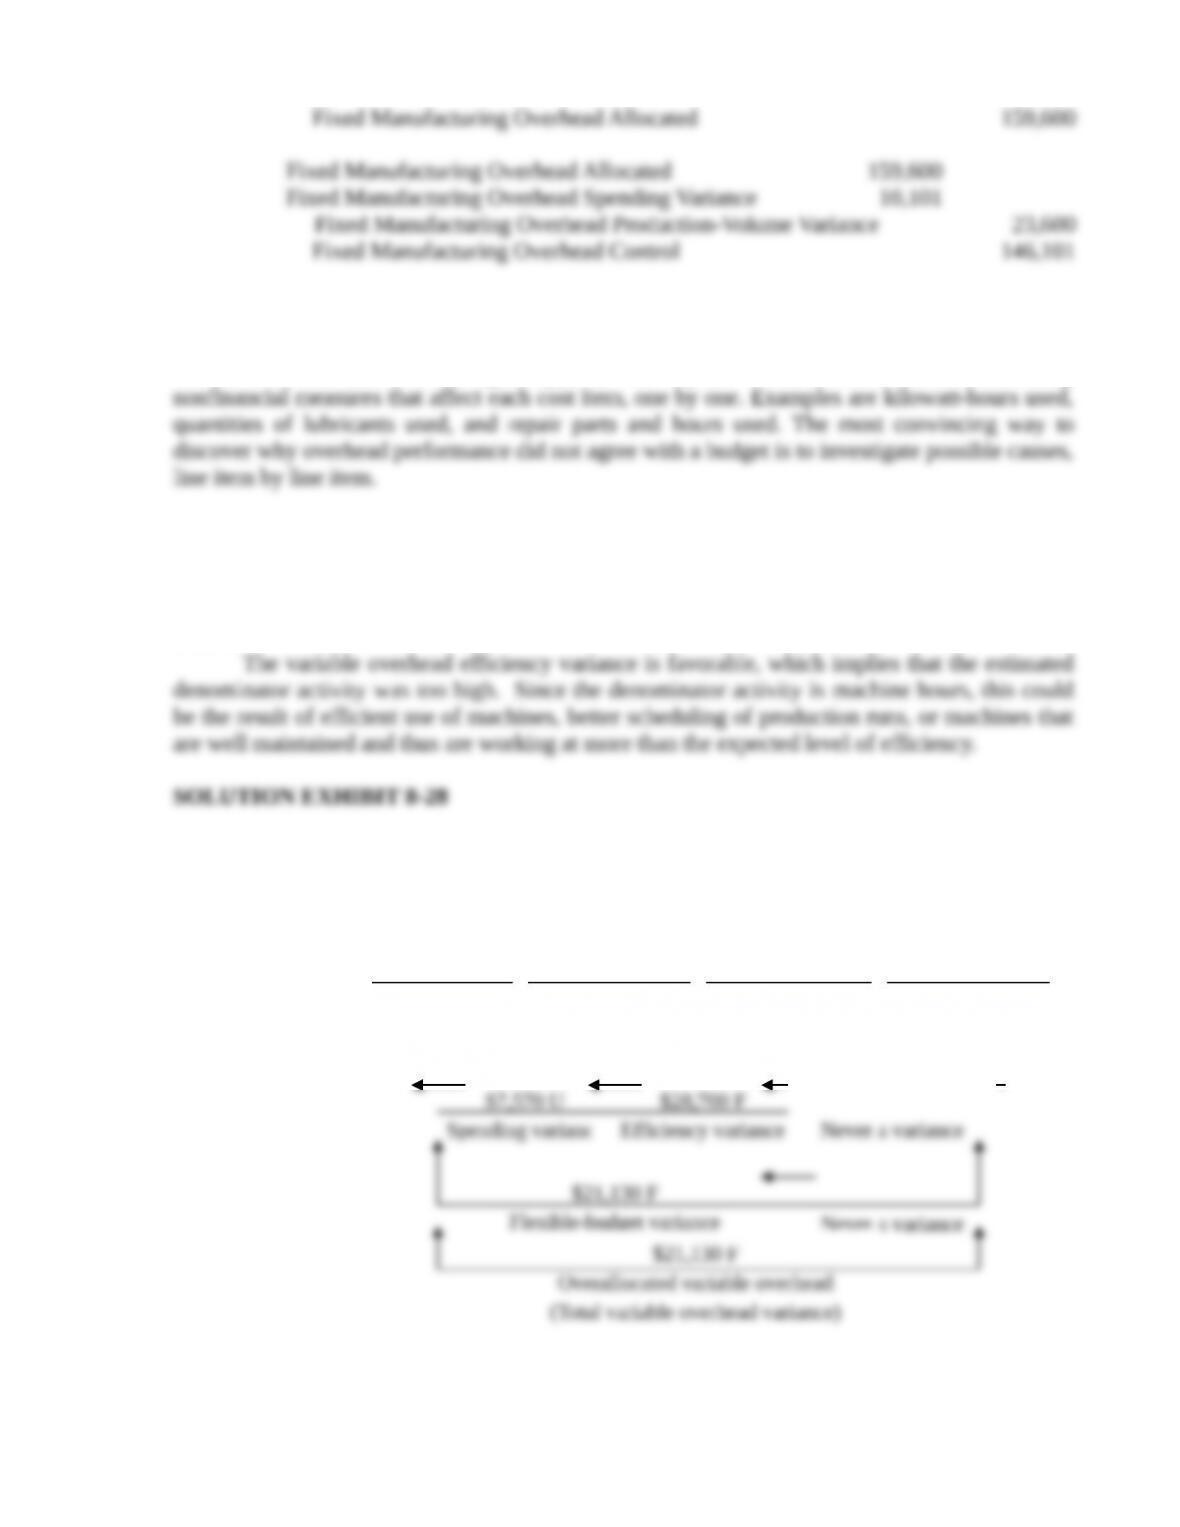
Actual Costs
Incurred
(1)
Actual Input
× Budgeted Rate
(2)
Flexible Budget:
Budgeted Input
Allowed for
Actual Output
× Budgeted Rate
(3)
Allocated:
Budgeted Input
Allowed for
Actual Output
× Budgeted Rate
(4)
Variable
Manufacturing
Overhead
$537,470
(75,700 × $7)
$529,900
(79,800 × $7)
$558,600
(79,800 × $7)
$558,600
Actual Costs
Incurred
(1)
Same Budgeted
Lump Sum
(as in Static Budget)
Regardless of
Output Level
(2)
Flexible Budget:
Same Budgeted
Lump Sum
(as in Static Budget)
Regardless of
Output Level
(3)
Allocated:
Budgeted Input
Allowed for
Actual Output
× Budgeted Rate
(4)
Fixed
Manufacturing
Overhead
$146,101 $136,000 $136,000
(79,800 × $2)
$159,600
$10,101 U
Spending variance
Never a variance
$23,600 F
Production-volume variance
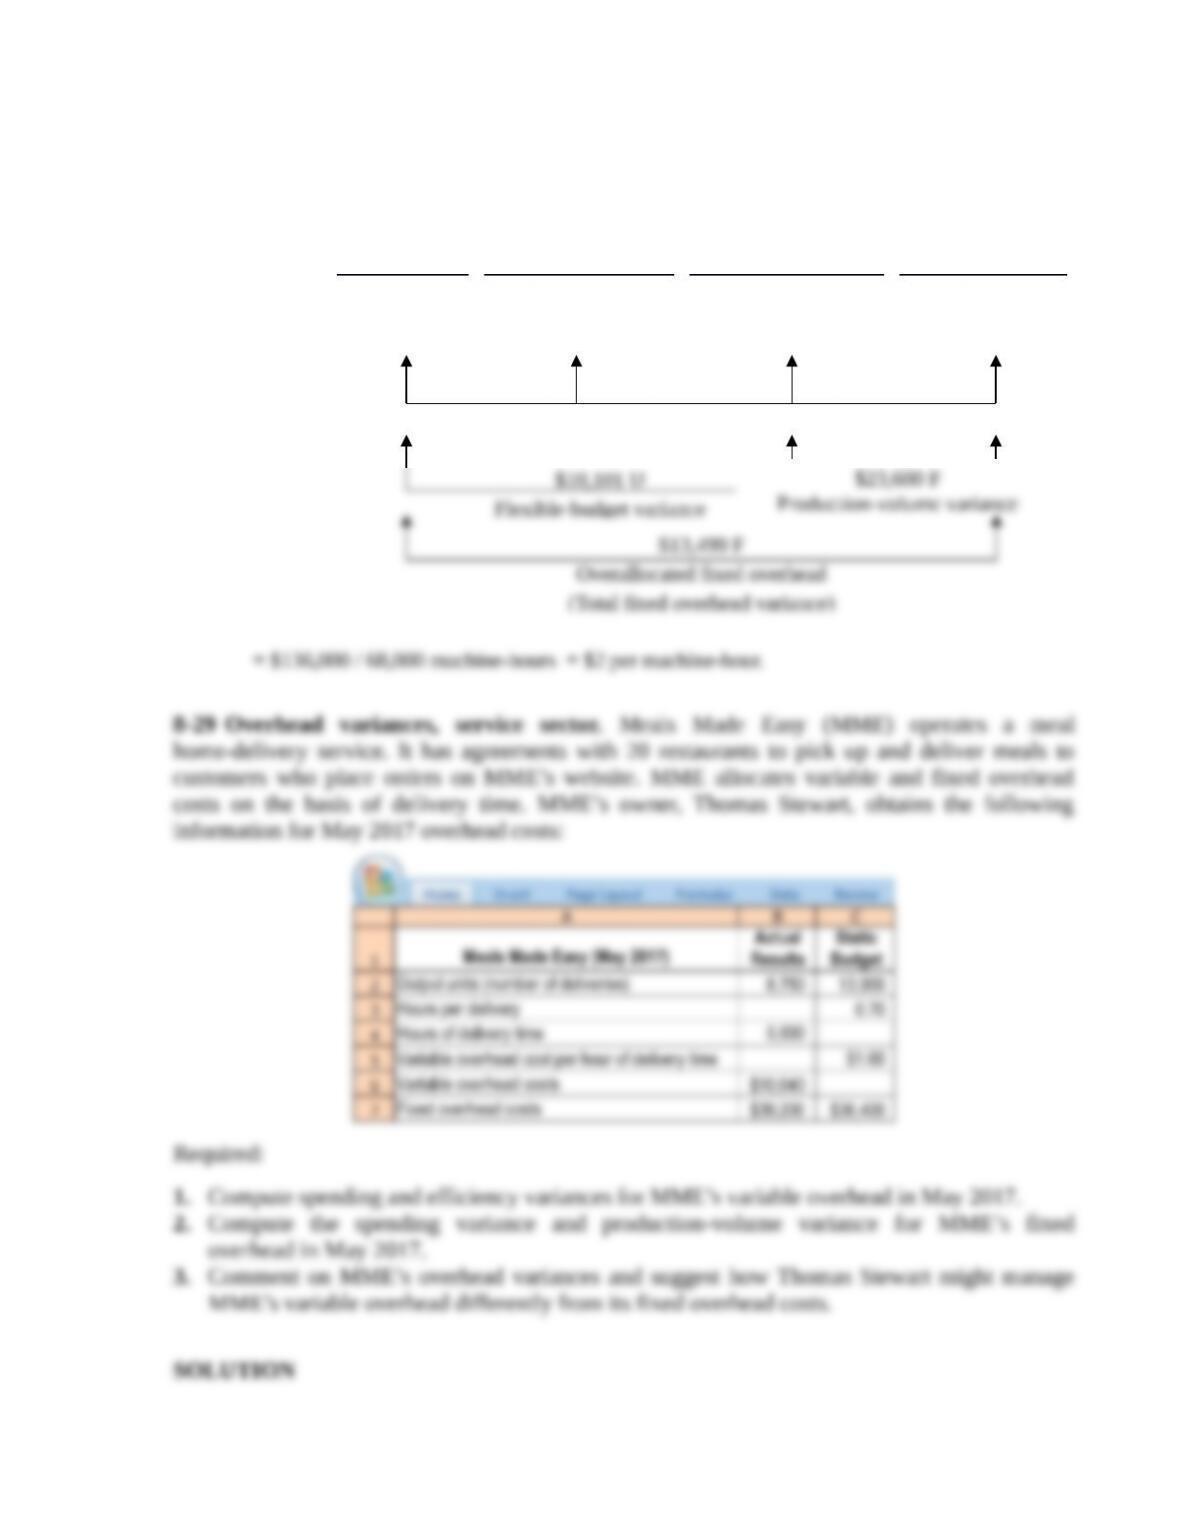
(20–25 min.) Overhead variances, service sector.
1.
Meals Made Easy (MME)
(May 2017)
Actual
Results
Flexible
Budget
Static
Budget
Output units (number of deliveries) 8,750 8,750 13,000
Hours per delivery 0.64a 0.70 0.70
a 5,600 hours
¸
8,750 deliveries = 0.64 hours per delivery
b hrs. per delivery
´
actual number of deliveries = 0.70
´
8,750 = 6,125 hours
c hrs. per delivery
´
expected number of deliveries = 0.70
´
13,000 = 9,100 hours
´
´
´
´
¸
Static budget delivery hours = $36,400
¸
9,100 hours = $4 per hour
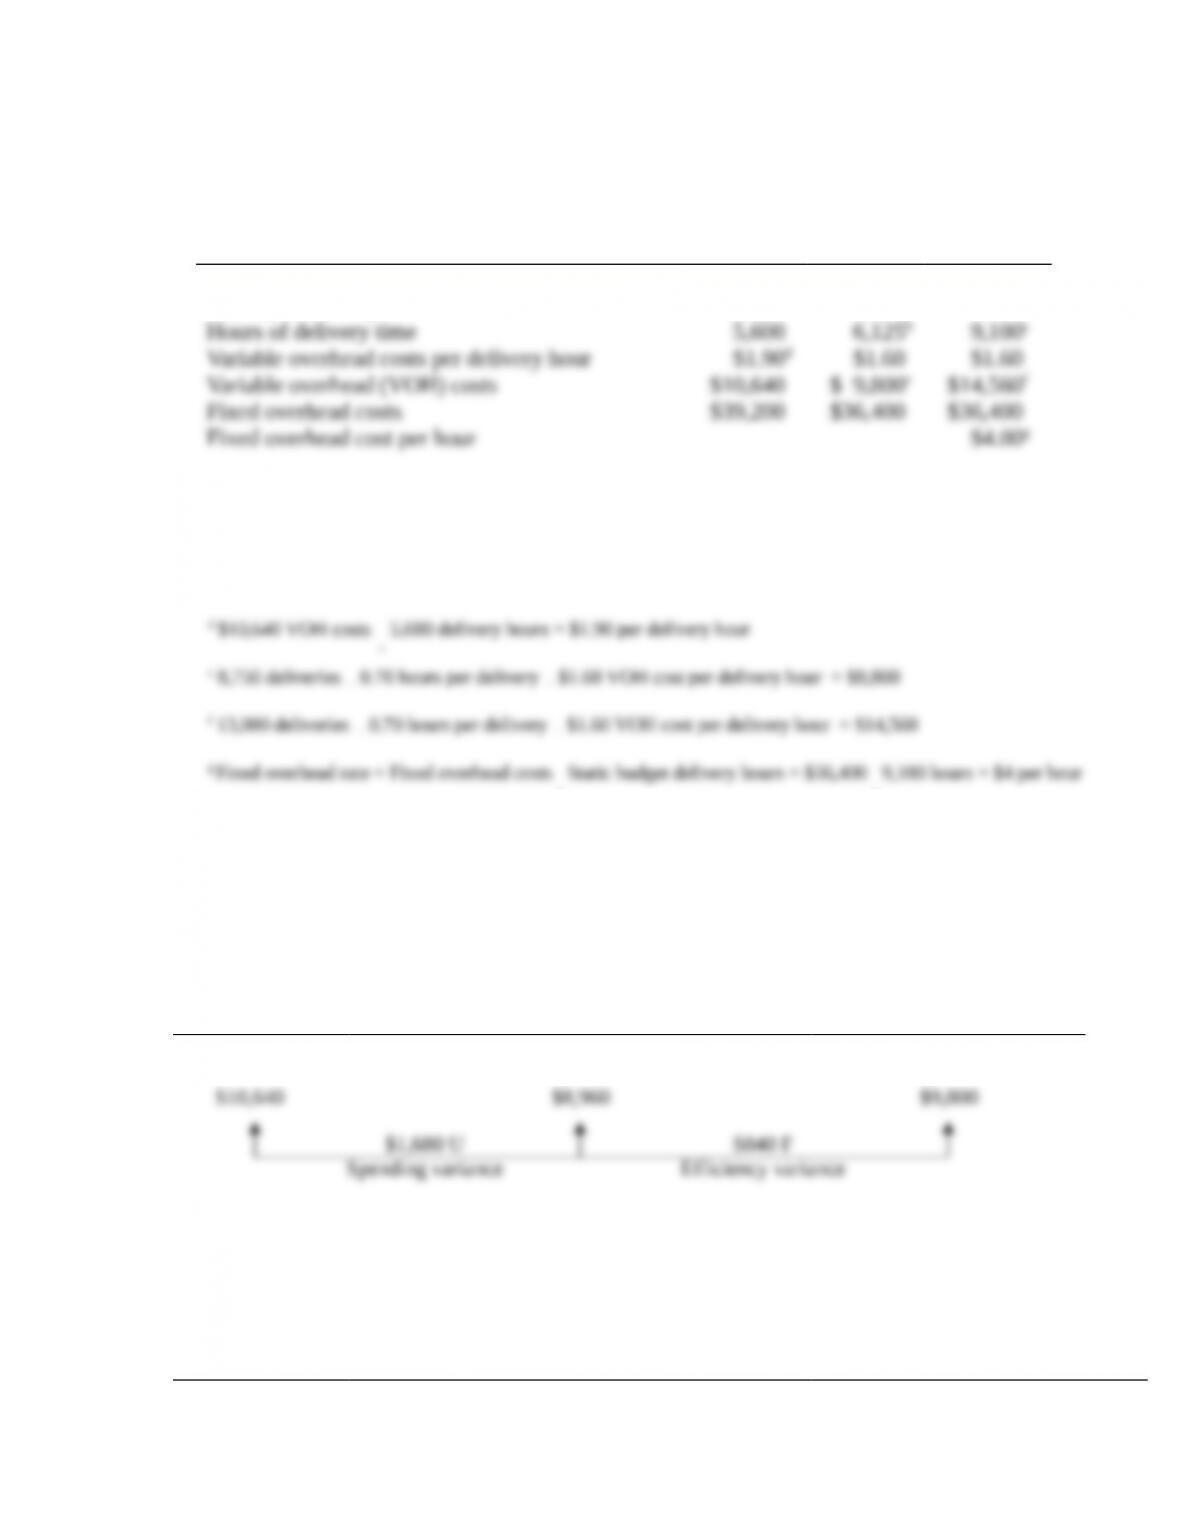
VARIABLE OVERHEAD
Actual Costs
Incurred
Actual Input Qty.
´
Budgeted Rate
Flexible Budget:
Budgeted Input Qty.
Allowed for
Actual Output
´
Budgeted Rate
5,600 hrs
´
$1.60 per hr. 6,125 hrs
´
$1.60 per hr.
2.
FIXED OVERHEAD
Actual Costs
Incurred
Flexible Budget:
Same Budgeted
Lump Sum
(as in Static Budget)
Allocated:
Budgeted Input Qty. Allowed for
Actual Output
Regardless of Output
Level
´
Budgeted Rate
6,125 hrs.
´
$4/hr.
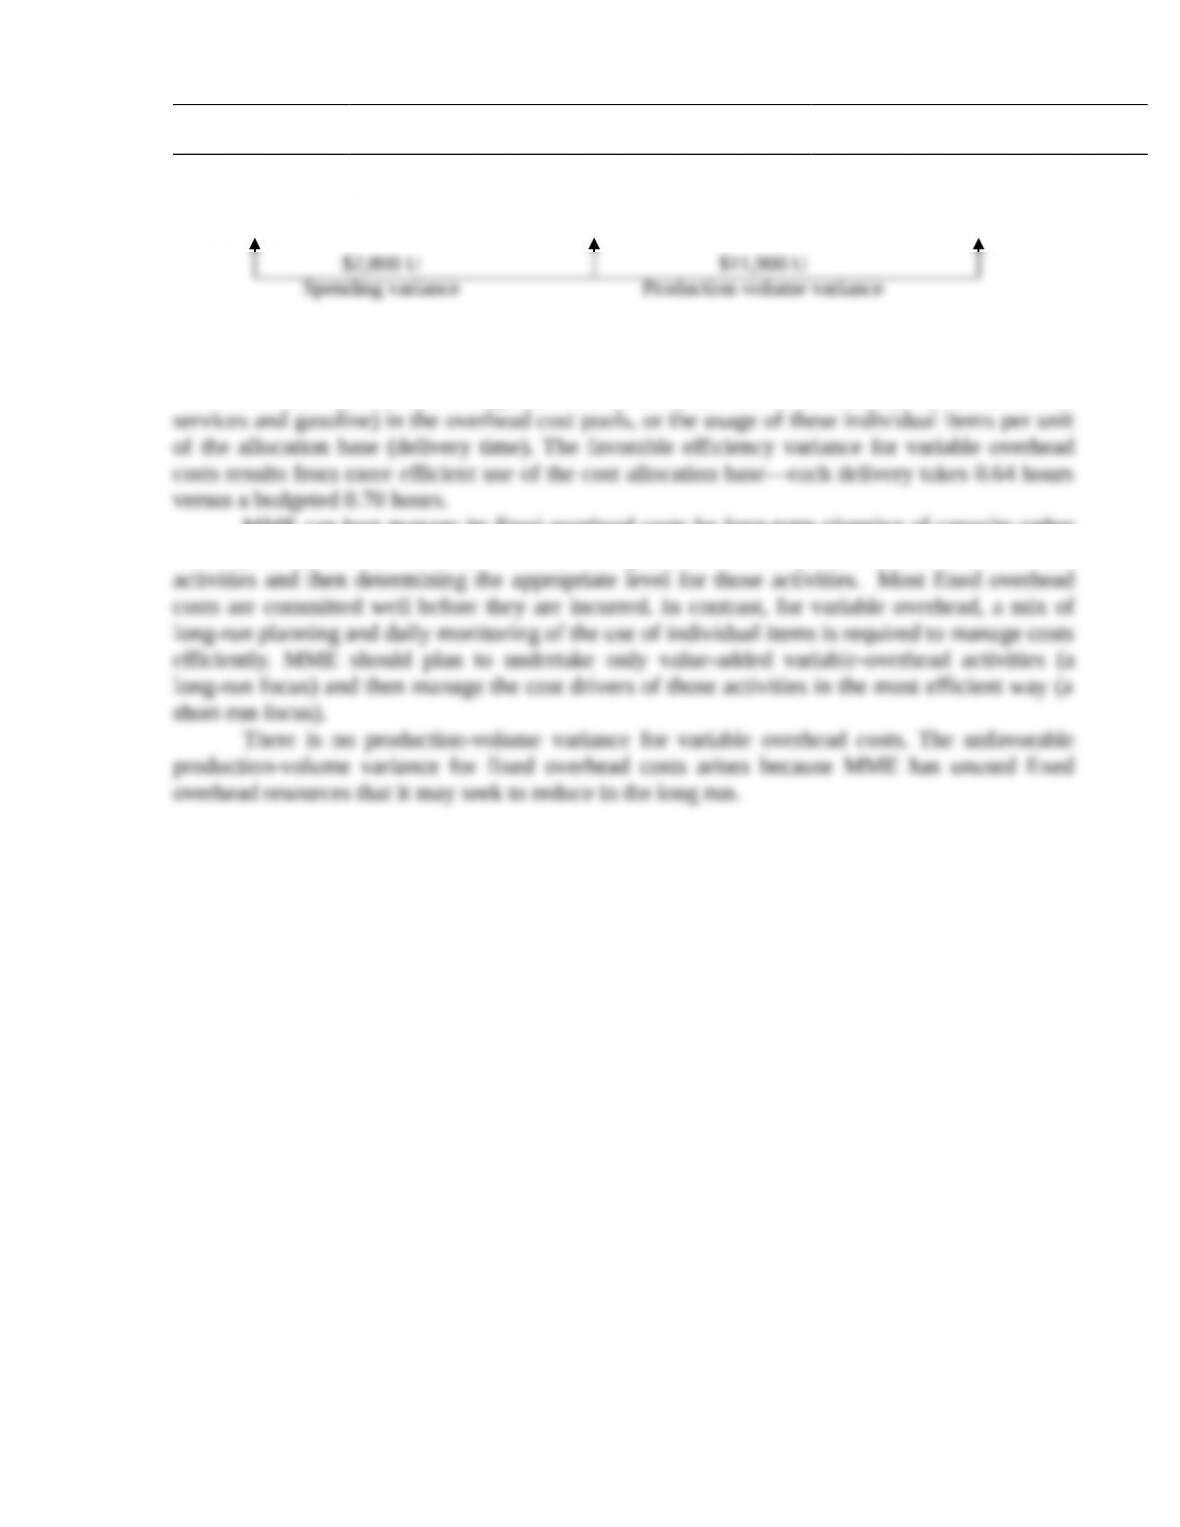
$39,200 $36,400 $24,500
3. The spending variances for variable and fixed overhead are both unfavorable. This means
that MME had increases over budget in either or both the cost of individual items (such as web
MME can best manage its fixed overhead costs by long-term planning of capacity rather
than day-to-day decisions. This involves planning to undertake only value-added fixed-overhead
8-30 Total overhead, 3-variance analysis. Pampered Pets, Inc., makes embellished accessories
primarily for dogs. For 2017, budgeted variable overhead is $70,000 for 10,000 direct
labor-hours. Budgeted total overhead is $100,000 at 8,000 direct labor-hours. The standard costs
allocated to the production of these accessories included a total overhead rate of 80% of standard
direct labor costs.
In May 2017, Pampered Pets incurred total overhead of $133,000 and direct labor costs of
$178,125. The direct labor efficiency variance was $7,500 unfavorable. The direct labor
flexible-budget variance was $1,875 favorable. The standard labor price was $15 per hour. The
production-volume variance was $16,000 favorable.
Required:
1. Compute the direct labor price variance.
2. Compute the denominator level and the spending and efficiency variances for total
overhead.
3. Describe how individual variable overhead items are controlled from day to day. Also,
describe how individual fixed overhead items are controlled.
SOLUTION
(4550 min.) Total overhead, 3-variance analysis.
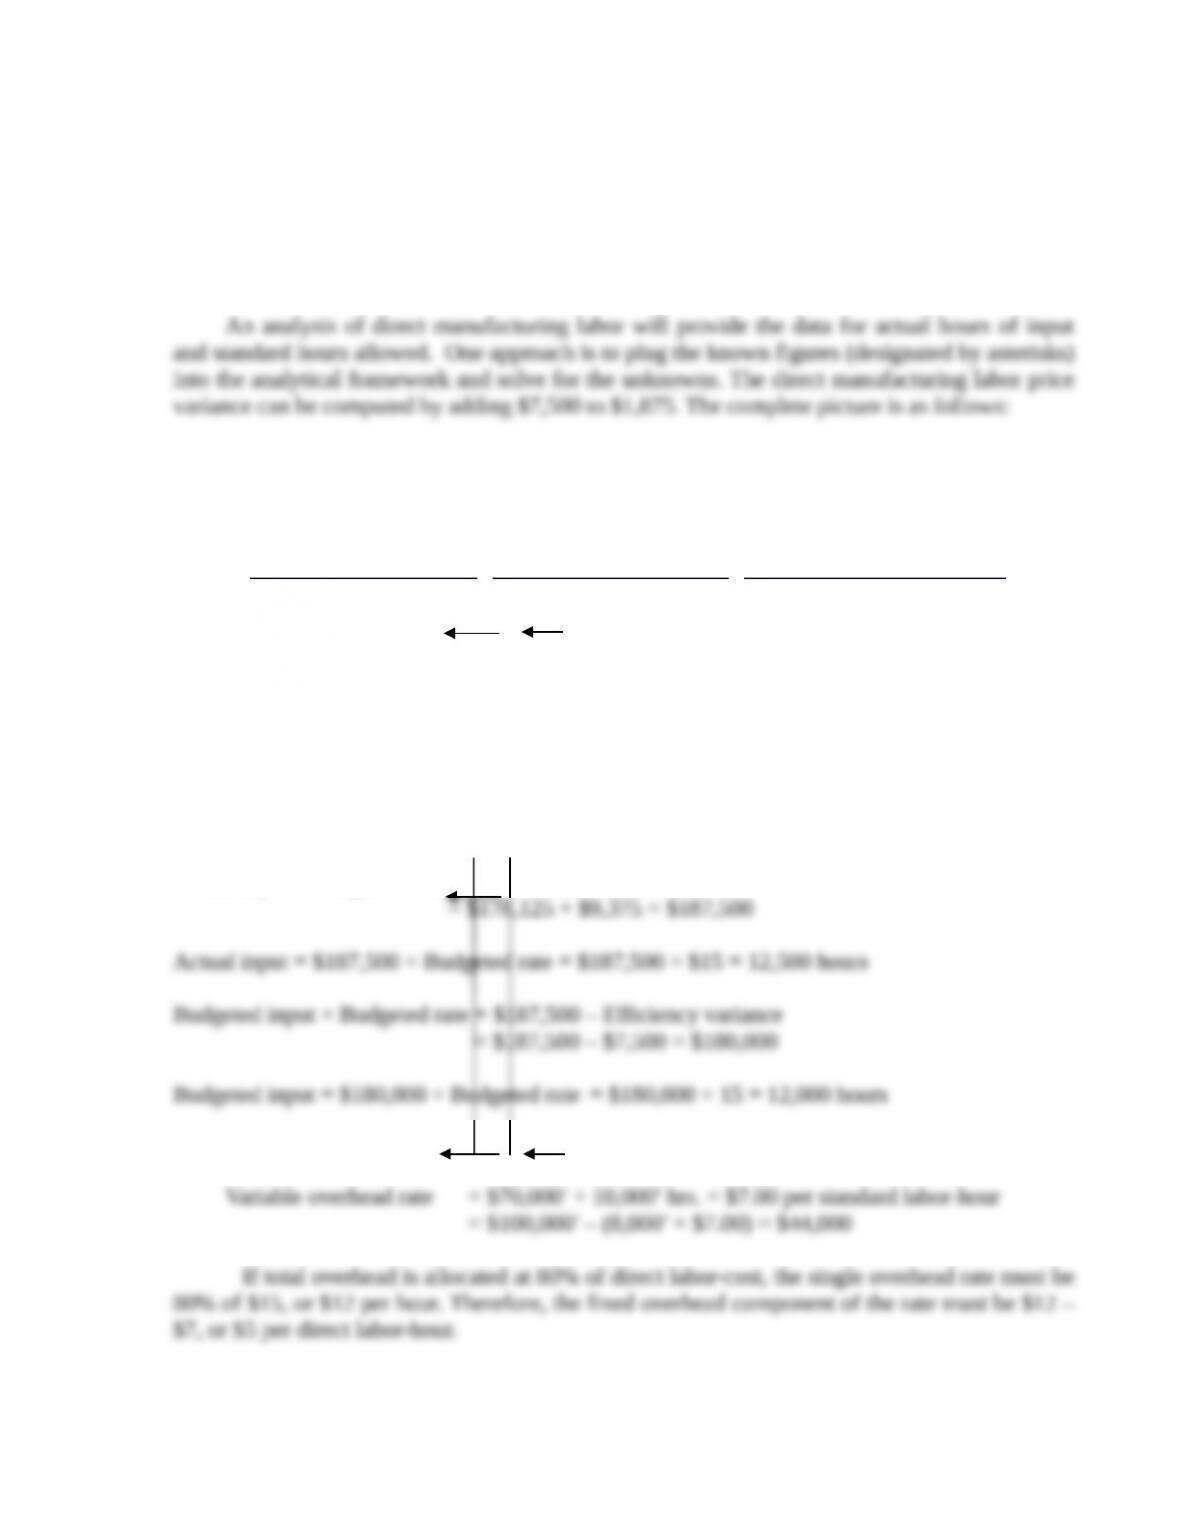
1. This problem has two major purposes: (a) to give experience with data allocated on a total
overhead basis instead of on separate variable and fixed bases and (b) to reinforce distinctions
between actual hours of input, budgeted (standard) hours allowed for actual output, and
denominator level.
Actual Costs
Incurred
Actual Input
× Budgeted Rate
Flexible Budget:
Budgeted Input
Allowed for
Actual Output
× Budgeted Rate
(12,500 hrs. × $14.25)
$178,125*
(12,500 hrs. × $15.00*)
$187,500
(12,000 hrs. × $15.00*)
$180,000
* Given
Direct Labor calculations
Actual input × Budgeted rate = Actual costs + Price variance
2. The calculations for total overhead are given below.
$9,375 F
Price variance
$7,500 U*
Efficiency variance
$1,875 F*
Flexible-budget variance
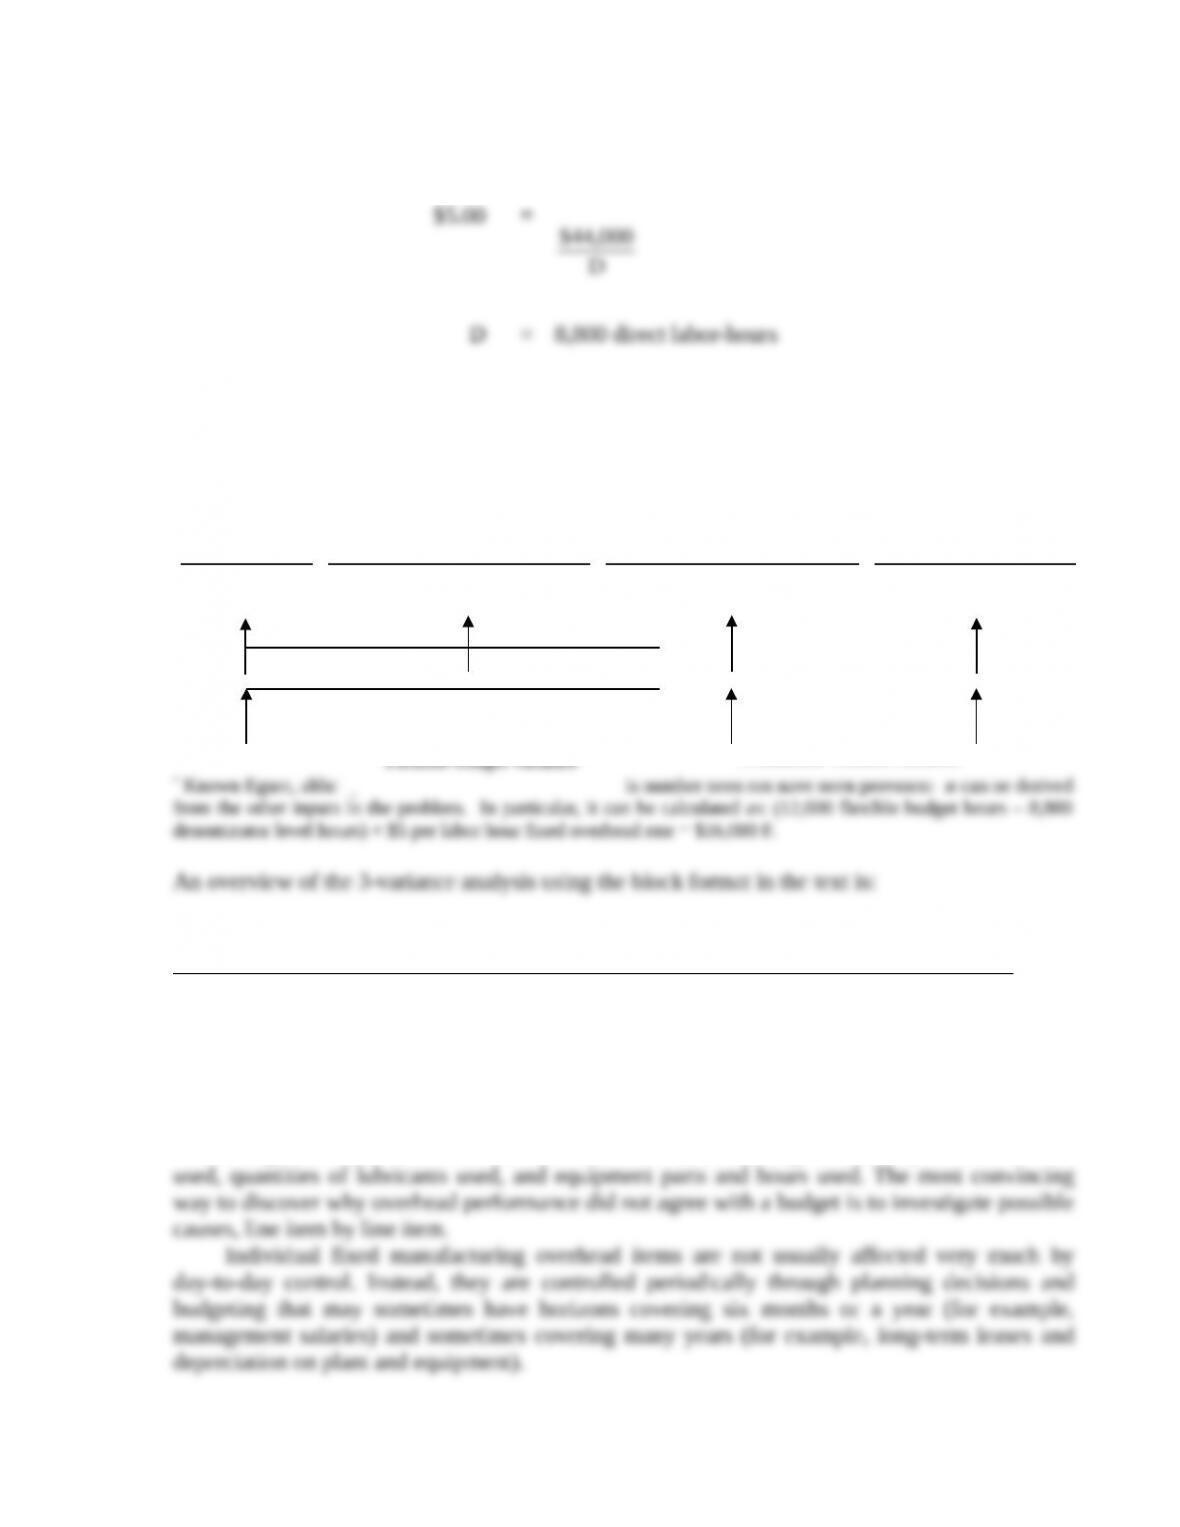
Let D = denominator level in input units
Budgeted fixed overhead rate =
A summary 3-variance analysis for May follows:
Actual Costs
Incurred
Actual Inputs
× Budgeted Rate
Flexible Budget:
Budgeted Input
Allowed for
Actual Output
× Budgeted Rate
Allocated:
Budgeted Input
Allowed for
Actual Output
× Budgeted Rate
$133,000*
$44,000 + (12,500 × $7.00)
$131,500
$44,000 + (12,000 × $7)
$128,000
(12,000 hrs. × $12.00)
$144,000
3-Variance
Analysis
Spending
Variance
Efficiency
Variance
Production
Volume Variance
Total
Overhead $1,500 U $3,500 U $16,000 F
3. The control of variable manufacturing overhead requires the identification of the cost
drivers for such items as energy, supplies, equipment, and maintenance. Control often entails
monitoring nonfinancial measures that affect each cost item, one by one. Examples are kilowatts
$1,500 U
Spending variance
$3,500 U
Efficiency variance
$16,000 F*
Production-volume variance
$5,000 U
Flexible-budget variance
$16,000 F*
Production-volume variance
8-31 Production-volume variance analysis and sales-volume variance. Chart Hills Company
makes customized golf shirts for sale to golf courses. Each shirt requires 3 hours to produce
because of the customized logo for each golf course. Chart Hills uses direct labor-hours to allocate
the overhead cost to production. Fixed overhead costs, including rent, depreciation, supervisory
salaries, and other production expenses, are budgeted at $28,500 per month. The facility currently
used is large enough to produce 5,000 shirts per month.
During March, Chart Hills produced 4,200 shirts and actual fixed costs were $28,000.
Required:
1. Calculate the fixed overhead spending variance and indicate whether it is favorable (F) or
unfavorable (U).
2. If Chart Hills uses direct labor-hours available at capacity to calculate the budgeted fixed
overhead rate, what is the production-volume variance? Indicate whether it is favorable (F) or
unfavorable (U).
3. An unfavorable production-volume variance could be interpreted as the economic cost of
unused capacity. Why would Chart Hills be willing to incur this cost?
4. Chart Hills’ budgeted variable cost per unit is $18, and it expects to sell its shirts for $35
apiece. Compute the sales-volume variance and reconcile it with the production-volume
variance calculated in requirement 2. What does each concept measure?
SOLUTION
(35 min.) Production-volume variance analysis and sales volume variance.
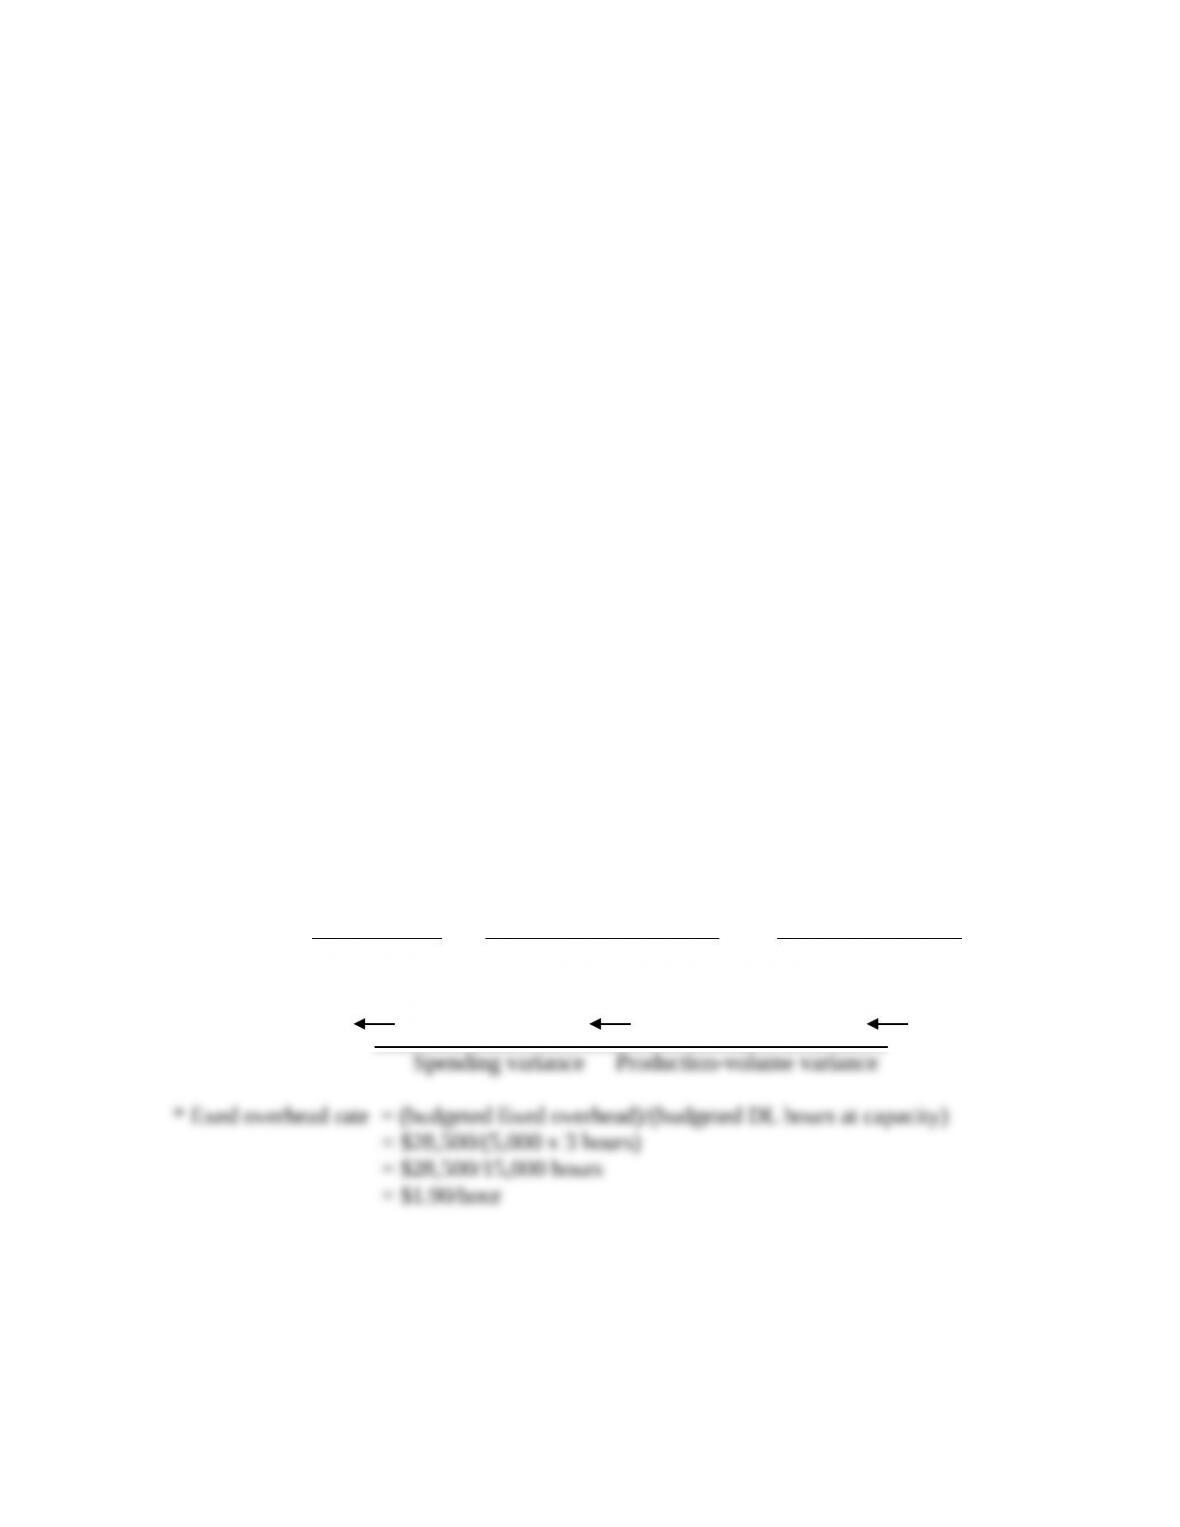
1. and 2. Fixed Overhead Variance Analysis for Chart Hills Company for March
Actual Fixed Static Budget Standard Hours
Overhead Fixed Overhead × Budgeted Rate
(4,200 × 3 × $1.90*)
$28,000 $28,500 $23,940
$500 F $4,560 U
3. An unfavorable production-volume variance measures the cost of unused capacity. Production
at capacity would result in a production-volume variance of 0 since the fixed overhead rate is
based upon expected hours at capacity production. However, the existence of an unfavorable
volume variance does not necessarily imply that management is doing a poor job or incurring
unnecessary costs. Two reasons can be identified.
a. For most products, demand varies from month to month while commitment to the
factors that determine capacity, e.g. size of workshop or supervisory staff, tends to remain
b. Basic economics provides a demand curve that shows a tradeoff between price charged
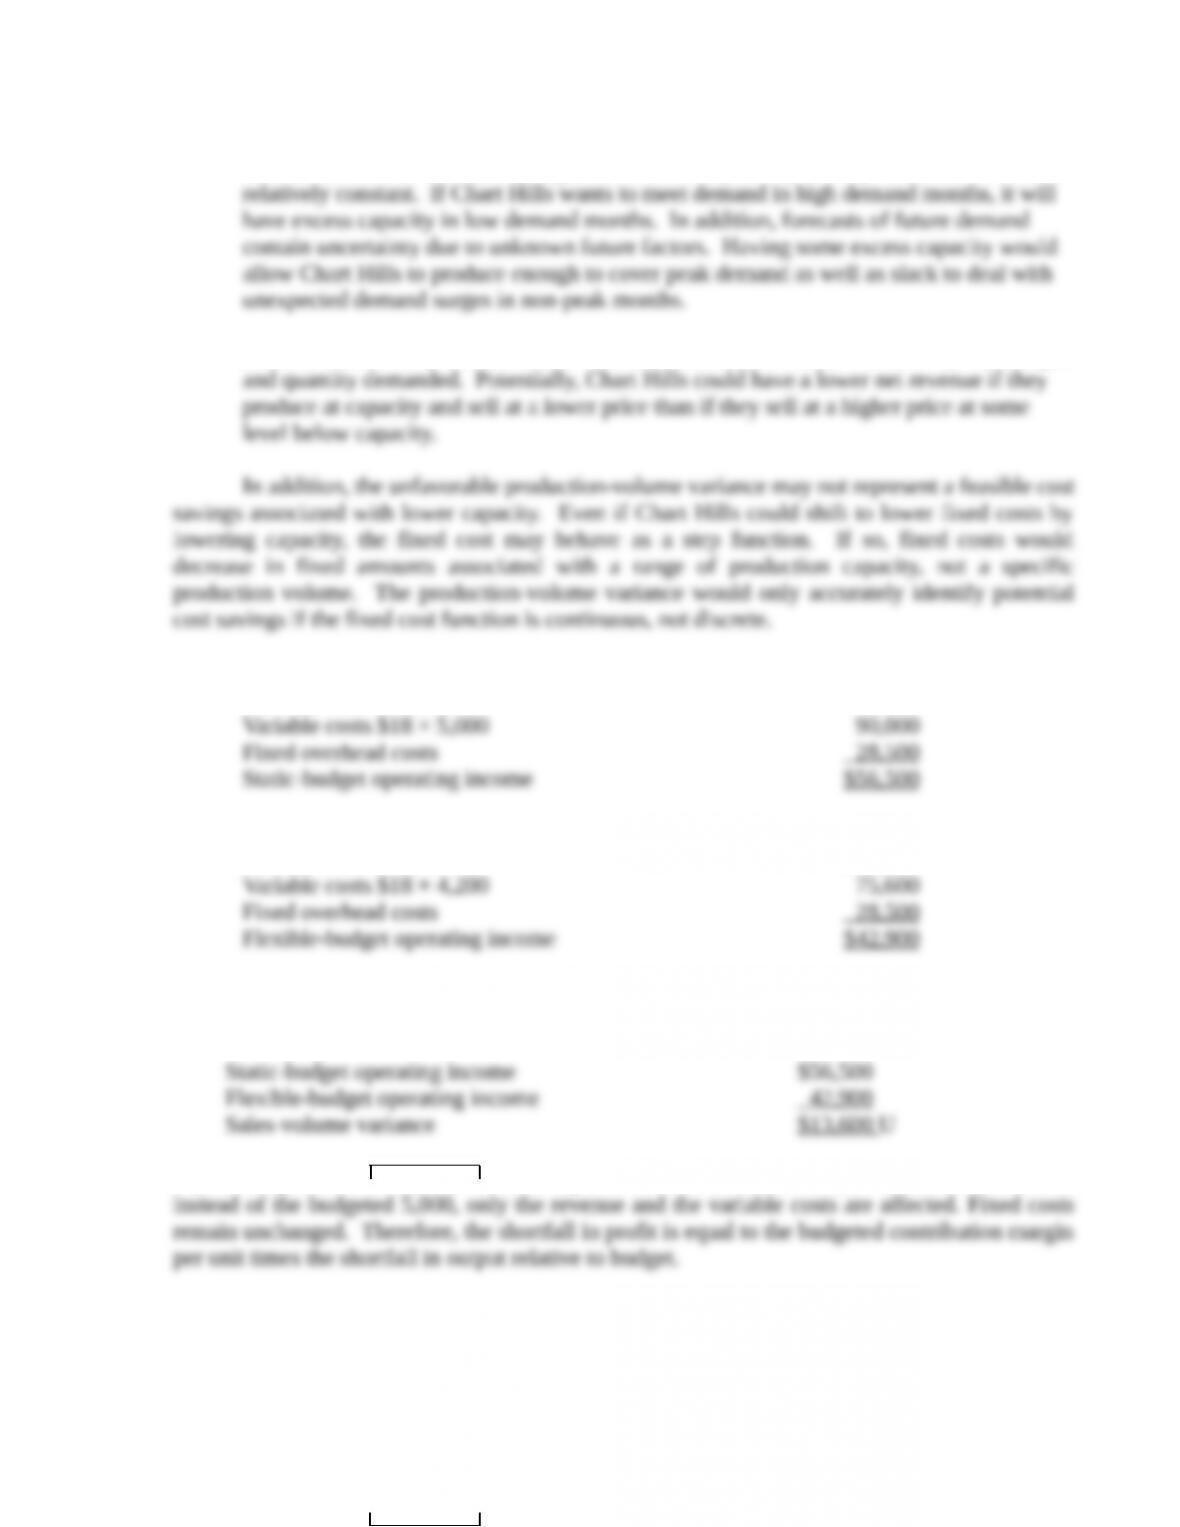
4. The static-budget operating income for March is:
Revenues $35 × 5,000 $175,000
The flexible-budget operating income for March is:
Revenues $35 × 4,200 $147,000
The sales-volume variance represents the difference between the static-budget operating income
and the flexible-budget operating income:
Equivalently, the sales-volume variance captures the fact that when Chart Hills sells 4,200 shirts
= – ×
In contrast, we computed in requirement 2 that the production-volume variance was $4,560 U.
This captures only the portion of the budgeted fixed overhead expected to be unabsorbed because
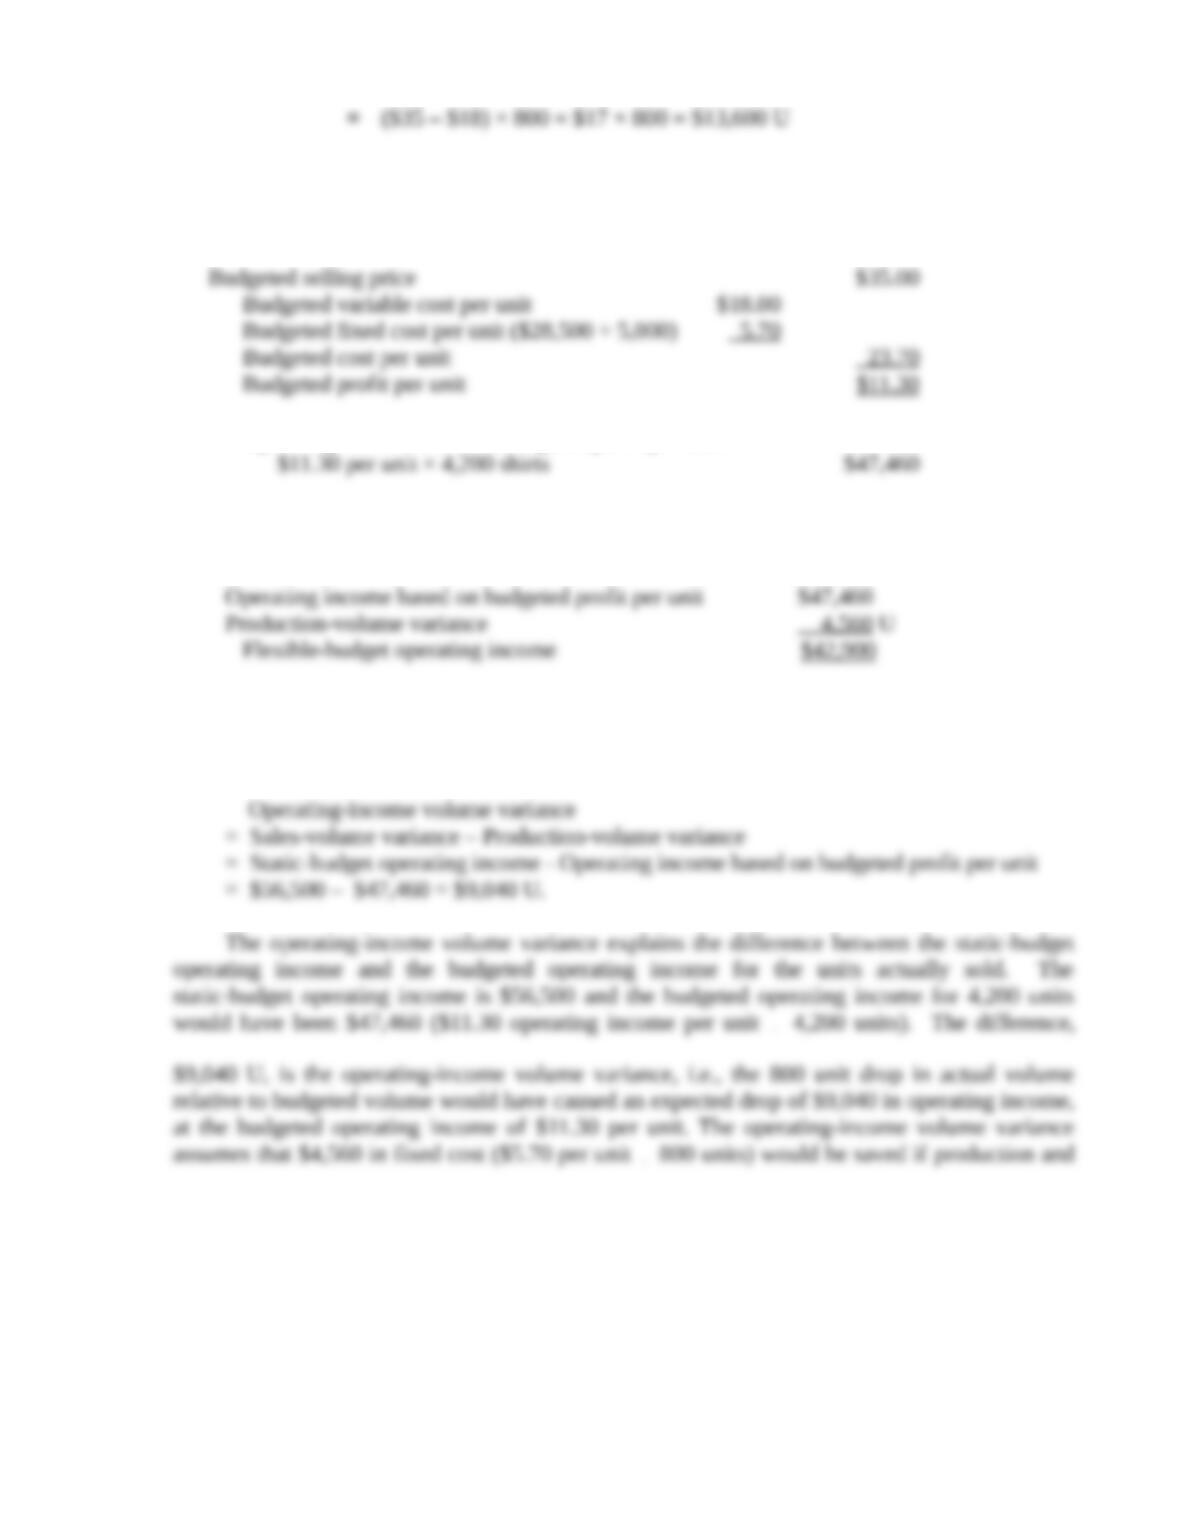
of the 800-unit shortfall. To compare it to the sales-volume variance, consider the following:
Operating income based on budgeted profit per unit
The $4,560 U production-volume variance explains the difference between operating income
based on the budgeted profit per unit and the flexible-budget operating income:
Since the sales-volume variance represents the difference between the static- and flexible-budget
operating incomes, the difference between the sales-volume and production-volume variances,
which is referred to as the operating-income volume variance is:
´
´
sales volumes decreased by 800 units.
8-32 Overhead variances, service setting. Carlyle Capital Company offers financial services to
its clients. Recently, Carlyle has experienced rapid growth and has increased both its client base
and the variety of services it offers. The company is becoming concerned about its rising costs,
however, particularly related to technology overhead.
After some study, Carlyle determines that its variable and fixed technology overhead costs
are both driven by the processing time involved in meeting client requests. This is typically
measured in CPU units of their computer usage. Carlyle’s measure of output is the number of
client interactions in a given period.
The technology budget for Carlyle for the first quarter of 2017 was as follows:
Client interactions 12,000
Fixed Overhead $14,400
Variable Overhead 4,800 CPU units @ $2 per CPU unit
The actual results for the first quarter of 2017 are given below:
Client interactions 13,600
Fixed Overhead $14,100
Variable Overhead $11,200
CPU Units used 5,500
Required:
1. Calculate the variable overhead spending and efficiency variances, and indicate whether each
is favorable (F) or unfavorable (U).
2. Calculate the fixed overhead spending and production-volume variances, and indicate
whether each is favorable (F) or unfavorable (U).
3. Comment on Carlyle Capital’s overhead variances. In your view, is the firm right to be
worried about its control over technology spending?