SOLUTION
(20 min.) Overhead variances, service setting.
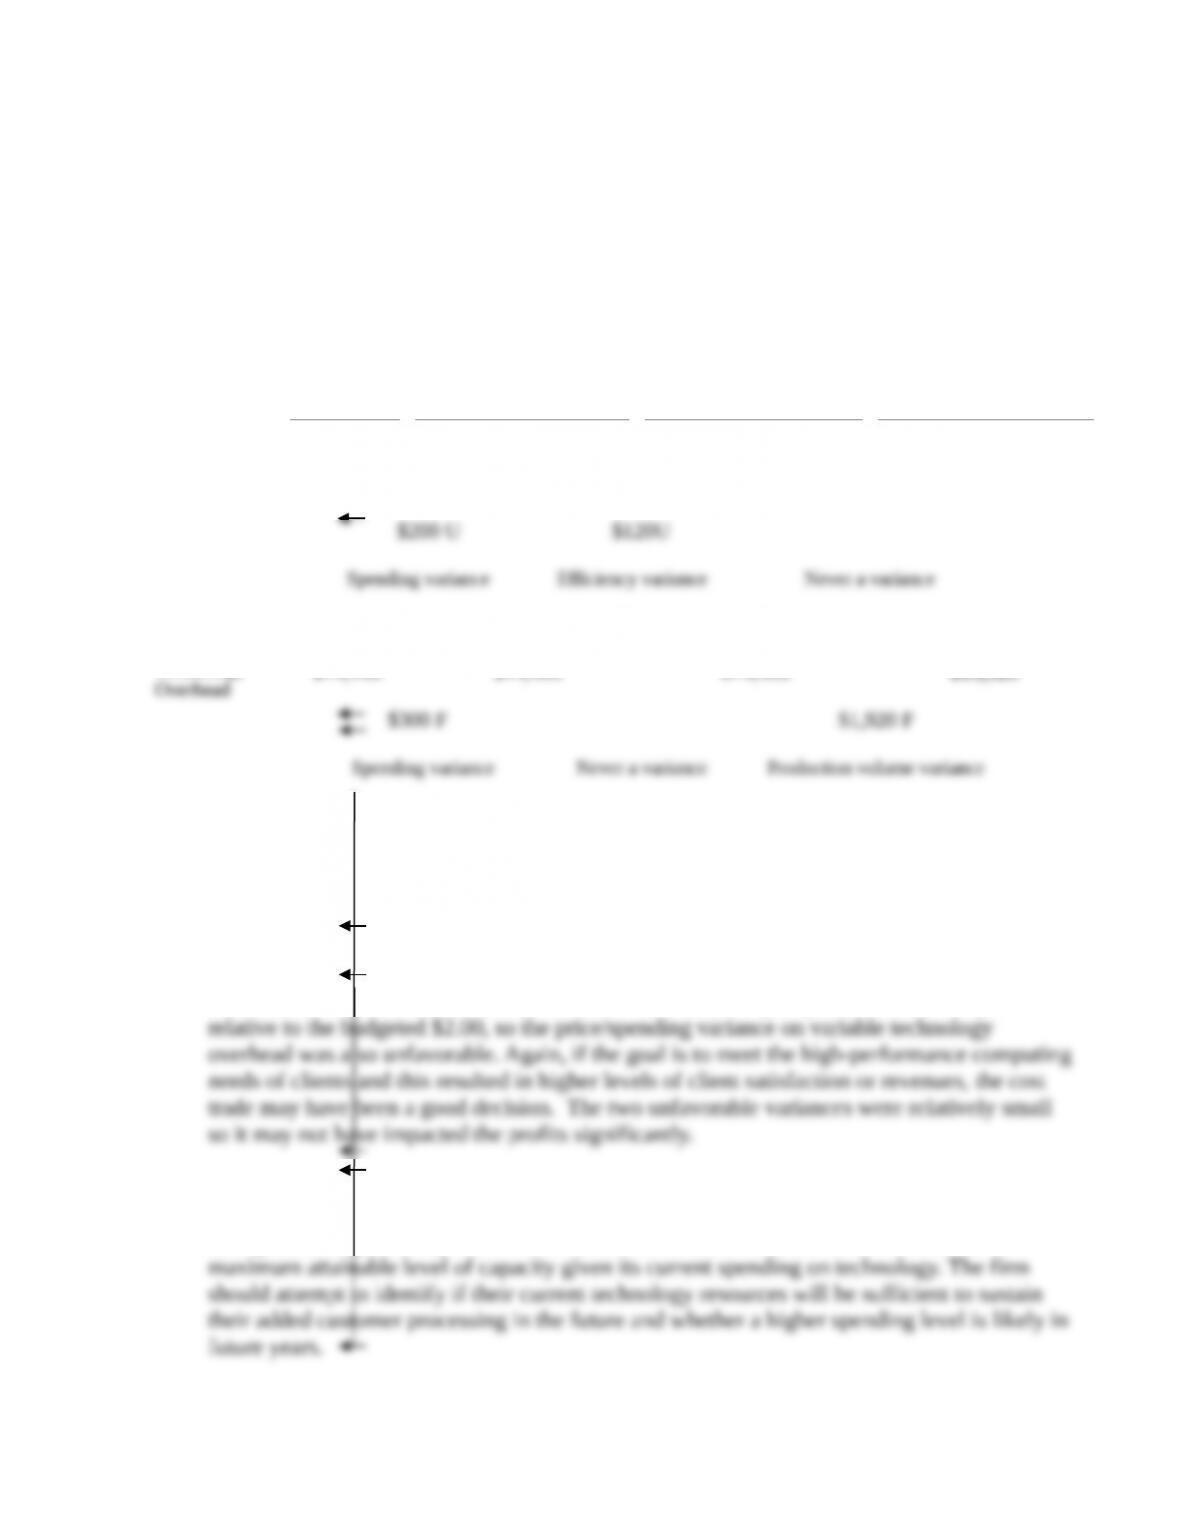
1. and 2. Variable and Fixed Technology Overhead Variance Analysis for Carlyle Capital
Company for the first quarter of 2017
Actual Costs
Incurred
Actual Input Qty.
Budgeted Rate
Flexible Budget:
Budgeted Input Qty.
Allowed for
Actual Output
Budgeted Rate
Allocated:
(Budgeted Input Qty.
Allowed for
Actual Output
Budgeted Rate)
Variable
Technology
Overhead $11,200
(5,500 $2)
$11,000
(13,600 0.4 $2)
$10,880
(13,600 0.4 $2)
$10,880
Fixed
Technology
(13,600 0.4 $3)
$16,320
3. Carlyle Capital has done a reasonable job overall of managing its technology overhead costs.
It has both an unfavorable variable overhead spending and efficiency variance. Carlyle had
an unfavorable efficiency variance because it used too many CPU units of processing time
relative to the number of client interactions it had. This is not an issue if the goal was to meet
the high-performance computing needs of clients and resulted in higher levels of client
satisfaction or revenues. For the 5,500 CPU units used, Carlyle spent almost $2.04 per unit
From the standpoint of capacity utilization, Carlyle Capital was successful at managing the
fixed technology overhead resources. They handled 13,600 client interactions, compared to
an expected output of 12,000. It would be useful to know what the firm views as the

8-33 Identifying favorable and unfavorable variances. Tred-America, Inc., manufactures tires
for large auto companies. It uses standard costing and allocates variable and fixed manufacturing
overhead based on machine-hours. For each independent scenario given, indicate whether each of
the manufacturing variances will be favorable or unfavorable or, in case of insufficient
information, indicate “CBD” (cannot be determined).
Scenario
Variable
Overhead
Spending
Variance
Variable
Overhead
Efficiency
Variance
Fixed
Overhead
Spending
Variance
Fixed
Overhead
Production-
Volume
Variance
Production output is 8% more
than budgeted, and actual fixed
manufacturing overhead costs
are 7% less than budgeted
Production output is 11% more
than budgeted; actual
machine-hours are 5% less than
budgeted
Production output is 15% less
than budgeted
Actual machine-hours are 18%
greater than flexible-budget
machine-hours
Relative to the flexible budget,
actual machine-hours are 10%
greater, and actual variable
manufacturing overhead costs
are 15% less
SOLUTION
(15 min.) Identifying favorable and unfavorable variances.
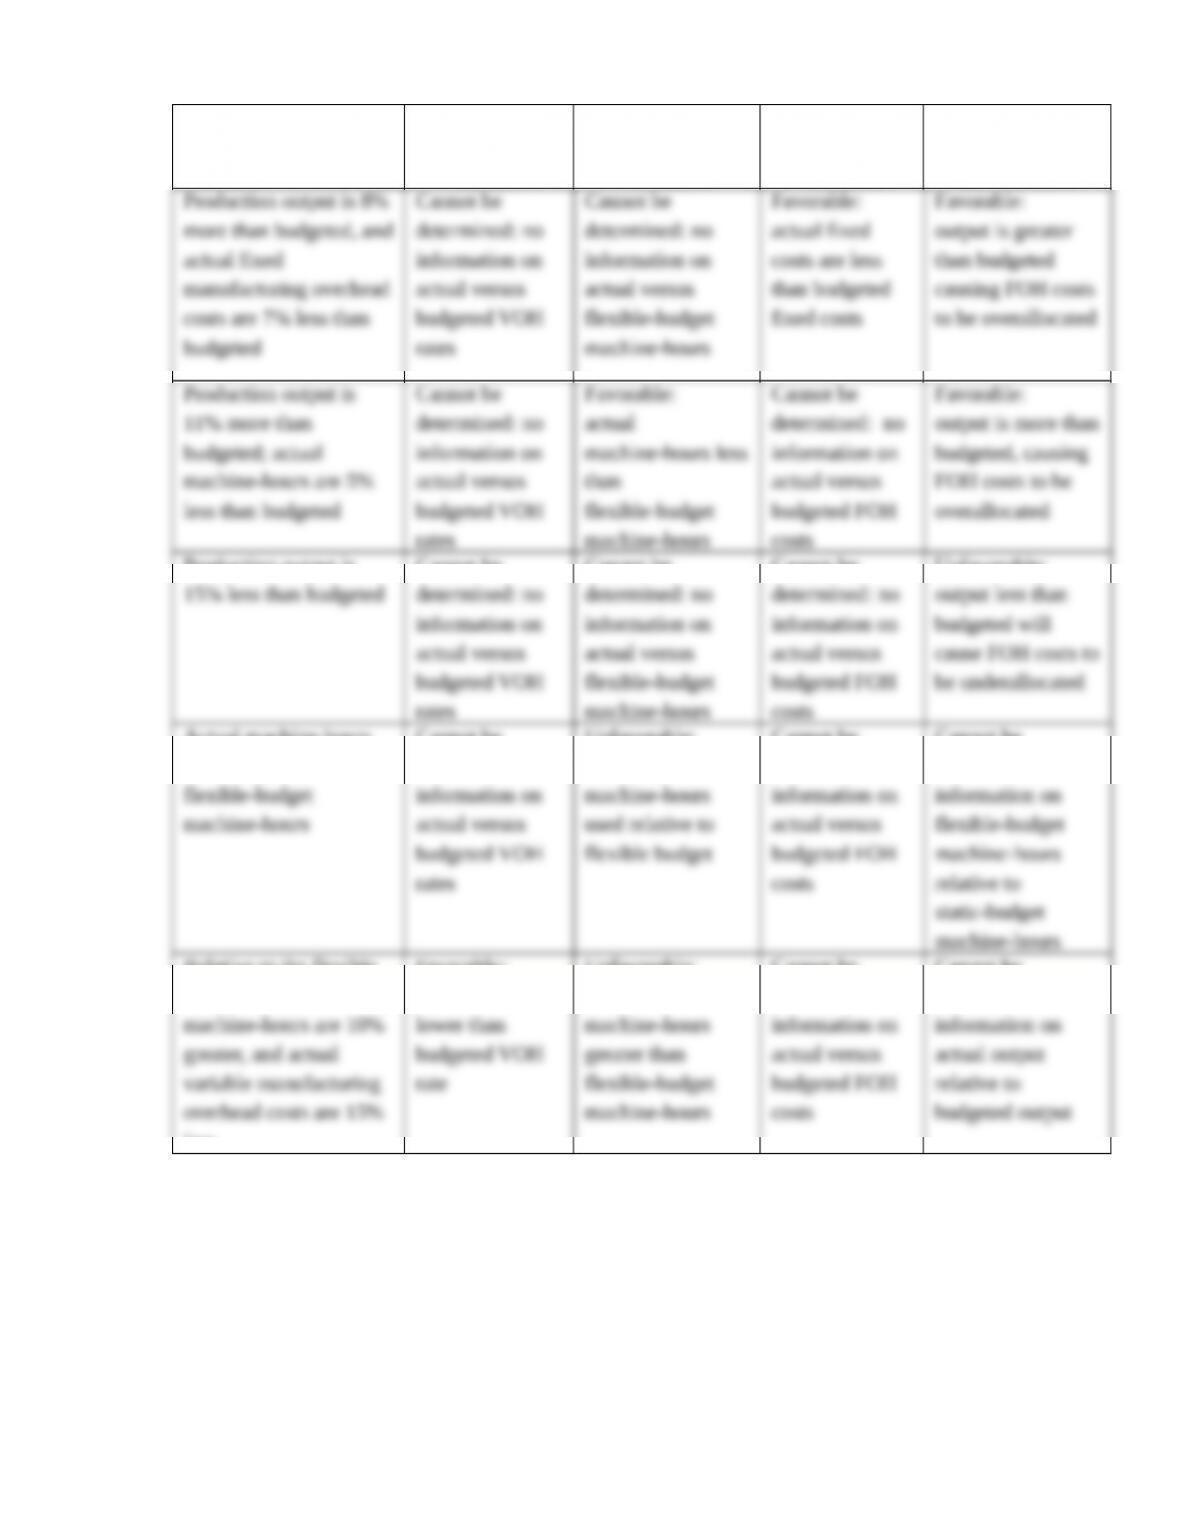
Scenario
VOH
Spending
Variance
VOH
Efficiency
Variance
FOH
Spending
Variance
FOH
Production-Volu
me Variance
Production output is 8%
more than budgeted, and
Cannot be
determined: no
Cannot be
determined: no
Favorable:
actual fixed
Favorable:
output is greater
Production output is
Cannot be
Cannot be
Cannot be
Unfavorable:
Actual machine-hours
are 18% greater than
Cannot be
determined: no
Unfavorable:
too many
Cannot be
determined: no
Cannot be
determined: no
Relative to the flexible
budget, actual
less
Favorable:
actual VOH rate
Unfavorable:
actual
Cannot be
determined: no
Cannot be
determined: no
8-34 Flexible-budget variances, review of Chapters 7 and 8. Eric Williams is a cost
accountant and business analyst for Diamond Design Company (DDC), which manufactures
expensive brass doorknobs. DDC uses two direct-cost categories: direct materials and direct
manufacturing labor. Williams feels that manufacturing overhead is most closely related to
material usage. Therefore, DDC allocates manufacturing overhead to production based upon
pounds of materials used.

At the beginning of 2017, DDC budgeted annual production of 420,000 doorknobs and
adopted the following standards for each doorknob:
Input Cost/Doorknob
Direct materials (brass) 0.3 lb. @ $10/lb. $ 3.00
Direct manufacturing labor 1.2 hours @ $17/hour 20.40
Manufacturing overhead:
Variable $5/lb. × 0.3 lb. 1.50
Fixed $15/lb. × 0.3 lb. 4.50
Standard cost per doorknob $29.40
Actual results for April 2017 were as follows:
Production 29,000 doorknobs
Direct materials purchased 12,400 lb. at $11/lb.
Direct materials used 8,500 lbs.
Direct manufacturing labor 29,200 hours for $671,600
Variable manufacturing overhead $ 65,100
Fixed manufacturing overhead $158,000
Required:
1. For the month of April, compute the following variances, indicating whether each is
favorable (F) or unfavorable (U):
a. Direct materials price variance (based on purchases)
b. Direct materials efficiency variance
c. Direct manufacturing labor price variance
d. Direct manufacturing labor efficiency variance
e. Variable manufacturing overhead spending variance
f. Variable manufacturing overhead efficiency variance
g. Production-volume variance
h. Fixed manufacturing overhead spending variance
2. Can Williams use any of the variances to help explain any of the other variances? Give
examples.
SOLUTION
(35 min.) Flexible-budget variances, review of Chapters 7 and 8.
1. Solution Exhibit 8-34 contains a columnar presentation of the variances for Diamond Design
Company (DDC) for April 2017.
SOLUTION EXHIBIT 8-34
Actual Costs
Incurred:
Actual Input Qty.
Actual Input Qty.
´
Budgeted Price
Flexible Budget:
Budgeted Input Qty.
Allowed for
Actual Output
× Actual Rate Purchases Usage × Budgeted Price
a. Price variance b. Efficiency variance
Direct
Manufacturing
(29,200 $17)
(29,000 1.2 $17)
c. Price variance d. Efficiency variance
Actual Costs
Incurred
Actual Input Qty.
Budgeted Rate
Flexible Budget:
Budgeted Input Qty.
Allowed for
Actual Output
Budgeted Rate
Allocated:
(Budgeted Input Qty.
Allowed for
Actual Output
Budgeted Rate)
Variable
Manufacturing
(8,500 $5)
(8,700 $5)
(29,000 0.3 $5)
e. Spending variance f. Efficiency variance Never a variance
Fixed
(29,000 0.3 $15)
h. Spending variance Never a variance g. Production volume variance
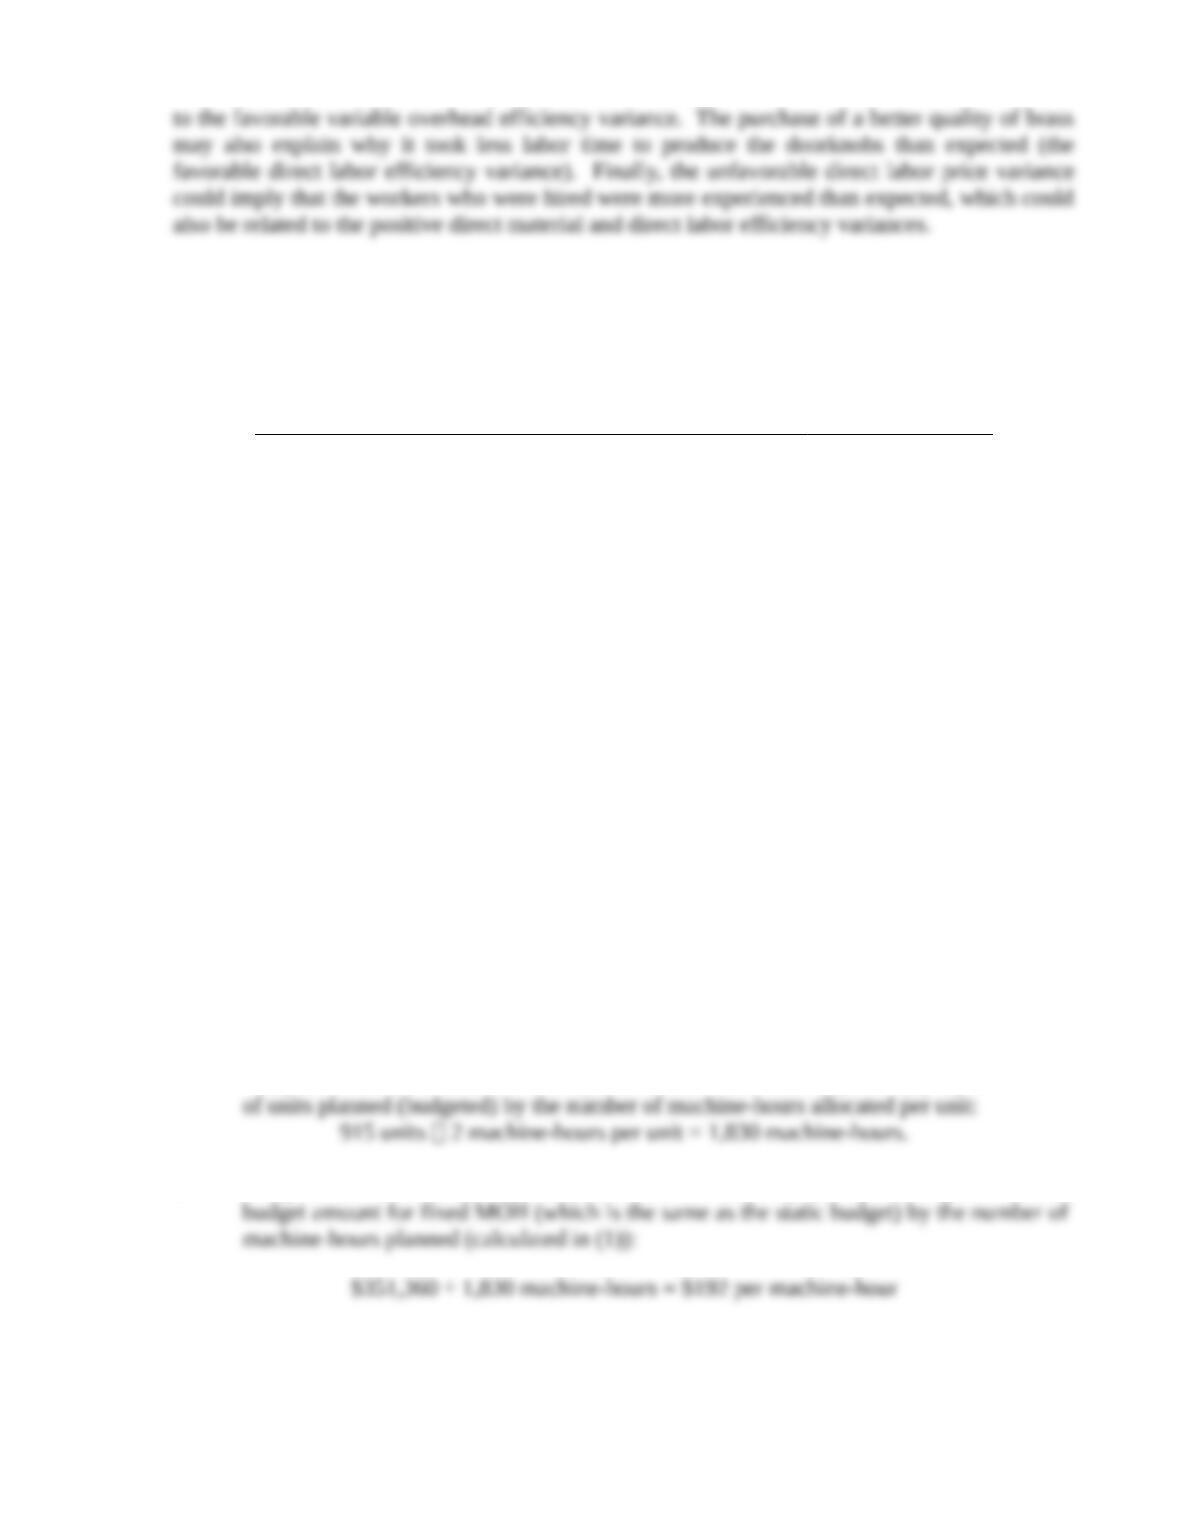
2. The direct materials price variance indicates that DDC paid more for brass than they had
planned. If this is because they purchased a higher quality of brass, it may explain why they
used less brass than expected (leading to a favorable material efficiency variance). In turn, since
variable manufacturing overhead is assigned based on pounds of materials used, this directly led
8-35 Comprehensive variance analysis. Cooking Whiz manufactures premium food
processors. The following are some manufacturing overhead data for Cooking Whiz for the year
ended December 31, 2017:
Manufacturing
Overhead
Actual Results Flexible Budget Allocated
Amount
Variable $ 71,808 $ 80,640 $ 80,640
Fixed 360,672 351,360 368,640
Budgeted number of output units: 915
Planned allocation rate: 2 machine-hours per unit
Actual number of machine-hours used: 1,632
Static-budget variable manufacturing overhead costs: $76,860
Required:
Compute the following quantities (you should be able to do so in the prescribed order):
1. Budgeted number of machine-hours planned
2. Budgeted fixed manufacturing overhead costs per machine-hour
3. Budgeted variable manufacturing overhead costs per machine-hour
4. Budgeted number of machine-hours allowed for actual output produced
5. Actual number of output units
6. Actual number of machine-hours used per output unit
SOLUTION
(30 min.) Comprehensive variance analysis.
1. Budgeted number of machine-hours planned can be calculated by multiplying the number
2. Budgeted fixed MOH costs per machine-hour can be computed by dividing the flexible
3. Budgeted variable MOH costs per machine-hour are calculated as budgeted variable
MOH costs divided by the budgeted number of machine-hours planned:
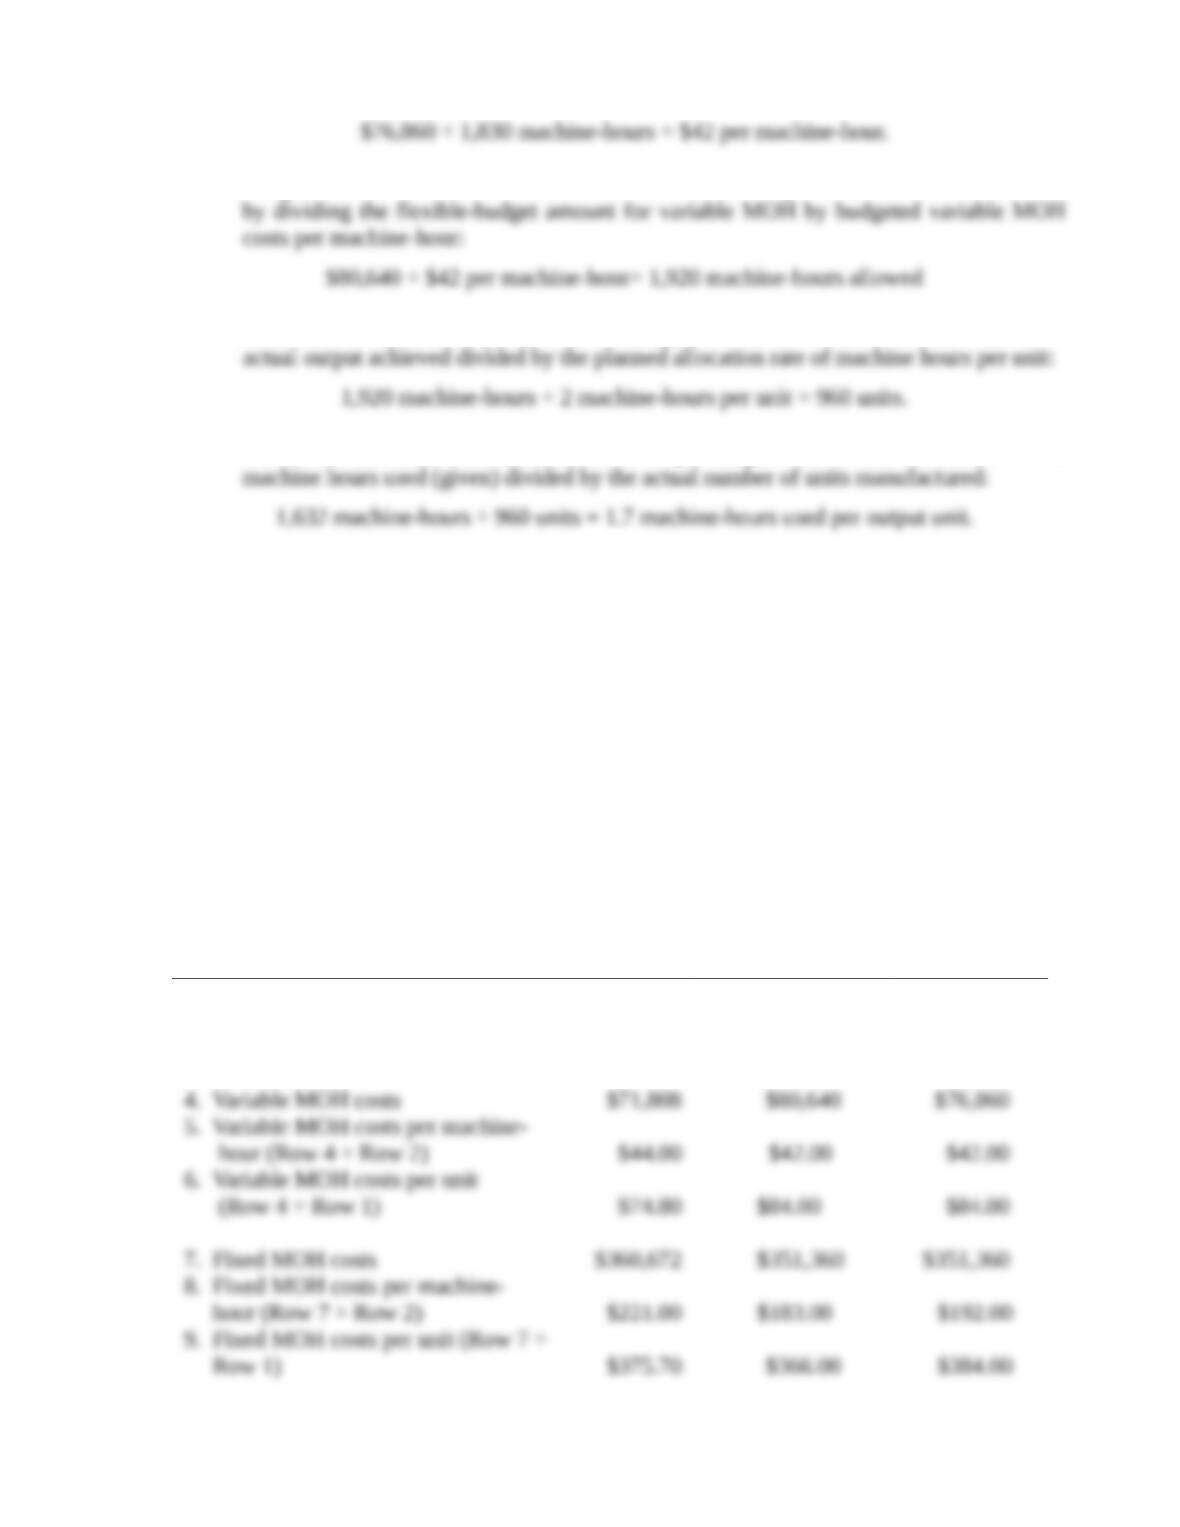
1. Budgeted number of machine-hours allowed for actual output achieved can be calculated
2. The actual number of output units is the budgeted number of machine-hours allowed for
3. The actual number of machine-hours used per output unit is the actual number of
8-36 Journal entries (continuation of 8-35).
Required:
1. Prepare journal entries for variable and fixed manufacturing overhead (you will need to
calculate the various variances to accomplish this).
2. Overhead variances are written off to the Cost of Goods Sold (COGS) account at the end of
the fiscal year. Show how COGS is adjusted through journal entries.
SOLUTION
(60 min.) Journal entries (continuation of 8-35).
1. Key information underlying the computation of variances is:
Actual
Results
Flexible-Budget
Amount
Static-Budget
Amount
1. Output units (food processors) 960 960 915
2. Machine-hours 1,632 1,920 1,830
3. Machine-hours per output unit 1.70 2.00 2.00
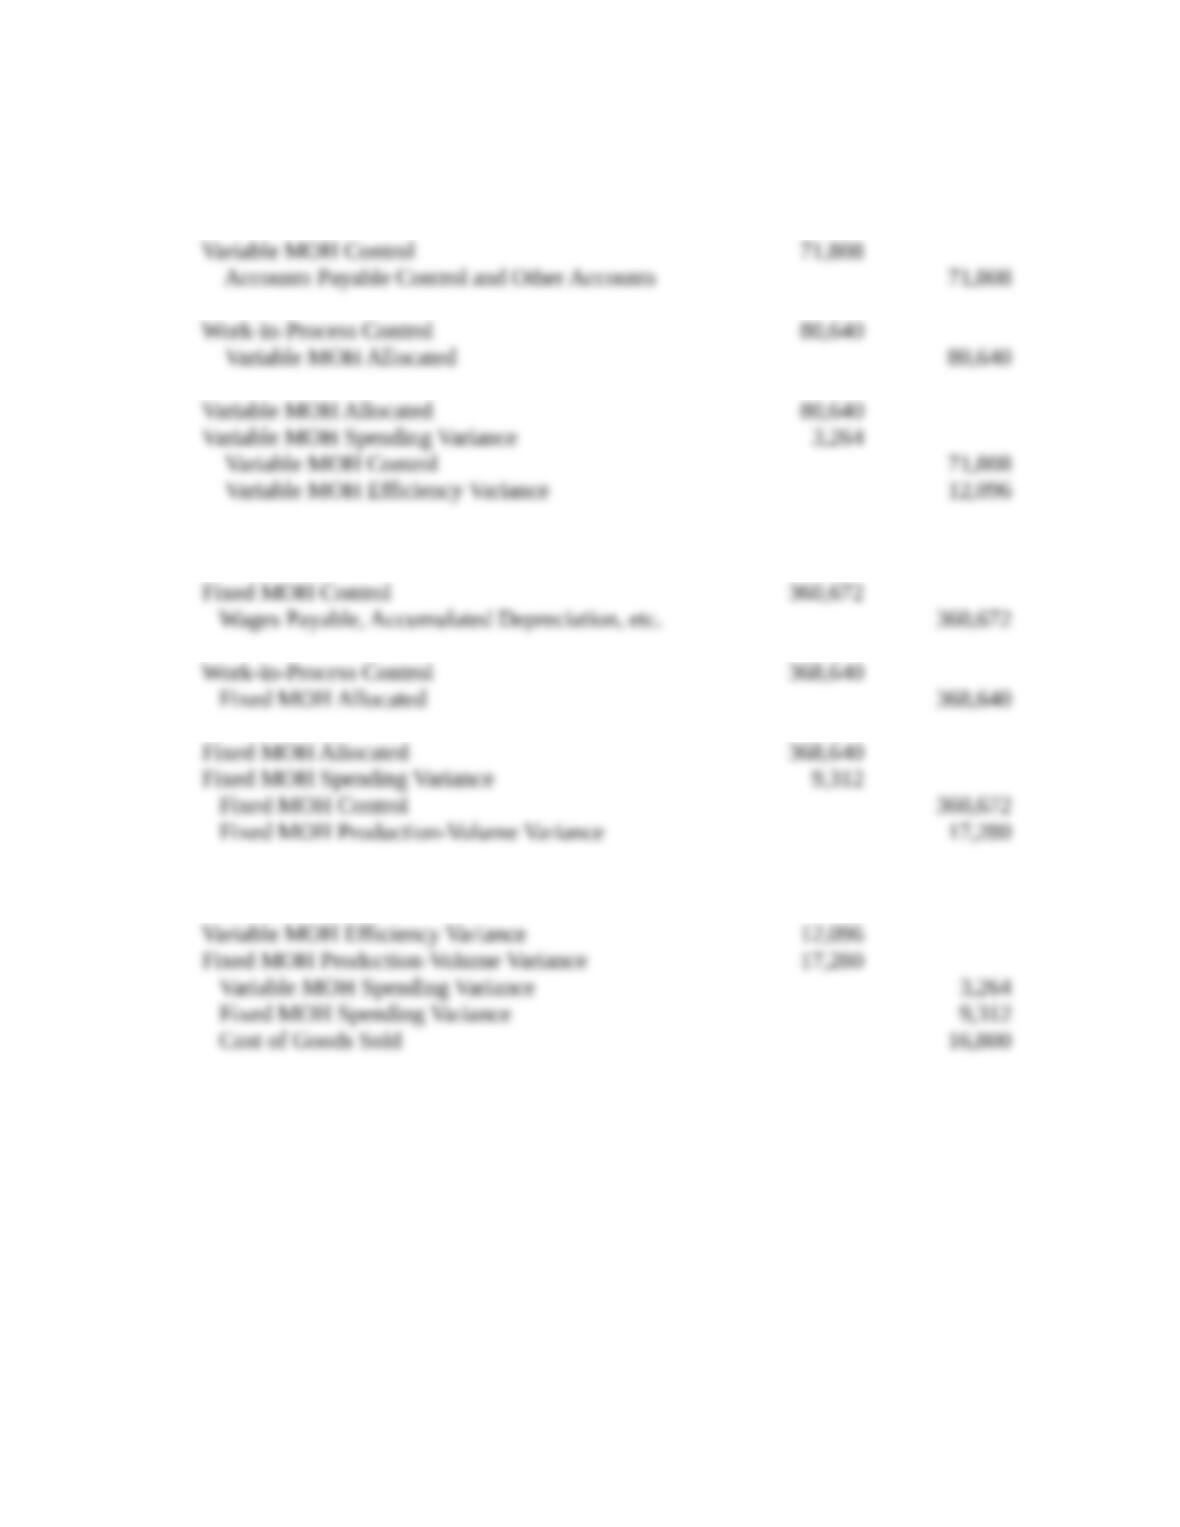
Solution Exhibit 8-36 shows the computation of the variances.
Journal entries for variable MOH, year ended December 31, 2017:
Journal entries for fixed MOH, year ended December 31, 2017:
2. Adjustment of COGS