SOLUTION
(20 min.) Activity-based costing, batch-level variance analysis
1. Static budget number of crates = Budgeted pairs shipped / Budgeted pairs per crate
2. Flexible budget number of crates = Actual pairs shipped / Budgeted pairs per crate
3. Actual number of crates shipped = Actual pairs shipped / Actual pairs per box
4. Static budget number of hours = Static budget number of crates × budgeted hours per box
Fixed overhead rate = Static budget fixed overhead / static budget number of hours
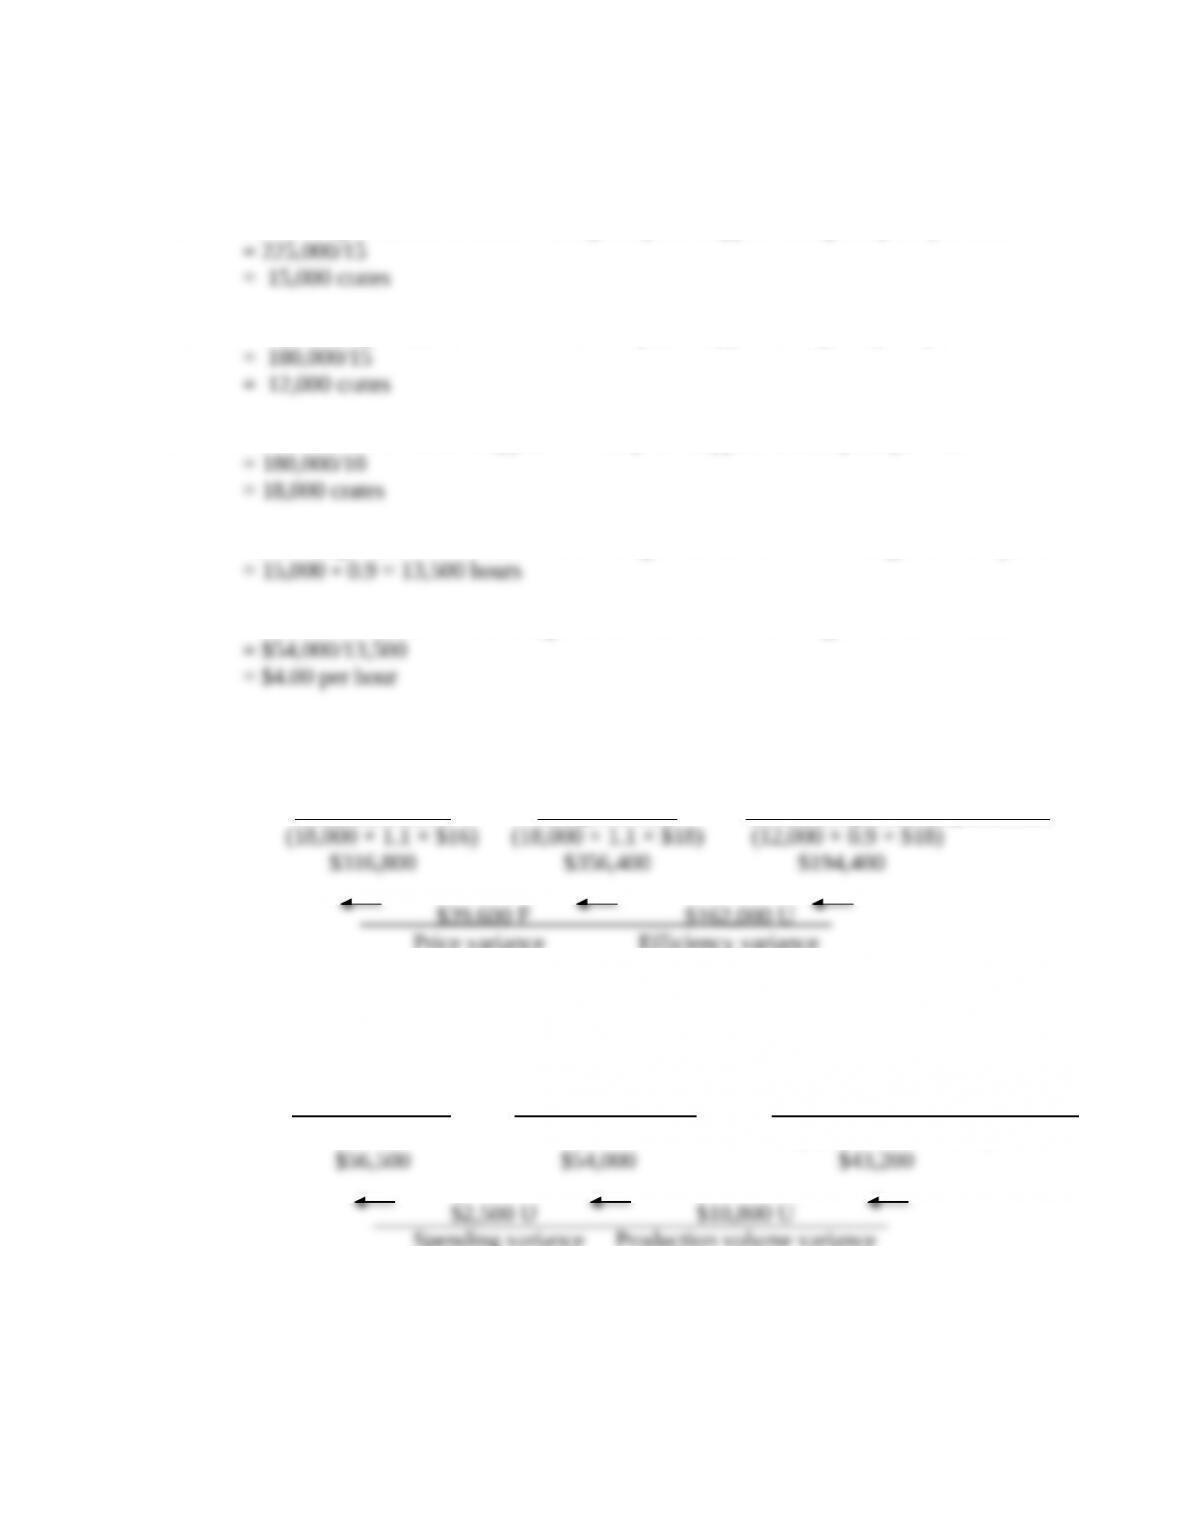
5. Variable Direct Variance Analysis for Audrina’s Fleet Feet, Inc. for 2017
Actual Actual hours Budgeted hours allowed for
Variable Cost x Budgeted rate Actual output x Budgeted rate
Price variance Efficiency variance
6. Fixed Overhead Variance Analysis for Audrina’s Fleet Feet, Inc. for 2017
Actual Static Budget Budgeted hours allowed for
Fixed Overhead Fixed Overhead Actual output × Budgeted Rate
(12,000 × 0.9 × $4.0)
Spending variance Production volume variance
8-41 Overhead variances and sales-volume variance. The Roller Bag Company manufactures
extremely light and rolling suitcases. It was one of the first companies to produce rolling
suitcases and sales have increased for the past several years. In 2017, Roller Bag budgeted to sell
150,000 suitcases for $80 each.
The budgeted standard machine hours for production in 2017 were 375,000 machine hours.
Budgeted fixed overhead costs are $525,000, and variable overhead cost was budgeted at $1.75
per machine-hour.
In 2017, Roller Bag experienced a drop in sales due to increased competition for rolling
suitcases. Roller Bag used 310,000 machine-hours to produce the 120,000 suitcases it sold in
2017. Actual variable overhead costs were $488,000 and actual fixed overhead costs were
$532,400. The average selling price of the suitcases sold in 2017 was $72.
Actual direct materials and direct labor costs were the same as standard costs, which were
$20 per unit and $18 per unit, respectively.
Required:
1. Calculate the variable overhead and fixed overhead variances (spending, efficiency,
spending, and volume).
2. Create a chart like that in Exhibit 7-2 showing Flexible Budget Variances and Sales-Volume
Variances for revenues, costs, contribution margin, and operating income.
3. Calculate the operating income based on budgeted profit per suitcase.
4. Reconcile the budgeted operating income from requirement 3 to the actual operating income
from your chart in requirement 2.
5. Calculate the operating income volume variance and show how the sales-volume variance is
composed of the production-volume variance and the operating income volume variance.
SOLUTION
(30 – 40 minutes) Overhead variances and sales volume variance
1. Variable overhead variances:
Actual Actual Hours Standard Hours
Variable Overhead × Budgeted Rate × Standard Rate
(310,000 × $1.75) (120,000 × 2.5 × $1.75)
$488,000 $542,500 $525,000
Spending variance Efficiency variance
Fixed overhead variances:
Actual Static Budget Standard Hours
Fixed Overhead Fixed Overhead × Budgeted Rate
(120,000 × 2.5 × $1.40*)
Spending variance Production-volume variance
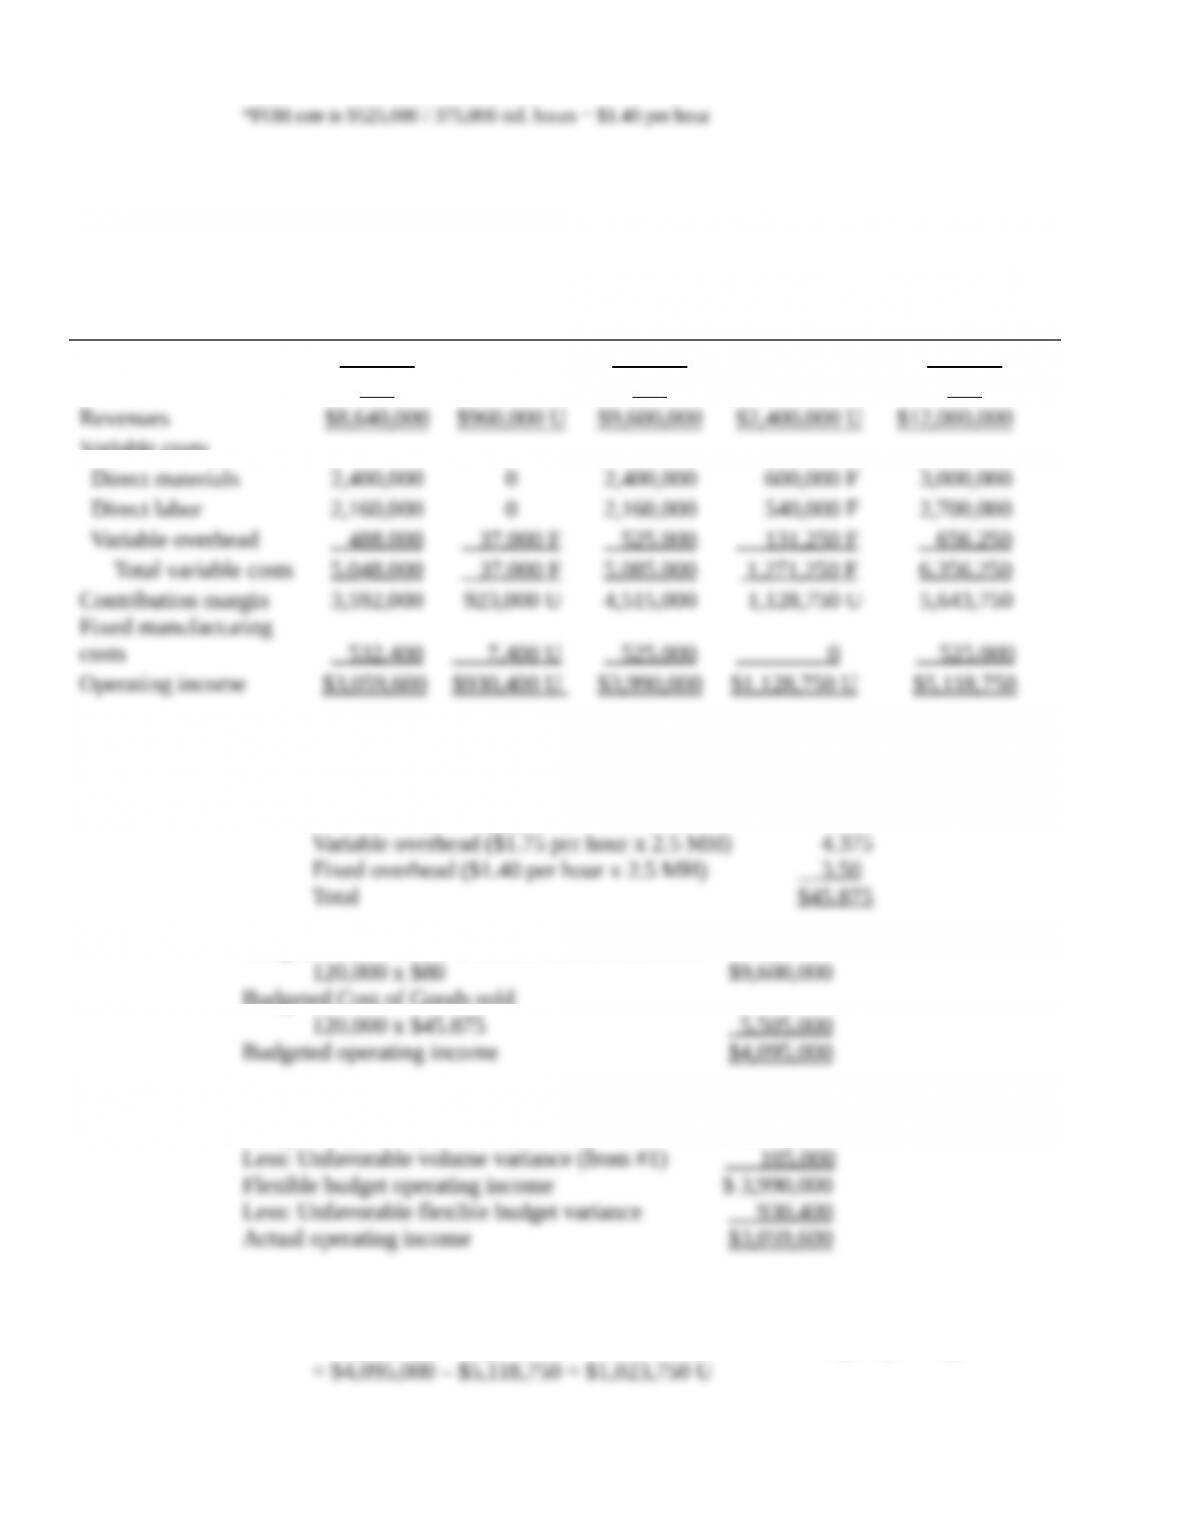
2.
Actual
Results
(1)
Flexible-Bu
dget
Variances
(2) = (1) –
(3)
Flexible
Budget
(3)
Sales-Volum
e
Variances
(4) = (3) –
(5)
Static
Budget
(5)
Units sold 120,000 120,000 150,000
Unit price $72 $80 $80
Variable costs
3. Budgeted cost per rolling suitcase:
Direct materials per bag (given) $20.00
Direct labor per bag (given) 18.00
Budgeted sales revenue, 120,000 actual units sold
Budgeted Cost of Goods sold
4. Budgeted operating income (from #3) $4,095,000
5. Operating income volume variance:
Budgeted operating income for actual output – static budget operating income
Sales volume variance
8-42 Activity-based costing, batch-level variance analysis. The Saluki Company specializes in
making fraternity and sorority T-shirts for the college market. Due to the high setup costs for
each batch printed, Saluki holds the T-shirt requests until demand is approximately 100 shirts. At
that point Saluki will schedule the setup and production of the shirts. For rush orders, Saluki will
produce smaller batches for an additional charge of $175 per setup.
Budgeted and actual costs for the production process for 2017 were as follows:
Static-Budget
Amounts
Actual
Results
Number of shirts produced 125,000 114,000
Average number of shirts
per setup
100 95
Hours to set up machines 5 5.20
Direct variable cost per
setup-hour
$ 30 $ 32
Total fixed setup overhead
costs
$56,250 $56,000
Required:
1. What is the static budget number of setups for 2017?
2. What is the flexible-budget number of setups for 2017?
3. What is the actual number of setups in 2017?
4. Assuming fixed setup overhead costs are allocated using setup-hours, what is the
predetermined fixed setup overhead allocation rate?
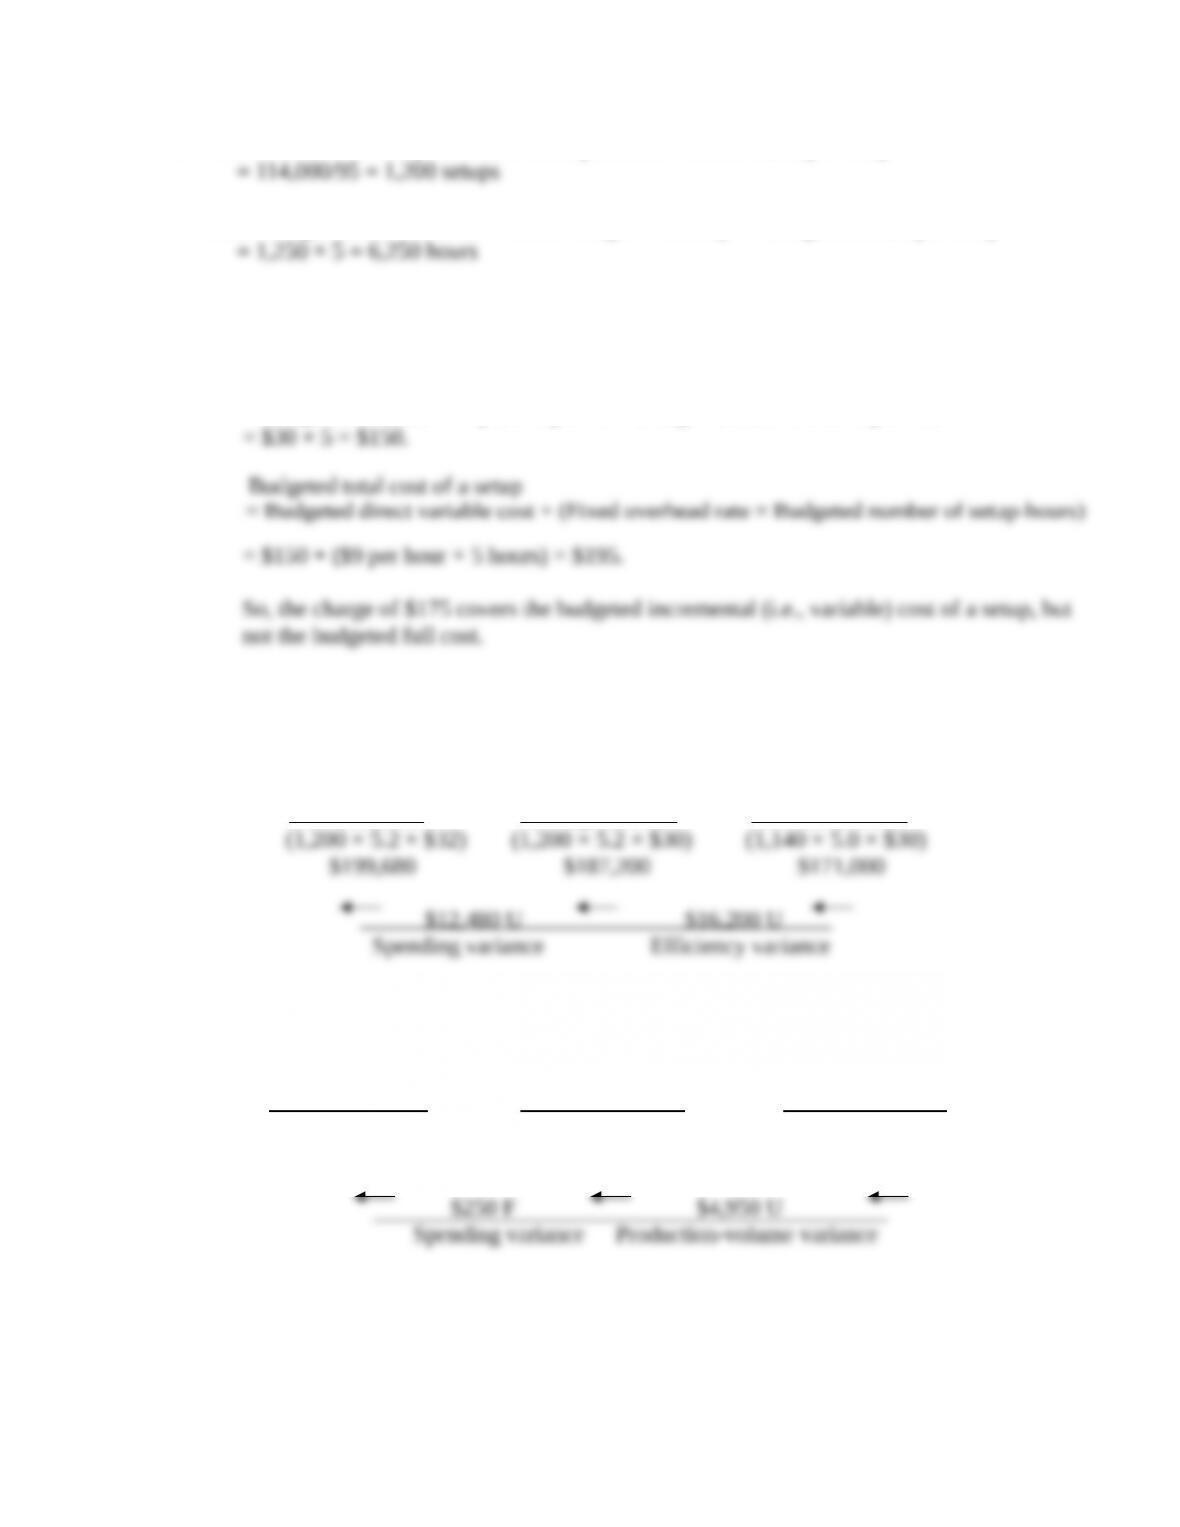
5. Does Saluki’s charge of $175 cover the budgeted direct variable cost of an order? The budgeted
total cost?
6. For direct variable setup costs, compute the price and efficiency variances.
7. For fixed setup overhead costs, compute the spending and the production-volume variances.
8. What qualitative factors should Saluki consider before accepting or rejecting a special order?
SOLUTION
(30 min.) Activity-based costing, batch-level variance analysis
1. Static budget number of setups = Budgeted shirts produced/ Budgeted shirts per setup
2. Flexible budget number of setups = Actual shirts produced / Budgeted shirts per setup
3. Actual number of setups = Actual shirts produced / Actual shirts per setup
4. Static budget number of hours = Static budget # of setups × Budgeted hours per setup
Fixed overhead rate = Static budget fixed overhead / Static budget number of hours
= $56,250/6,250 = $9 per hour
5. Budgeted direct variable cost of a setup
= Budgeted variable cost per setup-hour × Budgeted number of setup-hours
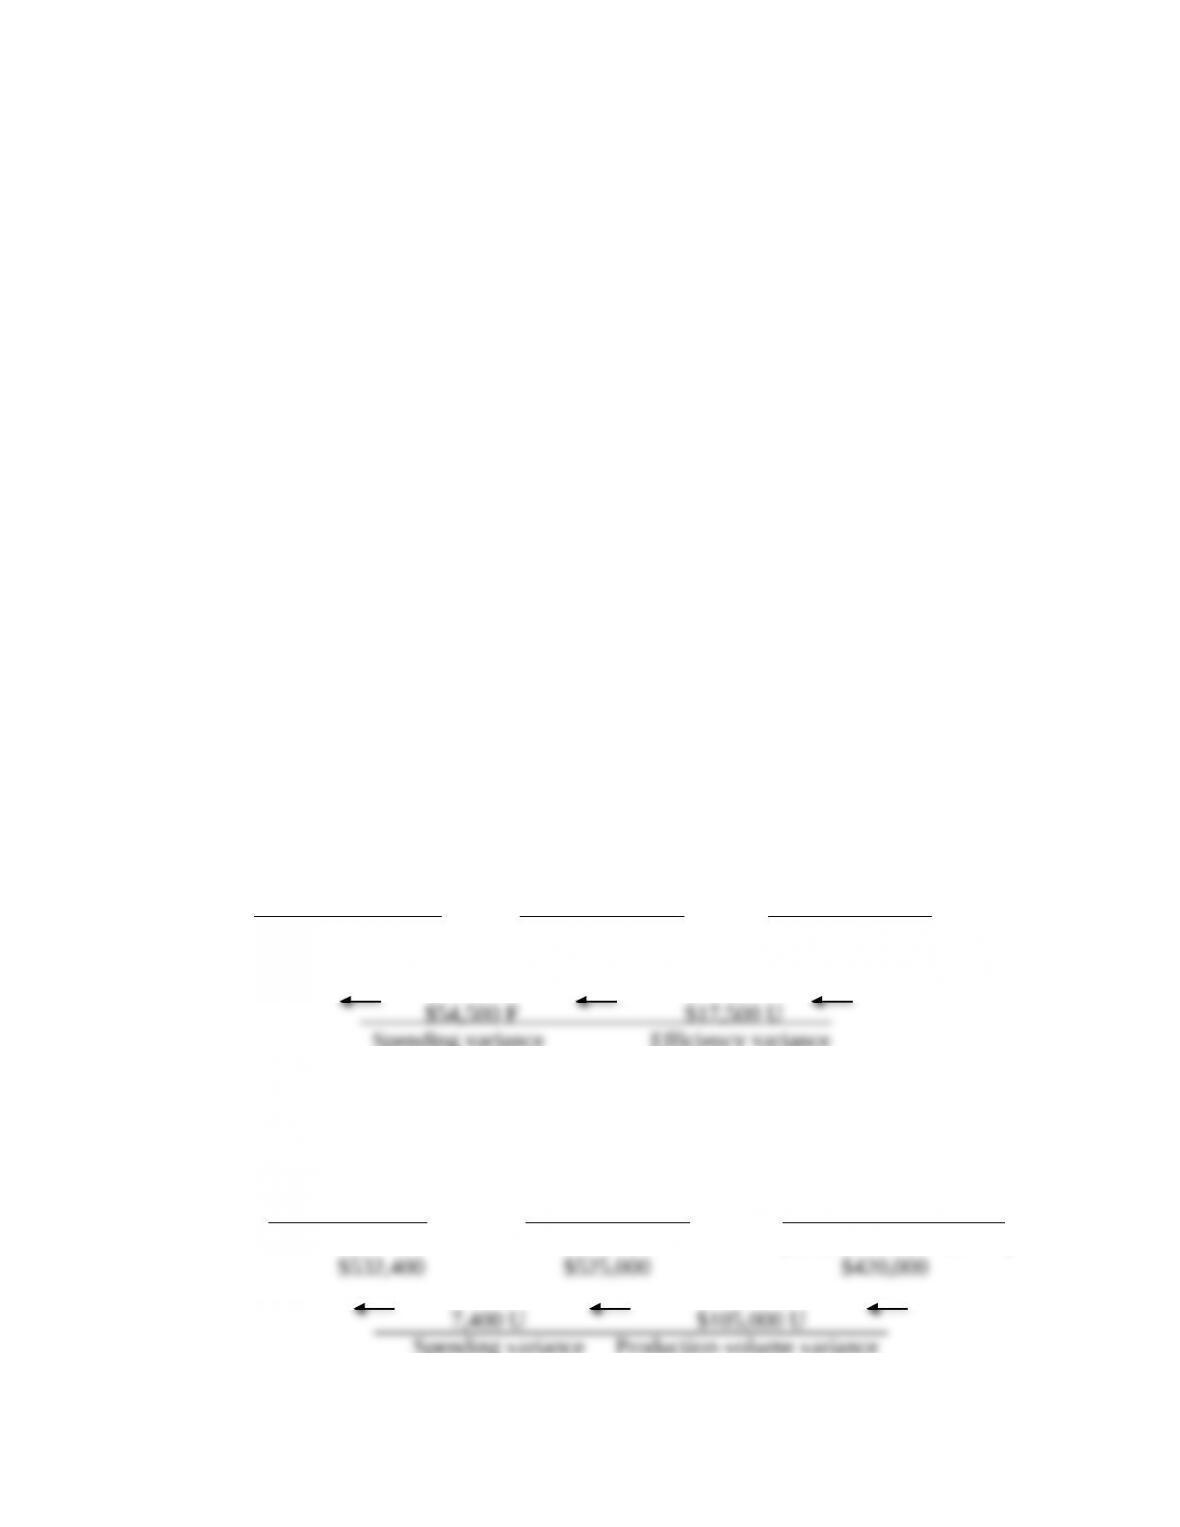
6. Direct Variable Variance Analysis for Saluki Company for 2017
Actual Actual hours Standard hours
Variable Cost x Budgeted rate x Standard rate
7. Fixed Setup Overhead Variance Analysis for Saluki Company for 2017
Actual Static Budget Standard hours
Fixed Overhead Fixed Overhead x Budgeted Rate
(1,140 × 5.0 × $9)
$56,000 $56,250 $51,300
8. Rejecting an order may have implications for future orders (i.e., groups might be
reluctant to order shirts from this supplier again). Saluki should consider factors such as
prior history with the customer and potential future sales.

8-43 Comprehensive review of Chapters 7 and 8, working backward from given variances.
The Gallo Company uses a flexible budget and standard costs to aid planning and control of its
machining manufacturing operations. Its costing system for manufacturing has two direct-cost
categories (direct materials and direct manufacturing labor—both variable) and two
overhead-cost categories (variable manufacturing overhead and fixed manufacturing overhead,
both allocated using direct manufacturing labor-hours).
At the 50,000 budgeted direct manufacturing labor-hour level for August, budgeted direct
manufacturing labor is $1,250,000, budgeted variable manufacturing overhead is $500,000, and
budgeted fixed manufacturing overhead is $1,000,000.
The following actual results are for August:
Direct materials price variance (based on
purchases)
$179,300 F
Direct materials efficiency variance 75,900 U
Direct manufacturing labor costs incurred 535,500
Variable manufacturing overhead
flexible-budget variance
10,400 U
Variable manufacturing overhead efficiency
variance
18,100 U
Fixed manufacturing overhead incurred 957,550
The standard cost per pound of direct materials is $11.50. The standard allowance is 6 pounds of
direct materials for each unit of product. During August, 20,000 units of product were produced.
There was no beginning inventory of direct materials. There was no beginning or ending work in
process. In August, the direct materials price variance was $1.10 per pound.
In July, labor unrest caused a major slowdown in the pace of production, resulting in an
unfavorable direct manufacturing labor efficiency variance of $40,000. There was no direct
manufacturing labor price variance. Labor unrest persisted into August. Some workers quit. Their
replacements had to be hired at higher wage rates, which had to be extended to all workers. The
actual average wage rate in August exceeded the standard average wage rate by $0.50 per hour.
Required:
1. Compute the following for August:
a. Total pounds of direct materials purchased
b. Total number of pounds of excess direct materials used
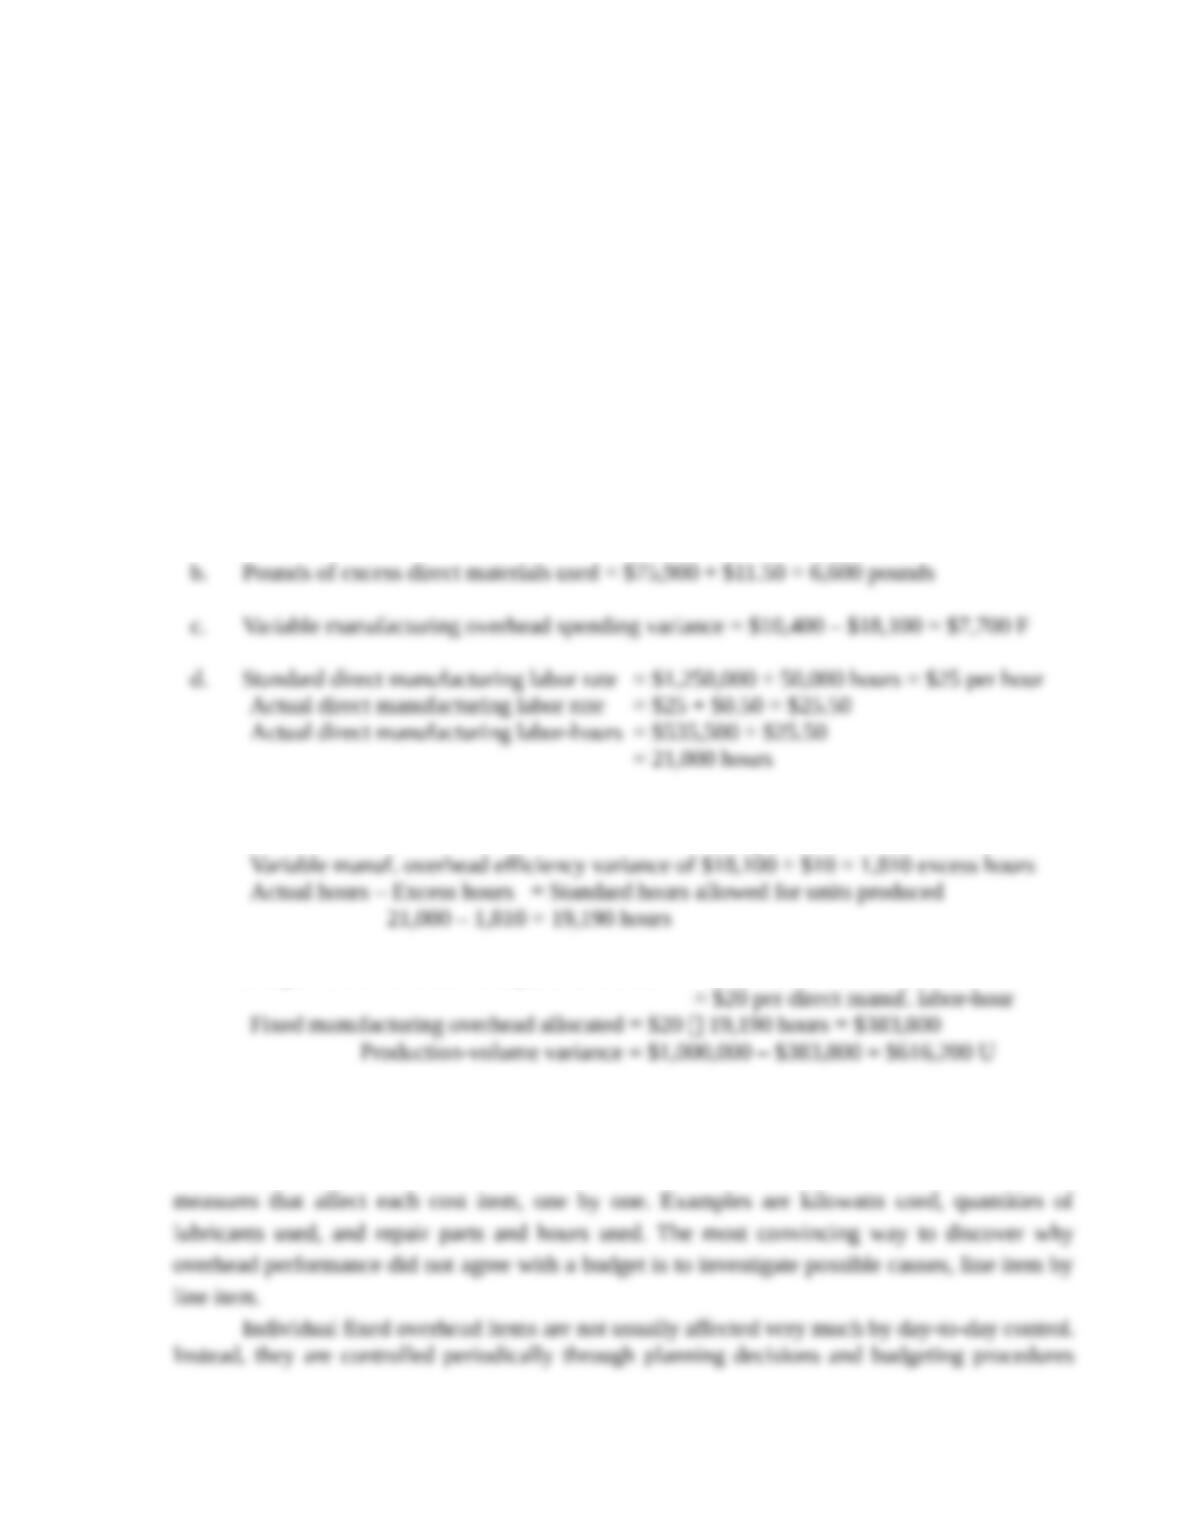
c. Variable manufacturing overhead spending variance
d. Total number of actual direct manufacturing labor-hours used
e. Total number of standard direct manufacturing labor-hours allowed for the units produced
f. Production-volume variance
2. Describe how Gallo’s control of variable manufacturing overhead items differs from its
control of fixed manufacturing overhead items.
SOLUTION
(3040 min.) Comprehensive review of Chapters 7 and 8, working backward from given
variances.
1. Solution Exhibit 8-43 outlines the Chapter 7 and 8 framework underlying this solution.
a. Pounds of direct materials purchased = $179,300 ÷ $1.10 = 163,000 pounds
e. Standard variable manufacturing overhead rate = $500,000 ÷ 50,000
= $10 per direct manuf. labor-hour
f. Budgeted fixed manufacturing overhead rate = $1,000,000 ÷ 50,000 hours
1. The control of variable manufacturing overhead requires the identification of the cost drivers
for such items as energy, supplies, and repairs. Control often entails monitoring nonfinancial
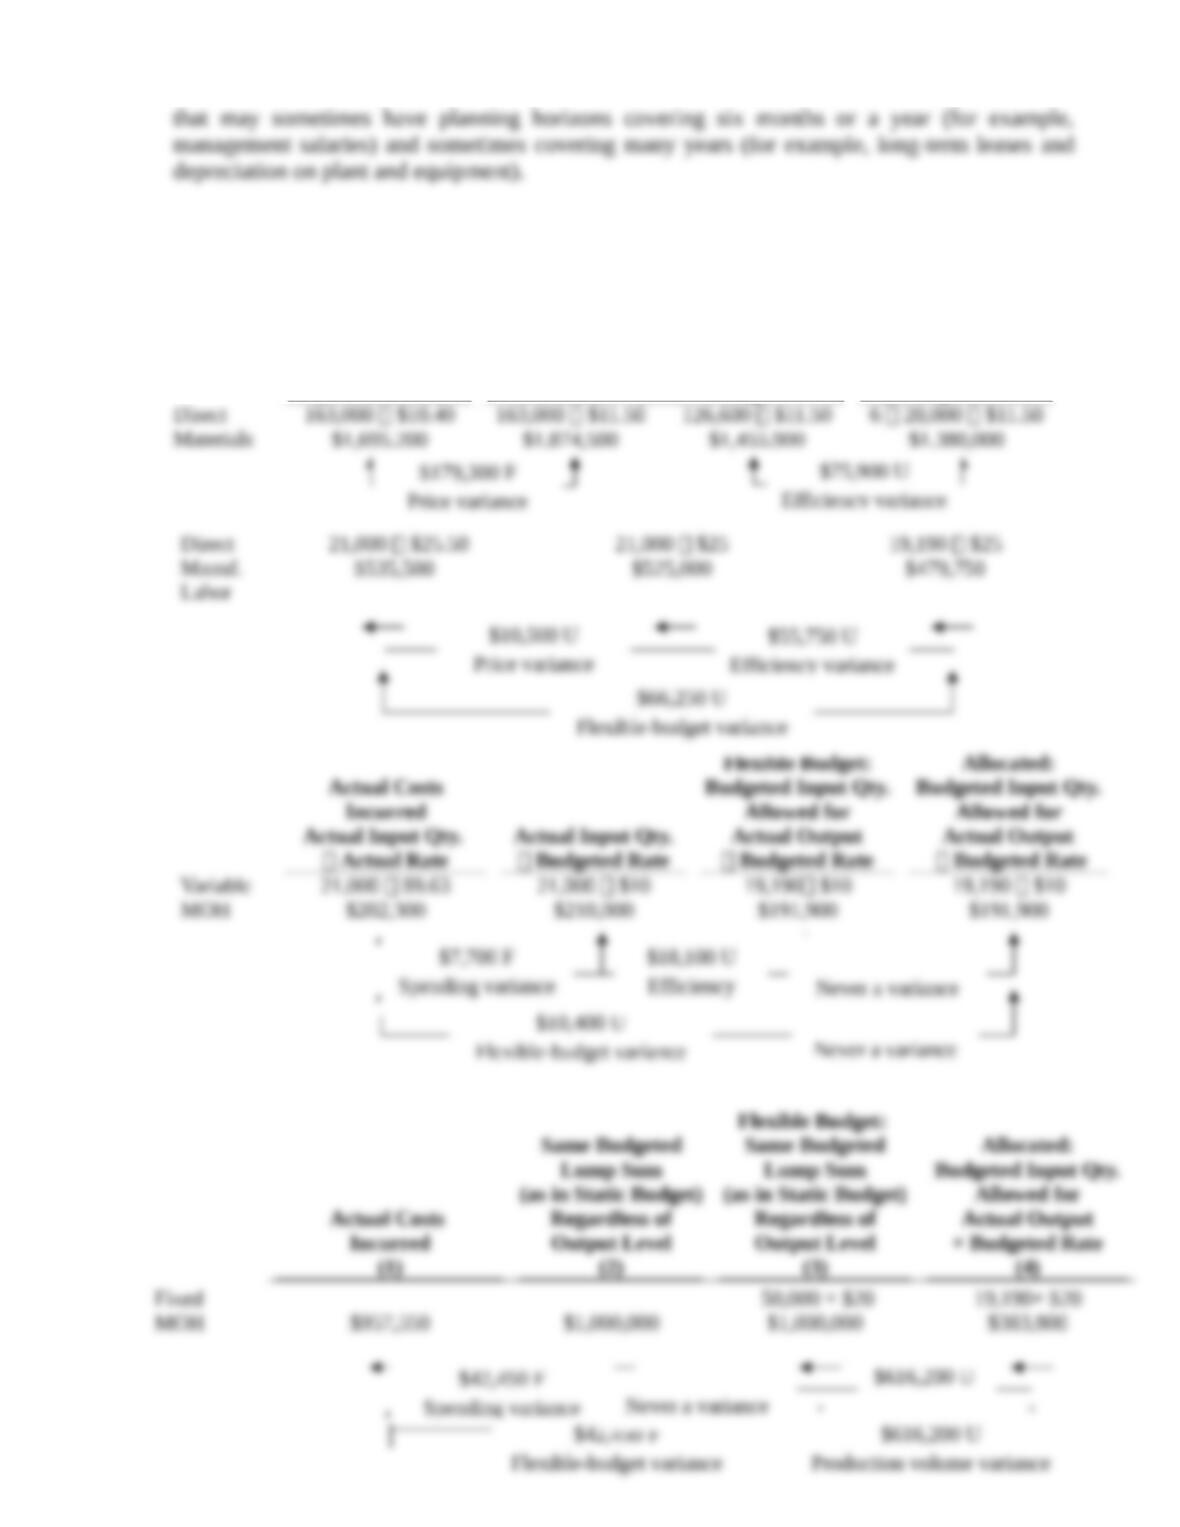
SOLUTION EXHIBIT 8-43
Actual Costs
Incurred
(Actual Input Qty.
Actual Rate)
Actual Input Qty.
Budgeted Rate
Purchases Usage
Flexible Budget:
Budgeted Input Qty.
Allowed for
Actual Output
Budgeted Rate
Labor
Actual Costs
Incurred
Actual Input Qty.
Actual Rate
Actual Input Qty.
Budgeted Rate
Flexible Budget:
Budgeted Input Qty.
Allowed for
Actual Output
Budgeted Rate
Allocated:
Budgeted Input Qty.
Allowed for
Actual Output
Budgeted Rate
Actual Costs
Incurred
(1)
Same Budgeted
Lump Sum
(as in Static Budget)
Regardless of
Output Level
(2)
Flexible Budget:
Same Budgeted
Lump Sum
(as in Static Budget)
Regardless of
Output Level
(3)
Allocated:
Budgeted Input Qty.
Allowed for
Actual Output
× Budgeted Rate
(4)
Fixed
50,000 × $20
19,190× $20
$179,300 F
Price variance
$75,900 U
Efficiency variance
$10,500 U
Price variance
$55,750 U
Efficiency variance
$66,250 U
Flexible-budget variance
Spending variance
Efficiency
variance
Never a variance
Flexible-budget variance Never a variance

8-44 Review of Chapters 7 and 8, 3-variance analysis. (CPA, adapted) The Beal
Manufacturing Company’s costing system has two direct-cost categories: direct materials and
direct manufacturing labor. Manufacturing overhead (both variable and fixed) is allocated to
products on the basis of standard direct manufacturing labor-hours (DLH). At the beginning of
2017, Beal adopted the following standards for its manufacturing costs:
Input Cost per Output
Unit
Direct materials 5 lb. at $4 per lb. $ 20.00
Direct manufacturing labor 4 hrs. at $16 per hr. 64.00
Manufacturing overhead:
Variable $8 per DLH 32.00
Fixed $9 per DLH 36.00
Standard manufacturing cost per
output unit
$152.00
The denominator level for total manufacturing overhead per month in 2017 is 37,000 direct
manufacturing labor-hours. Beal’s budget for January 2017 was based on this denominator level.
The records for January indicated the following:
Direct materials purchased 40,300 lb. at $3.80 per lb.
Direct materials used 37,300 lb.
Direct manufacturing labor 31,400 hrs. at $16.25 per hr.
Total actual manufacturing overhead (variable and
fixed)
$650,000
Actual production 7,600 output units
Required:
1. Prepare a schedule of total standard manufacturing costs for the 7,600 output units in January
2017.
2. For the month of January 2017, compute the following variances, indicating whether each is
favorable (F) or unfavorable (U):
a. Direct materials price variance, based on purchases
b. Direct materials efficiency variance
c. Direct manufacturing labor price variance
d. Direct manufacturing labor efficiency variance
e. Total manufacturing overhead spending variance
f. Variable manufacturing overhead efficiency variance
g. Production-volume variance