SOLUTION
(20 min.) Flow of Inventoriable Costs.
(All numbers below are in millions).
1.
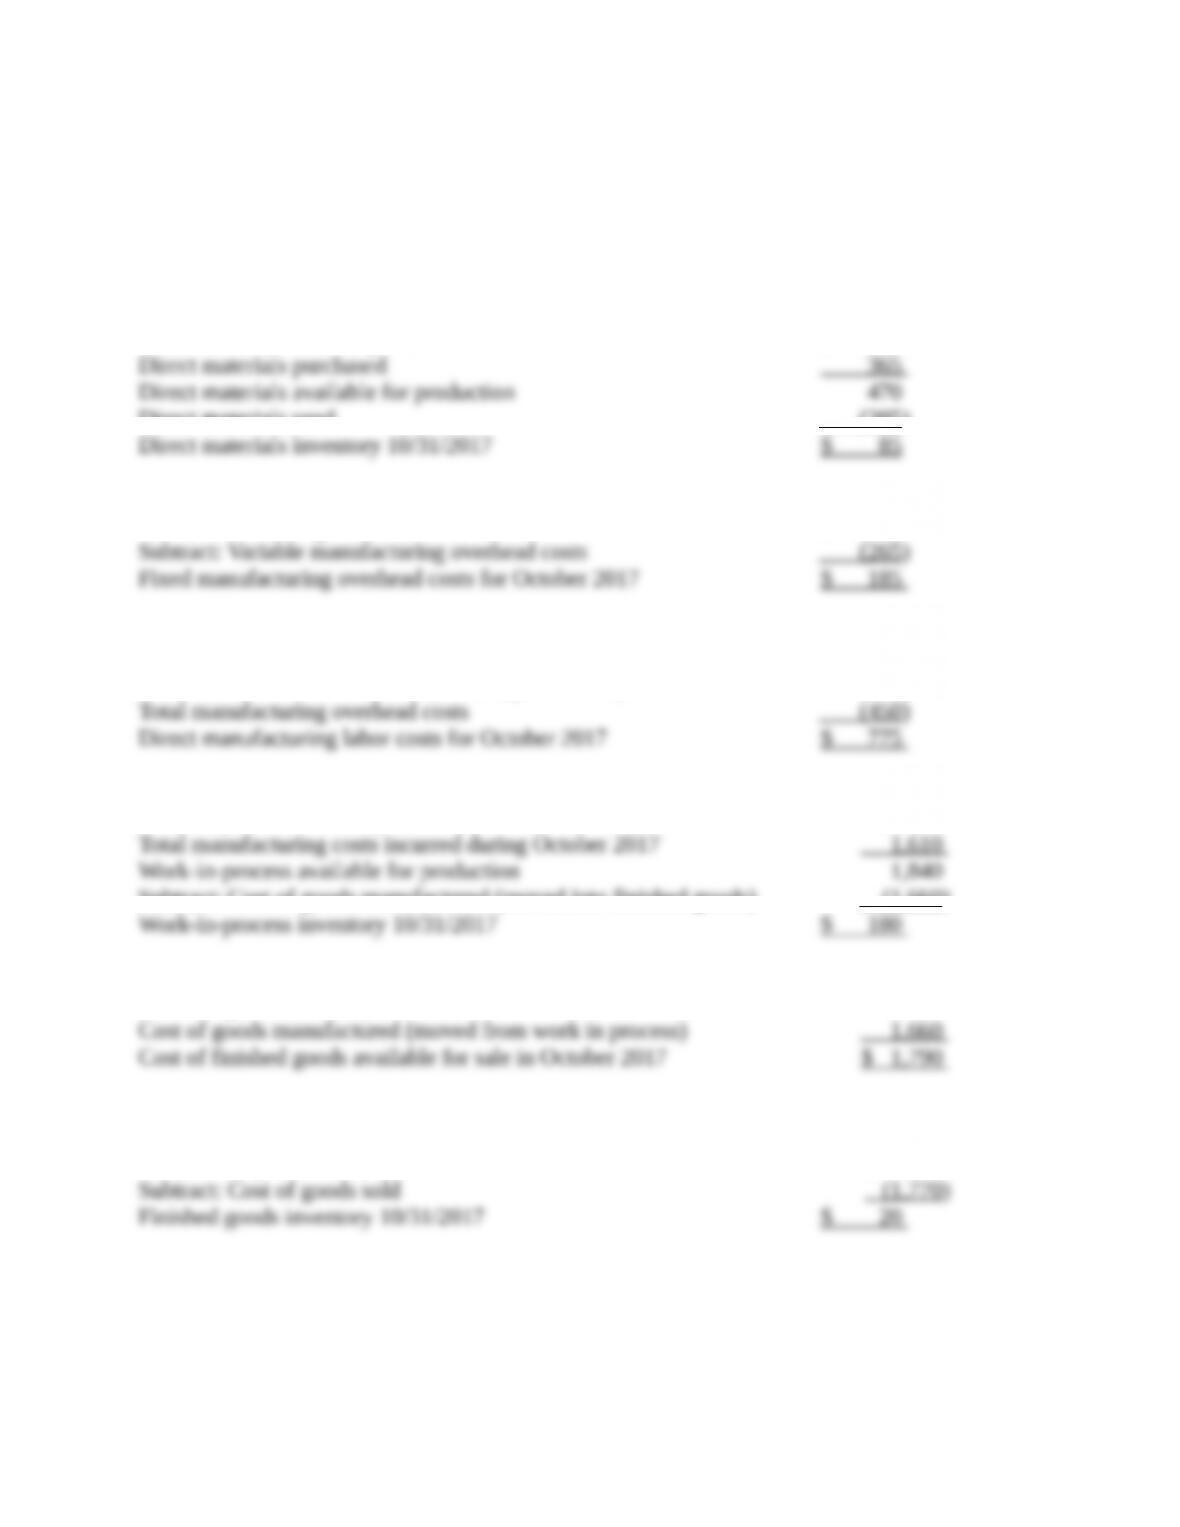
Direct materials inventory 10/1/2017 $ 105
Direct materials used (385)
2.
Total manufacturing overhead costs $ 450
3.
Total manufacturing costs incurred during October 2017 $ 1,610
Subtract: Direct materials used (from requirement 1) (385)
4.
Work-in-process inventory 10/1/2017 $ 230
Subtract: Cost of goods manufactured (moved into finished goods) (1 ,660)
5.
Finished goods inventory 10/1/2017 $ 130
6.
Cost of finished goods available for sale in October 2017
(from requirement 5) $ 1,790
2-37 Cost of goods manufactured, income statement, manufacturing company. Consider the
following account balances (in thousands) for the Peterson Company:
2-1
Peterson Company
Beginning of
2017
End of
2017
Direct materials inventory 21,000 23,000
Work-in-process inventory 26,000 25,000
Finished-goods inventory 13,000 20,000
Purchases of direct materials 74,000
Direct manufacturing labor 22,000
Indirect manufacturing labor 17,000
Plant insurance 7,000
Depreciation—plant, building, and
equipment
11,000
Repairs and maintenance—plant 3,000
Marketing, distribution, and
customer-service costs
91,000
General and administrative costs 24,000
Required:
1. Prepare a schedule for the cost of goods manufactured for 2017.
2. Revenues for 2017 were $310 million. Prepare the income statement for 2017.
SOLUTION
(30–40 min.) Cost of goods manufactured, income statement, manufacturing company.
1. Peterson Company
Schedule of Cost of Goods Manufactured
Year Ended December 31, 2017
(in thousands)
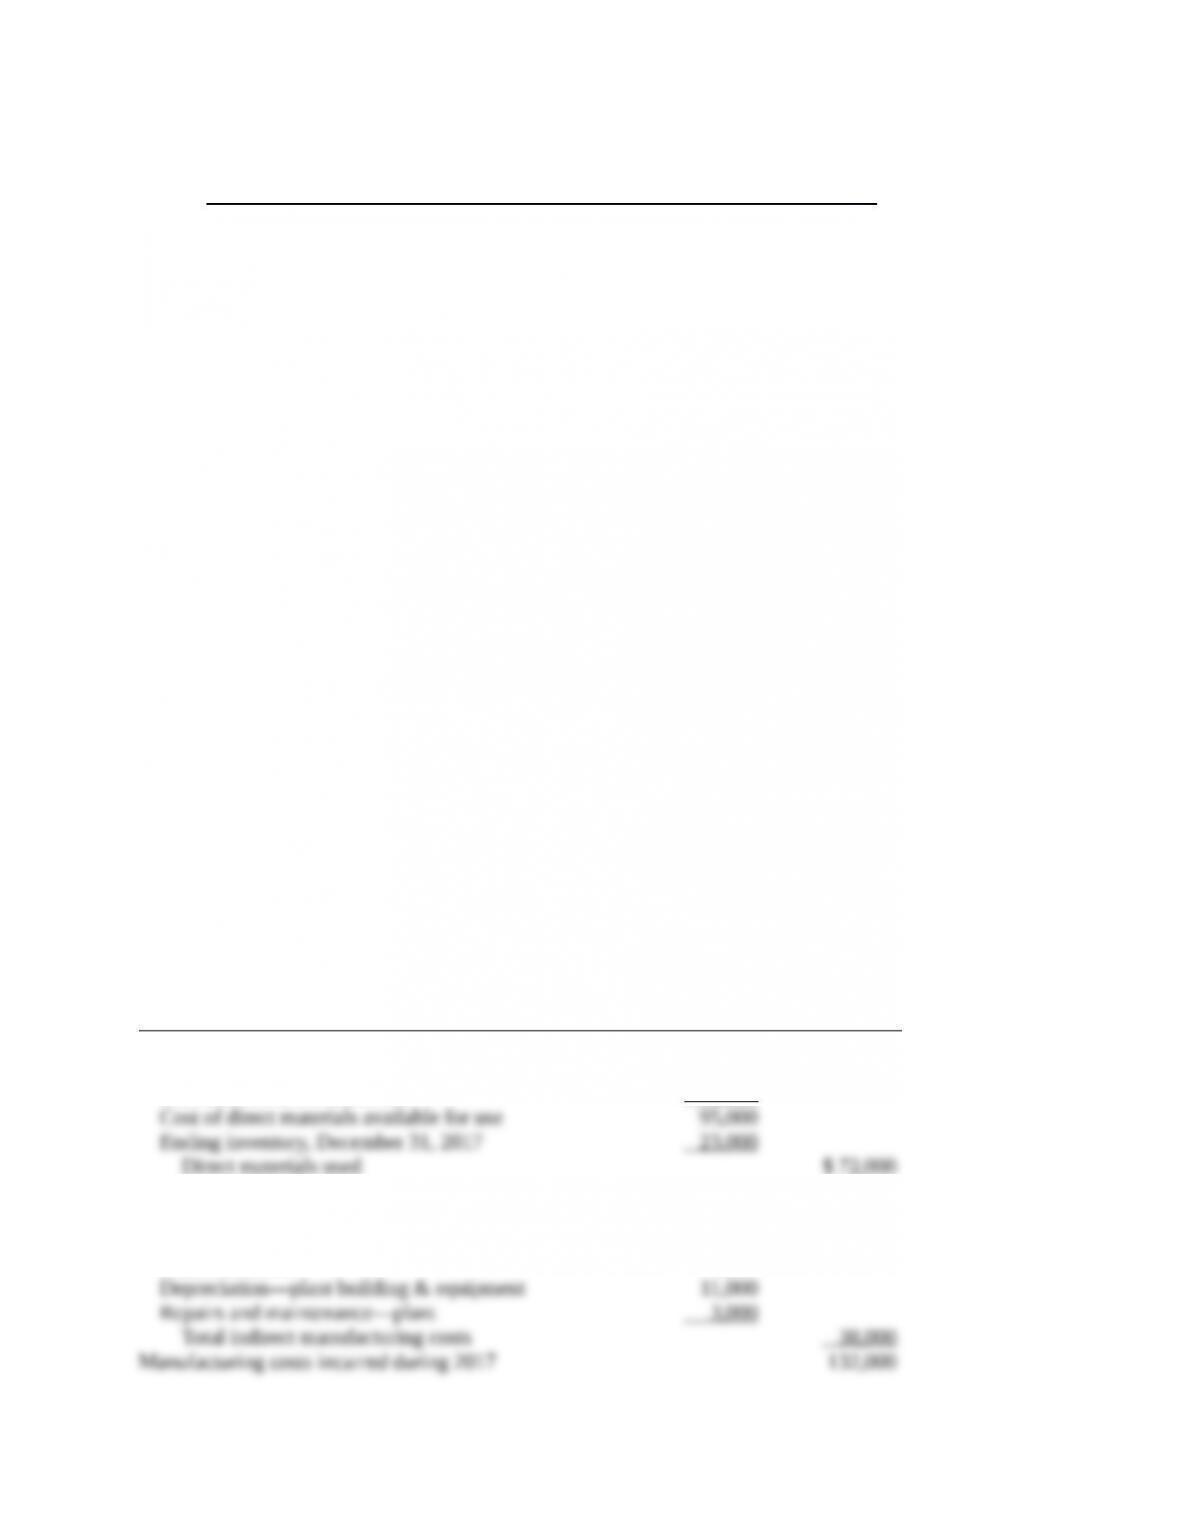
Direct materials cost
Beginning inventory, January 1, 2017 $ 21,000
Purchases of direct materials 74,000
Direct materials used $ 72,000
Direct manufacturing labor costs 22,000
Indirect manufacturing costs
Indirect manufacturing labor 17,000
Plant insurance 7,000
2-2
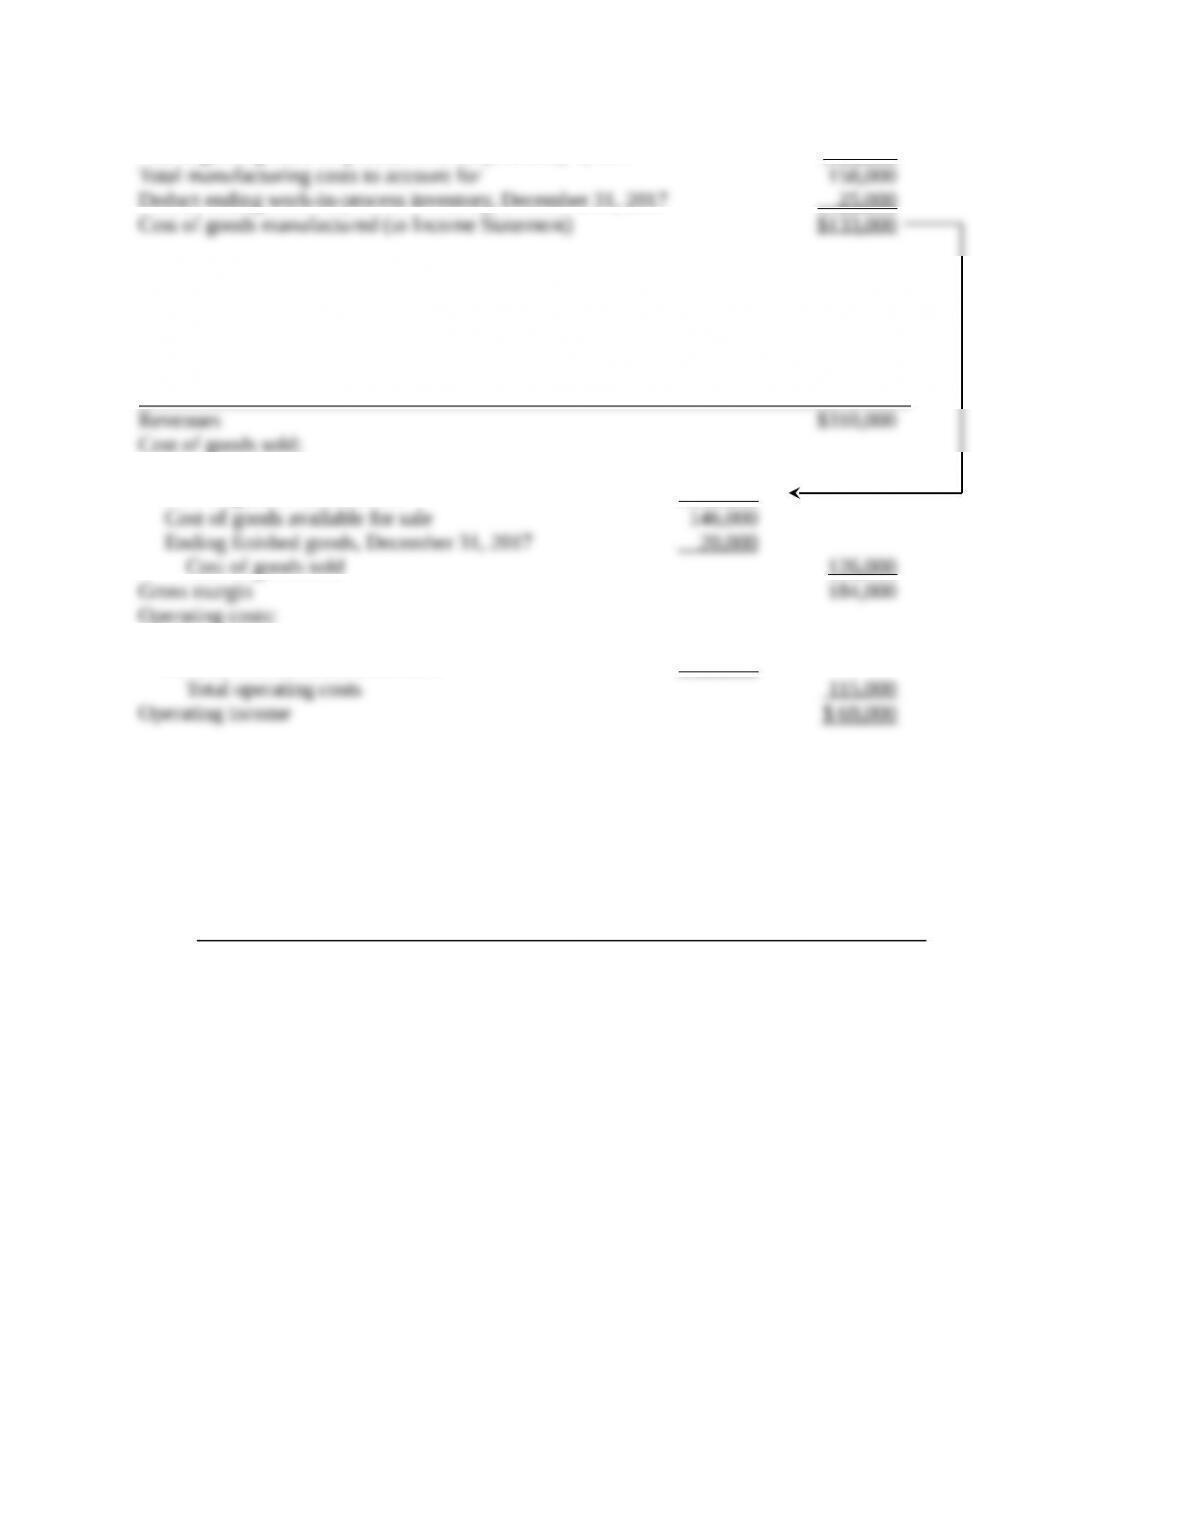
Add beginning work-in-process inventory, January 1, 2017 26,000
Deduct ending work-in-process inventory, December 31, 2017 25,000
2. Peterson Company
Income Statement
Year Ended December 31, 2017
(in thousands)
Cost of goods sold:
Beginning finished goods, January 1, 2017 $ 13,000
Cost of goods manufactured 133,000
Cost of goods sold 126,000
Operating costs:
Marketing, distribution, and customer-service costs 91,000
General and administrative costs 24,000
2-38 Cost of goods manufactured, income statement, manufacturing company. Consider the
following account balances (in thousands) for the Carolina Corporation:
Carolina Corporation
Beginning of
2017
End of
2017
Direct materials inventory 124,000 73,000
Work-in-process inventory 173,000 145,000
Finished-goods inventory 240,000 206,000
Purchases of direct materials 262,000
Direct manufacturing labor 217,000
Indirect manufacturing labor 97,000
Plant insurance 9,000
Depreciation—plant, building, and
equipment
45,000
Plant utilities 26,000
Repairs and maintenance—plant 12,000
Equipment leasing costs 65,000
2-3
Carolina Corporation
Beginning of
2017
End of
2017
Marketing, distribution, and
customer-service costs
125,000
General and administrative costs 71,000
Required:
1. Prepare a schedule for the cost of goods manufactured for 2017.
2. Revenues (in thousands) for 2017 were $1,300,000. Prepare the income statement for 2017.
SOLUTION
(30–40 min.) Cost of goods manufactured, income statement, manufacturing
company.
Carolina Corporation
Schedule of Cost of Goods Manufactured
Year Ended December 31, 2017
(in thousands)
Direct materials costs
Beginning inventory, January 1, 2017 $124,000
Purchases of direct materials 262,000
Direct materials used $313,000
Direct manufacturing labor costs 217,000
Indirect manufacturing costs
Plant insurance 9,000
Depreciation—plant building & equipment 45,000
Plant utilities 26,000
Repairs and maintenance—plant 12,000
Add beginning work-in-process inventory, January 1, 2017 173,000
Carolina Corporation
Income Statement
2-4
Year Ended December 31, 2017
(in thousands)
Revenues $1,300,000
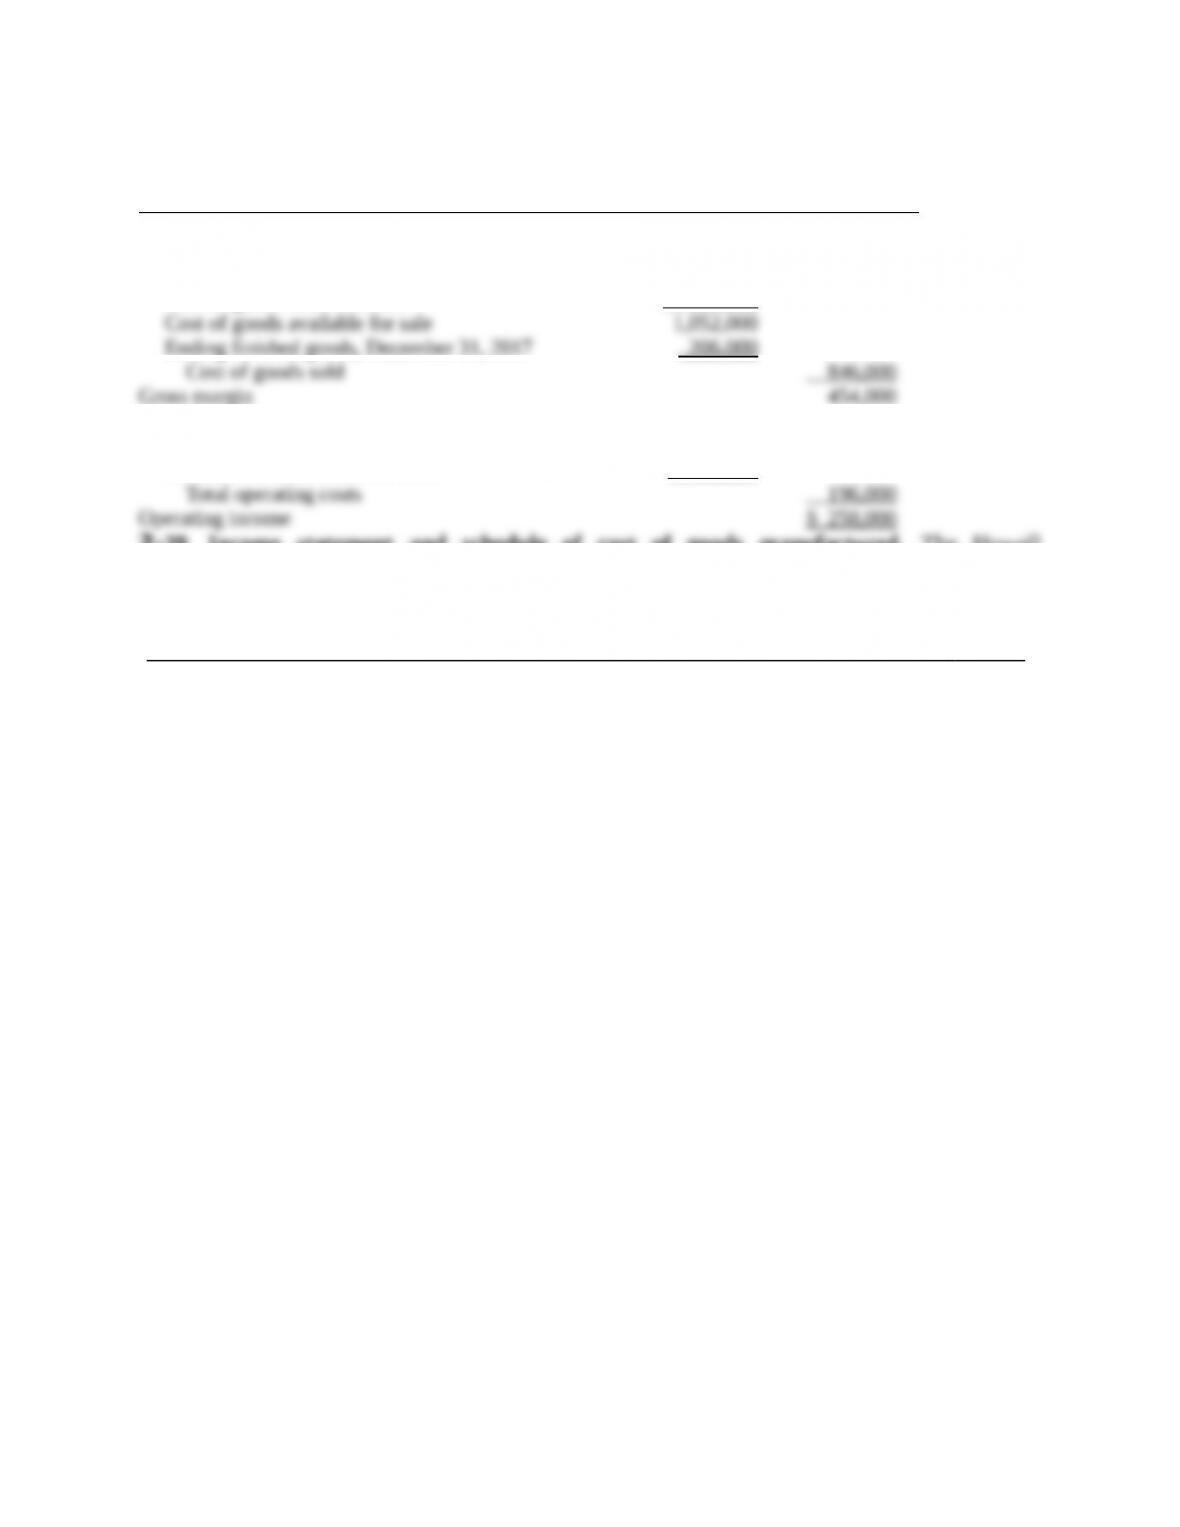
Cost of goods sold:
Beginning finished goods, January 1, 2017 $ 240,000
Cost of goods manufactured 812,000
Ending finished goods, December 31, 2017 206,000
Gross margin 454,000
Operating costs:
Marketing, distribution, and customer-service costs 125,000
General and administrative costs 71,000
2-39 Income statement and schedule of cost of goods manufactured. The Howell
Corporation has the following account balances (in millions):
For Specific Date For Year 2017
Direct materials inventory, Jan. 1, 2017 $1
5
Purchases of direct materials $325
Work-in-process inventory, Jan. 1, 2017 10 Direct manufacturing labor 100
Finished goods inventory, Jan. 1, 2017 70 Depreciation—plant and
equipment 80
Direct materials inventory, Dec. 31, 2017 20 Plant supervisory salaries 5
Work-in-process inventory, Dec. 31, 2017 5 Miscellaneous plant
overhead 35
Finished goods inventory, Dec. 31, 2017 55 Revenues 950
Marketing, distribution, and
customer-service costs 240
Plant supplies used 10
Plant utilities 30
Indirect manufacturing labor 60
Required:
Prepare an income statement and a supporting schedule of cost of goods manufactured for the
year ended December 31, 2017. (For additional questions regarding these facts, see the next
problem.)
SOLUTION
2-5
(25–30 min.) Income statement and schedule of cost of goods manufactured.
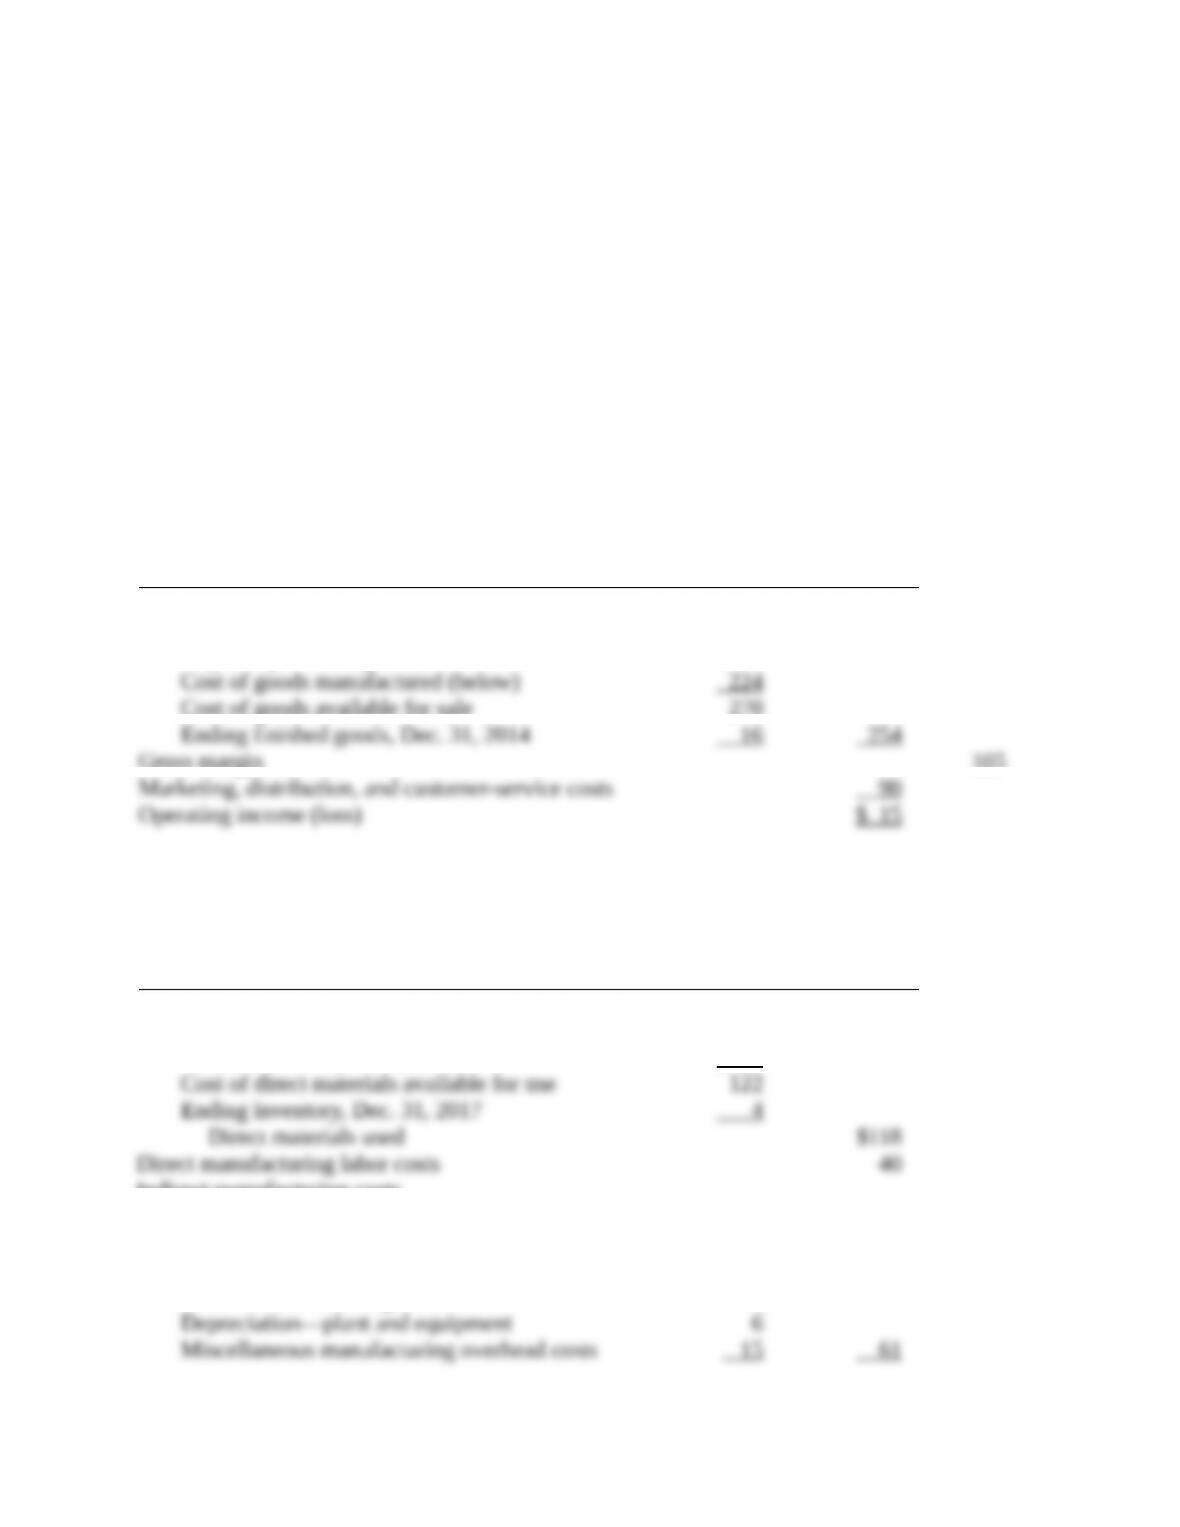
Howell Corporation
Income Statement for the Year Ended December 31, 2017
(in millions)
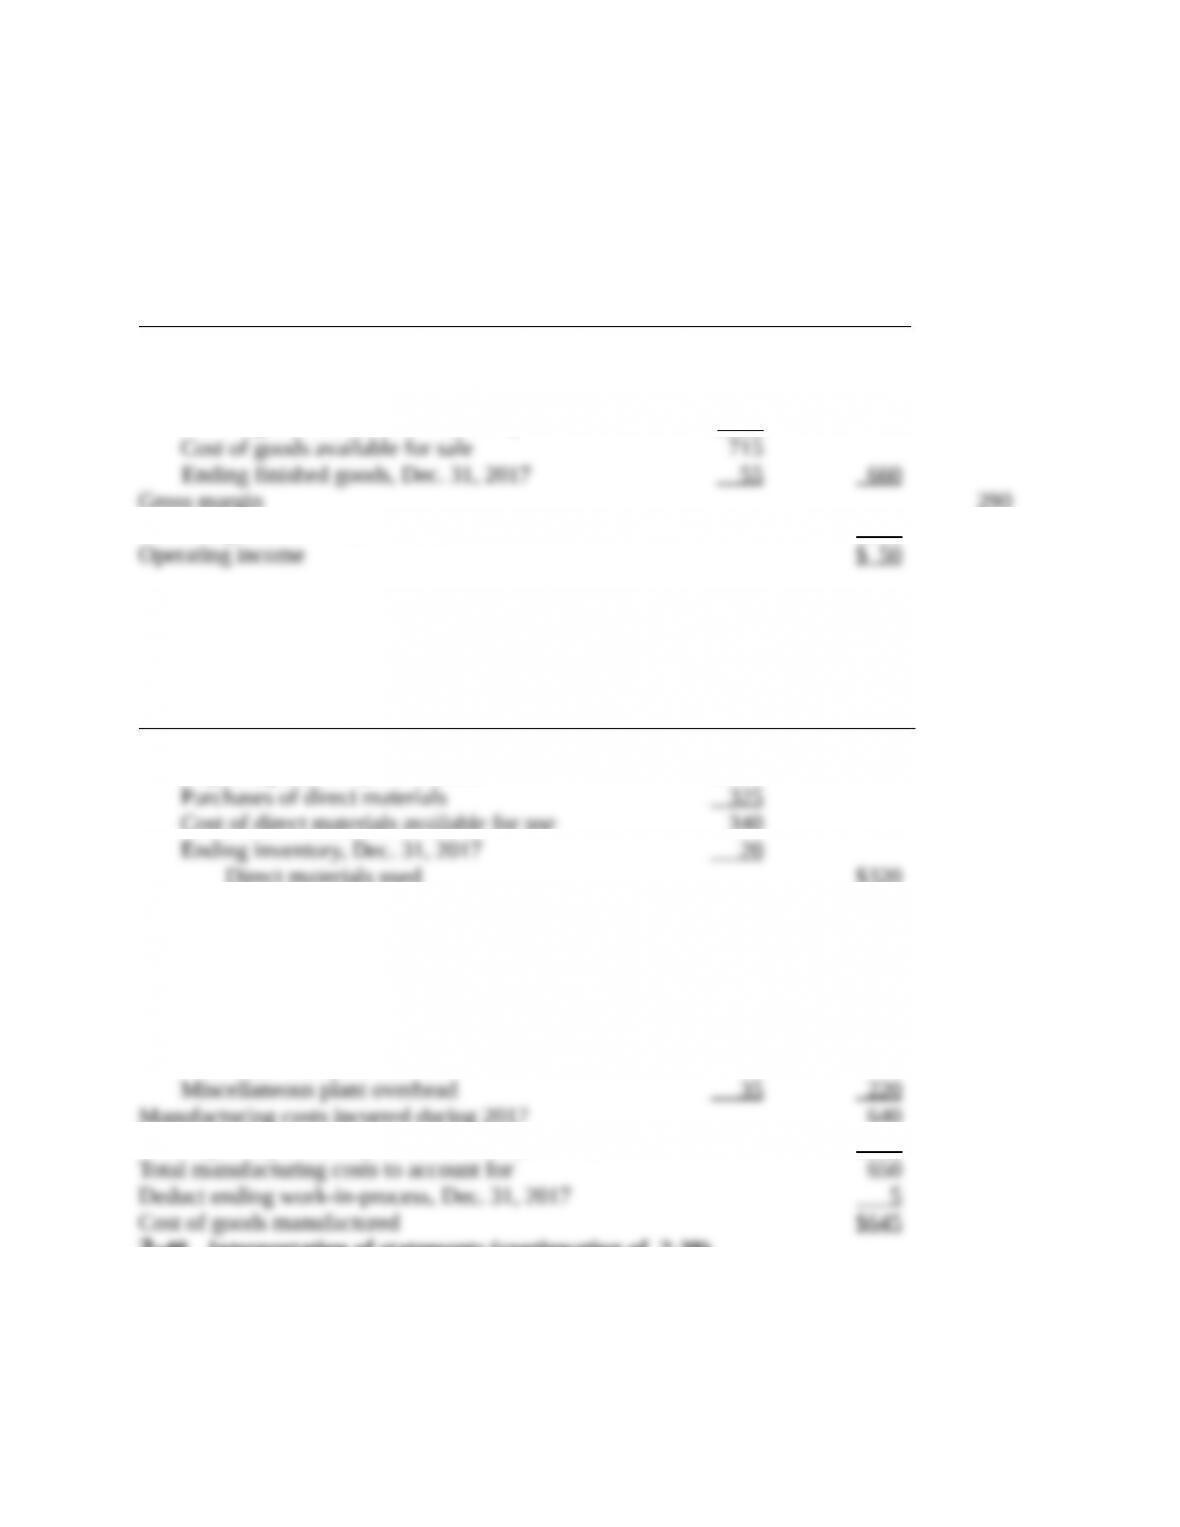
Revenues $950
Cost of goods sold
Beginning finished goods, Jan. 1, 2017 $ 70
Cost of goods manufactured (below) 645
Gross margin 290
Marketing, distribution, and customer-service costs 240
Howell Corporation
Schedule of Cost of Goods Manufactured
for the Year Ended December 31, 2017
(in millions)
Direct materials costs
Beginning inventory, Jan. 1, 2017 $ 15
Cost of direct materials available for use 340
Direct materials used $320
Direct manufacturing labor costs 100
Indirect manufacturing costs
Indirect manufacturing labor 60
Plant supplies used 10
Plant utilities 30
Depreciation––plant and equipment 80
Plant supervisory salaries 5
Manufacturing costs incurred during 2017 640
Add beginning work-in-process inventory, Jan. 1, 2017 10
2-40 Interpretation of statements (continuation of 2-39).
Required:
1. How would the answer to Problem 2-39 be modified if you were asked for a schedule of cost
of goods manufactured and sold instead of a schedule of cost of goods manufactured? Be
2-6
specific.
2. Would the sales manager’s salary (included in marketing, distribution, and customer-service
costs) be accounted for any differently if the Howell Corporation were a
merchandising-sector company instead of a manufacturing-sector company?
3. Using the flow of manufacturing costs outlined in Exhibit 2-9 (page 44), describe how the
wages of an assembler in the plant would be accounted for in this manufacturing company.
4. Plant supervisory salaries are usually regarded as manufacturing overhead costs. When might
some of these costs be regarded as direct manufacturing costs? Give an example.
5. Suppose that both the direct materials used and the plant and equipment depreciation are
related to the manufacture of 1 million units of product. What is the unit cost for the direct
materials assigned to those units? What is the unit cost for plant and equipment depreciation?
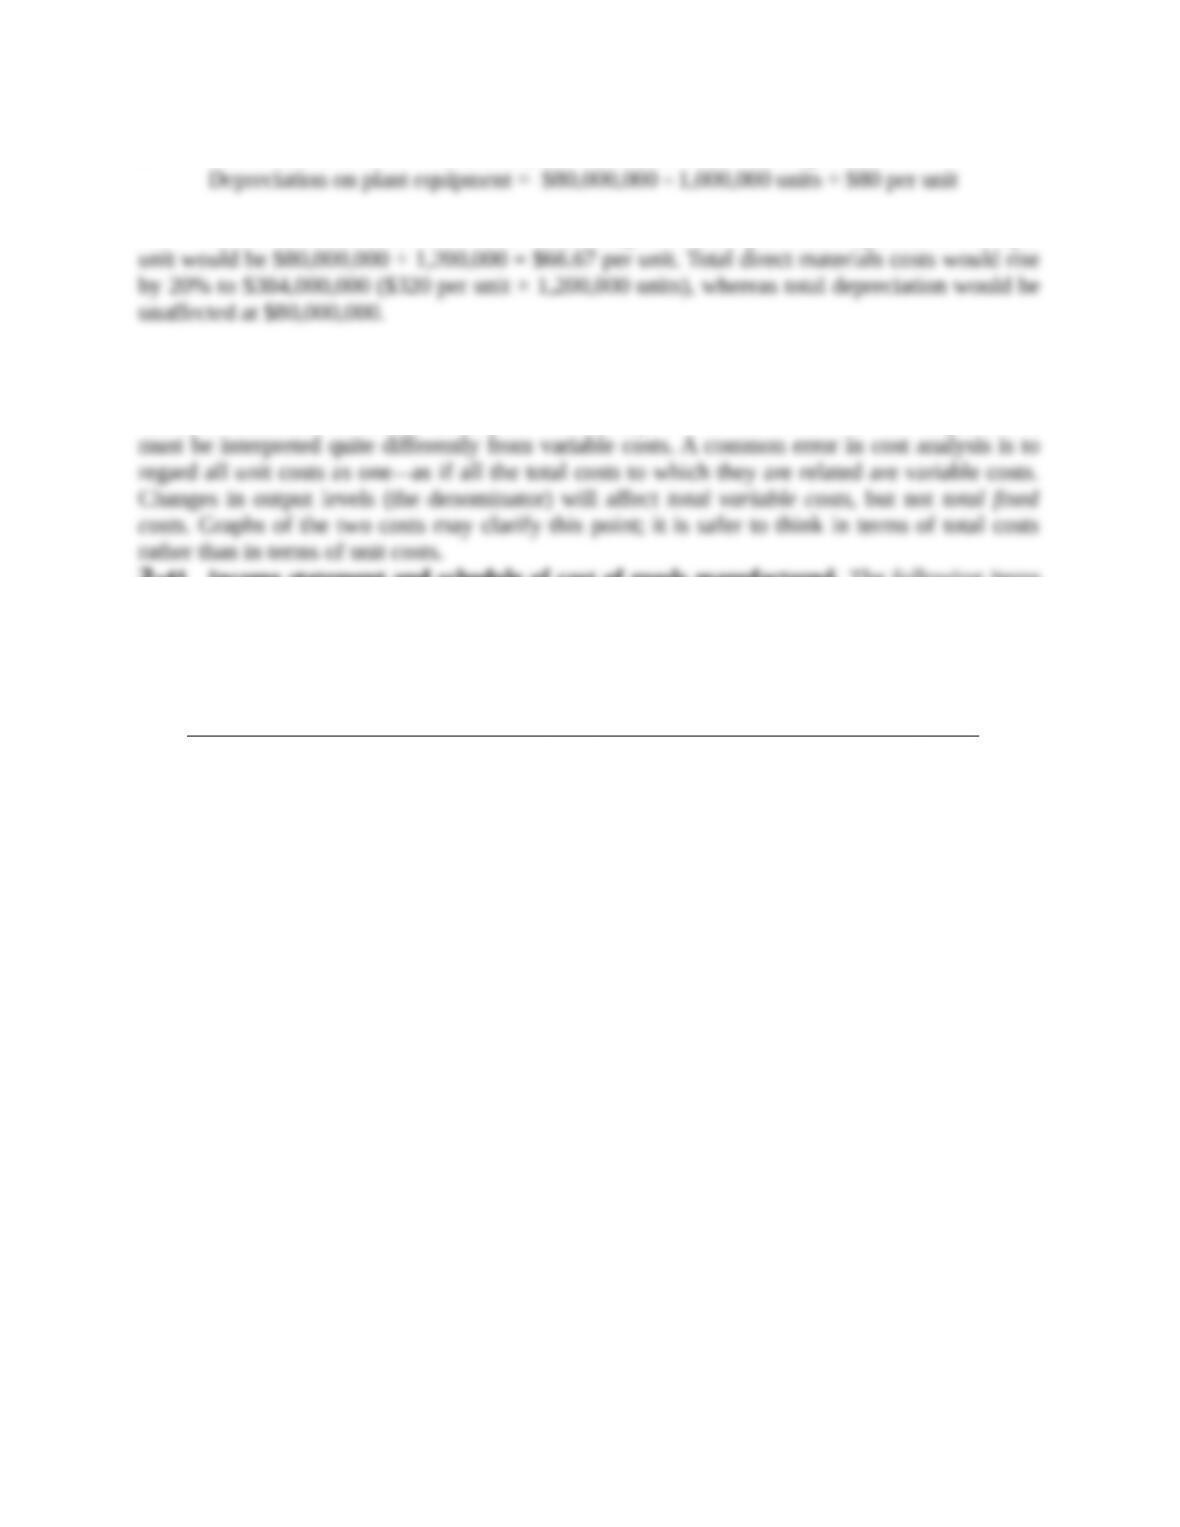
Assume that yearly plant and equipment depreciation is computed on a straight-line basis.
6. Assume that the implied cost-behavior patterns in requirement 5 persist. That is, direct
material costs behave as a variable cost and plant and equipment depreciation behaves as a
fixed cost. Repeat the computations in requirement 5, assuming that the costs are being
predicted for the manufacture of 1.2 million units of product. How would the total costs be
affected?
7. As a management accountant, explain concisely to the president why the unit costs differed
in requirements 5 and 6.
SOLUTION
(15–20 min.) Interpretation of statements (continuation of 2-39).
1. The schedule in 2-39 can become a Schedule of Cost of Goods Manufactured and Sold
simply by including the beginning and ending finished goods inventory figures in the supporting
2. The sales manager’s salary would be charged as a marketing cost as incurred by both
3. An assembler’s wages would be assigned to the products worked on. Thus, the wages
4. The direct-indirect distinction can be resolved only with respect to a particular cost
2-7
5. Direct materials used = $320,000,000 ÷ 1,000,000 units = $320 per unit
6. Direct materials unit cost would be unchanged at $320 per unit. Depreciation cost per
7. Unit costs are averages, and they must be interpreted with caution. The $320 direct materials
unit cost is valid for predicting total costs because direct materials is a variable cost; total direct
materials costs indeed change as output levels change. However, fixed costs like depreciation
2-41 Income statement and schedule of cost of goods manufactured. The following items
(in millions) pertain to Schaeffer Corporation:
Schaeffer’s manufacturing costing system uses a three-part classification of direct materials,
direct manufacturing labor, and manufacturing overhead costs.
For Specific Date For Year 2017
Work-in-process inventory,
Jan. 1, 2017
$10 Plant utilities $ 8
Direct materials inventory,
Dec. 31, 2017
4 Indirect manufacturing labor 21
Finished-goods inventory,
Dec. 31, 2017
16 Depreciation—plant and
equipment
6
Accounts payable, Dec. 31,
2017
24 Revenues 359
Accounts receivable, Jan. 1,
2017
53 Miscellaneous manufacturing
overhead
15
Work-in-process inventory,
Dec. 31, 2017
5 Marketing, distribution, and
customer-service costs
90
Finished-goods inventory,
Jan 1, 2017
46 Direct materials purchased 88
Accounts receivable, Dec.
31, 2017
32 Direct manufacturing labor 40
Accounts payable, Jan. 1,
2017
45 Plant supplies used 9
Direct materials inventory,
Jan. 1, 2017
34 Property taxes on plant 2
2-8
Required:
Prepare an income statement and a supporting schedule of cost of goods manufactured. (For
additional questions regarding these facts, see the next problem.)
SOLUTION
(25–30 min.) Income statement and schedule of cost of goods manufactured.
Schaeffer Corporation
Income Statement
for the Year Ended December 31, 2017
(in millions)
Revenues $359
Cost of goods sold
Beginning finished goods, Jan. 1, 2017 $ 46
Cost of goods available for sale 270
Gross margin 105
Schaeffer Corporation
Schedule of Cost of Goods Manufactured
for the Year Ended December 31, 2017
(in millions)
Direct material costs
Beginning inventory, Jan. 1, 2017 $ 34
Direct materials purchased 88
Indirect manufacturing costs
Plant supplies used 9
Property taxes on plant 2
Plant utilities 8
Indirect manufacturing labor costs 21
2-9
2-42 Terminology, interpretation of statements (continuation of 2-41).
Required:
1. Calculate total prime costs and total conversion costs.
2. Calculate total inventoriable costs and period costs.
3. Design costs and R&D costs are not considered product costs for financial statement
purposes. When might some of these costs be regarded as product costs? Give an example.
4. Suppose that both the direct materials used and the depreciation on plant and equipment are
related to the manufacture of 2 million units of product. Determine the unit cost for the direct
materials assigned to those units and the unit cost for depreciation on plant and equipment.
Assume that yearly depreciation is computed on a straight-line basis.
5. Assume that the implied cost-behavior patterns in requirement 4 persist. That is, direct
material costs behave as a variable cost and depreciation on plant and equipment behaves as
a fixed cost. Repeat the computations in requirement 4, assuming that the costs are being
predicted for the manufacture of 3 million units of product. Determine the effect on total
costs.
6. Assume that depreciation on the equipment (but not the plant) is computed based on the
number of units produced because the equipment deteriorates with units produced. The
depreciation rate on equipment is $1.50 per unit. Calculate the depreciation on equipment
assuming (a) 2 million units of product are produced and (b) 3 million units of product are
produced.
2-10