Unlock document.
This document is partially blurred.
Unlock all pages and 1 million more documents.
Get Access

SOLUTION
(25–30 min.) Waiting times, manufacturing cycle times.
1a. Average waiting time for an order of Z35
( ) ( )
( )
2
Annual average number Manufacturing time
of orders of Z35 per order of Z35
Annual machine Annual average number Manufacturing time
2
capacity of orders of Z35 per order of Z35
x
´
ù
é- ´ ú
ê
ëû
2
[60 (100) ] (60 10,000) 600,000 150 hours per order
2 [8, 000 (60 100)] 2 (8,000 6,000) (2 2,000)
´ ´
= = = =
´ - ´ ´ - ´
1b.
Average manufacturing
cycle time per order for Z35
=
Average order
waiting time
+
Order manufacturing
time for Z35
2a. Average waiting time for Z35 and Y21
2 2
Annual average Manufacturing Annual average Manufacturing
number of time per order number of time per order
orders of Z35 of Z35 orders of Y21 of Y21
é
é ù é ù
æ ö æ ö æ ö æ ö
ê
ê ú ê
ç ÷ ç ÷ ç ÷ ç ÷´ ´ ´
ç ÷ ç ÷ ç ÷ ç ÷ê
ê ú ê
è ø è ø è ø è ø
ê
ë û ë
ë
Annual Annual average Manufacturing Annual average Manufacturing
2 machine number of time per order number of time per or
capacity orders of Z35 of Z35 orders of Y21
ù
ú
ú
ú
ú
ú
û
û
é ù
é æ ö æ ö æ ö
ê ú
ç ÷ ç ÷ ç ÷
´ - ´ - ´
êç ÷ ç ÷ ç ÷
ê ú
ê
ë è ø è ø è ø
ë û
der
of Y21
ù
é ù
æ ö ú
ê ú
ç ÷
ç ÷ú
ê ú
è ø
ë û
û
2 2
[60 (100) ] [30 (40) ] [(60 , 000) (30 00)] (600,000 48,000)
2 [8, 000 (60 0) (30 0)] 2 [8, 000 6, 000 1, 200] 2
´ + ´ ´10 + ´1,6 +
= = =
´ - ´10 - ´ 4 ´ - - ´ 800
648,000 405 hours
1,600
= =
2b.
Average manufacturing
cycle time for Z35
=
Average order
waiting time
+
Order manufacturing
time for Z35
Average manufacturing
cycle time for Y21
=
Average order
waiting time
+
Order manufacturing
time for Y21
19-34 Waiting times, relevant revenues, and relevant costs (continuation of 19-33).
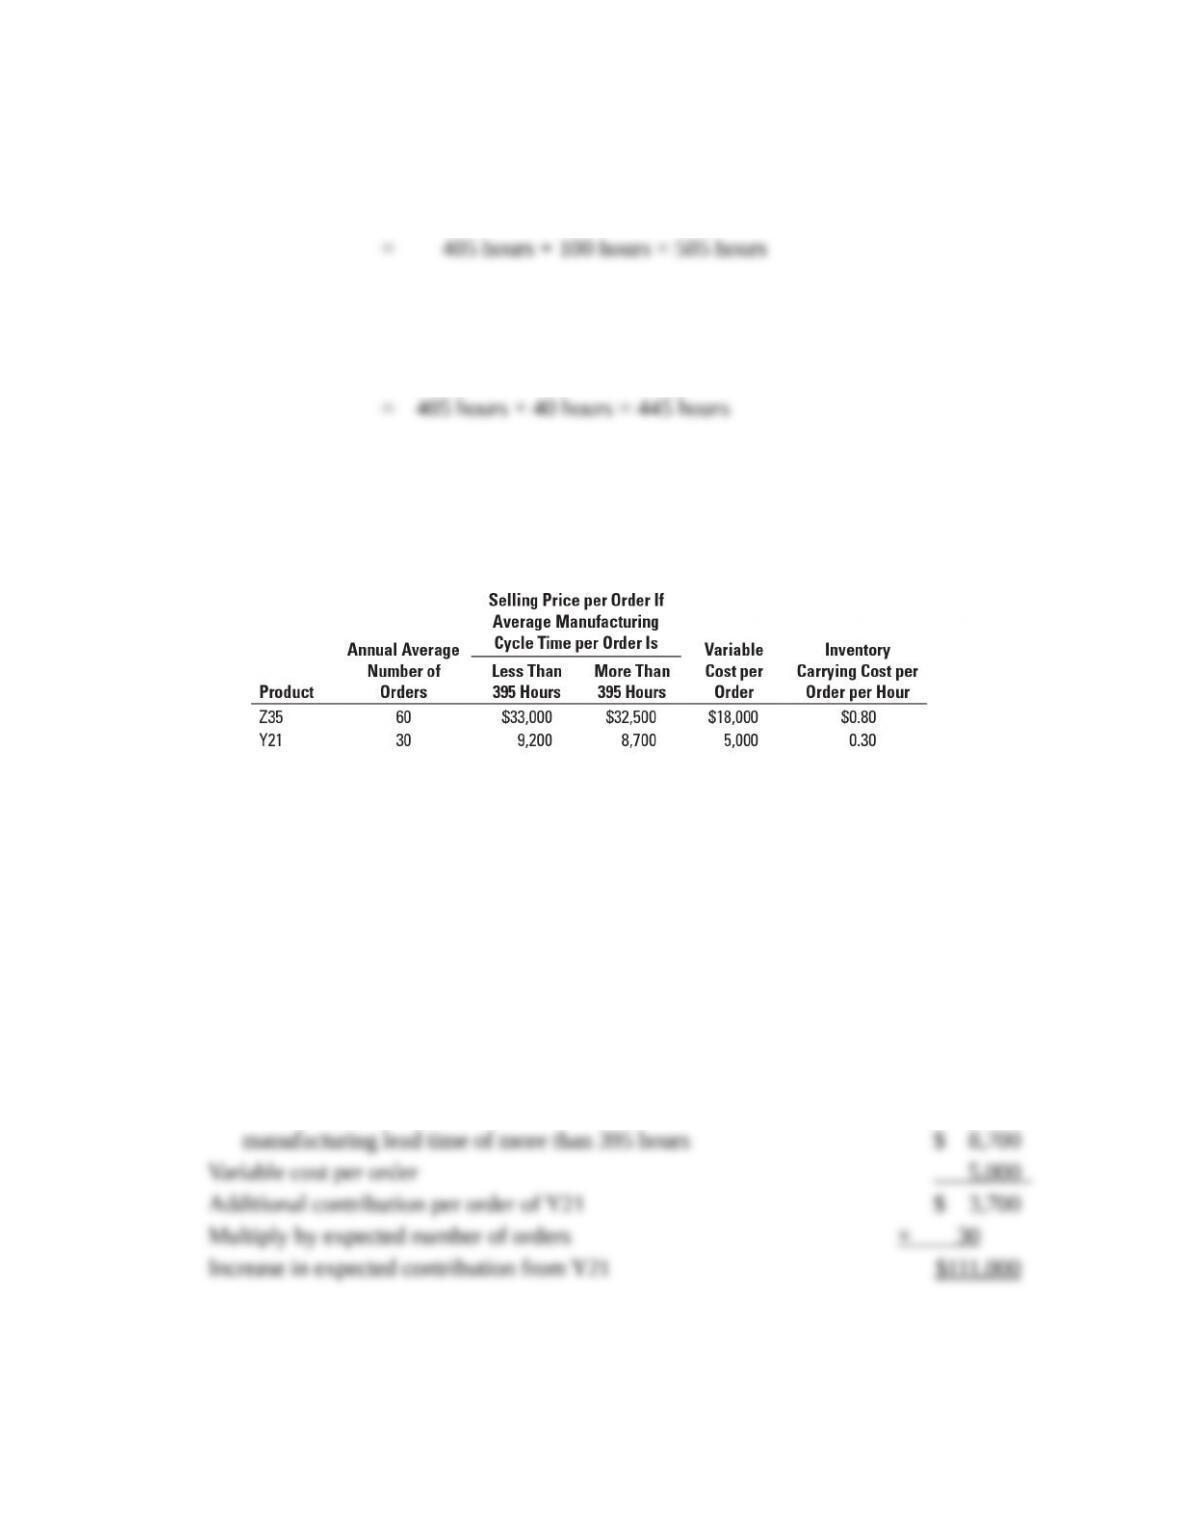
Sandstone is still debating whether it should introduce Y21. The following table provides
information on selling prices, variable costs, and inventory carrying costs for Z35 and Y21:
Required:
Using the average manufacturing cycle times calculated in Problem 19-33, requirement 2, should
Sandstone manufacture and sell Y21? Show your calculations and briefly explain your reasoning.
SOLUTION
(60 min.) Waiting times, relevant revenues, and relevant costs
(continuation of 19-33).
Selling price per order of Y21, which has an average
Expected loss in revenues and increase in costs from introducing Y21:
Expect
ed Loss in Expected Increase in Expected Loss in
Revenues from Carrying Costs from Revenues Plus
Increasing Average Increasing Average Expected Increases
Manufacturing Cycle Manufacturing Cycle in Carrying Costs of
Product Times for All Products Times for All Products Introducing Y21
(1) (2) (3) (4) = (2) + (3)
Increase in expected contribution from Y21 of $111,000 is greater than increase in expected costs of
$46,245.00 by $64,755. Therefore, Seawall should introduce Y21.
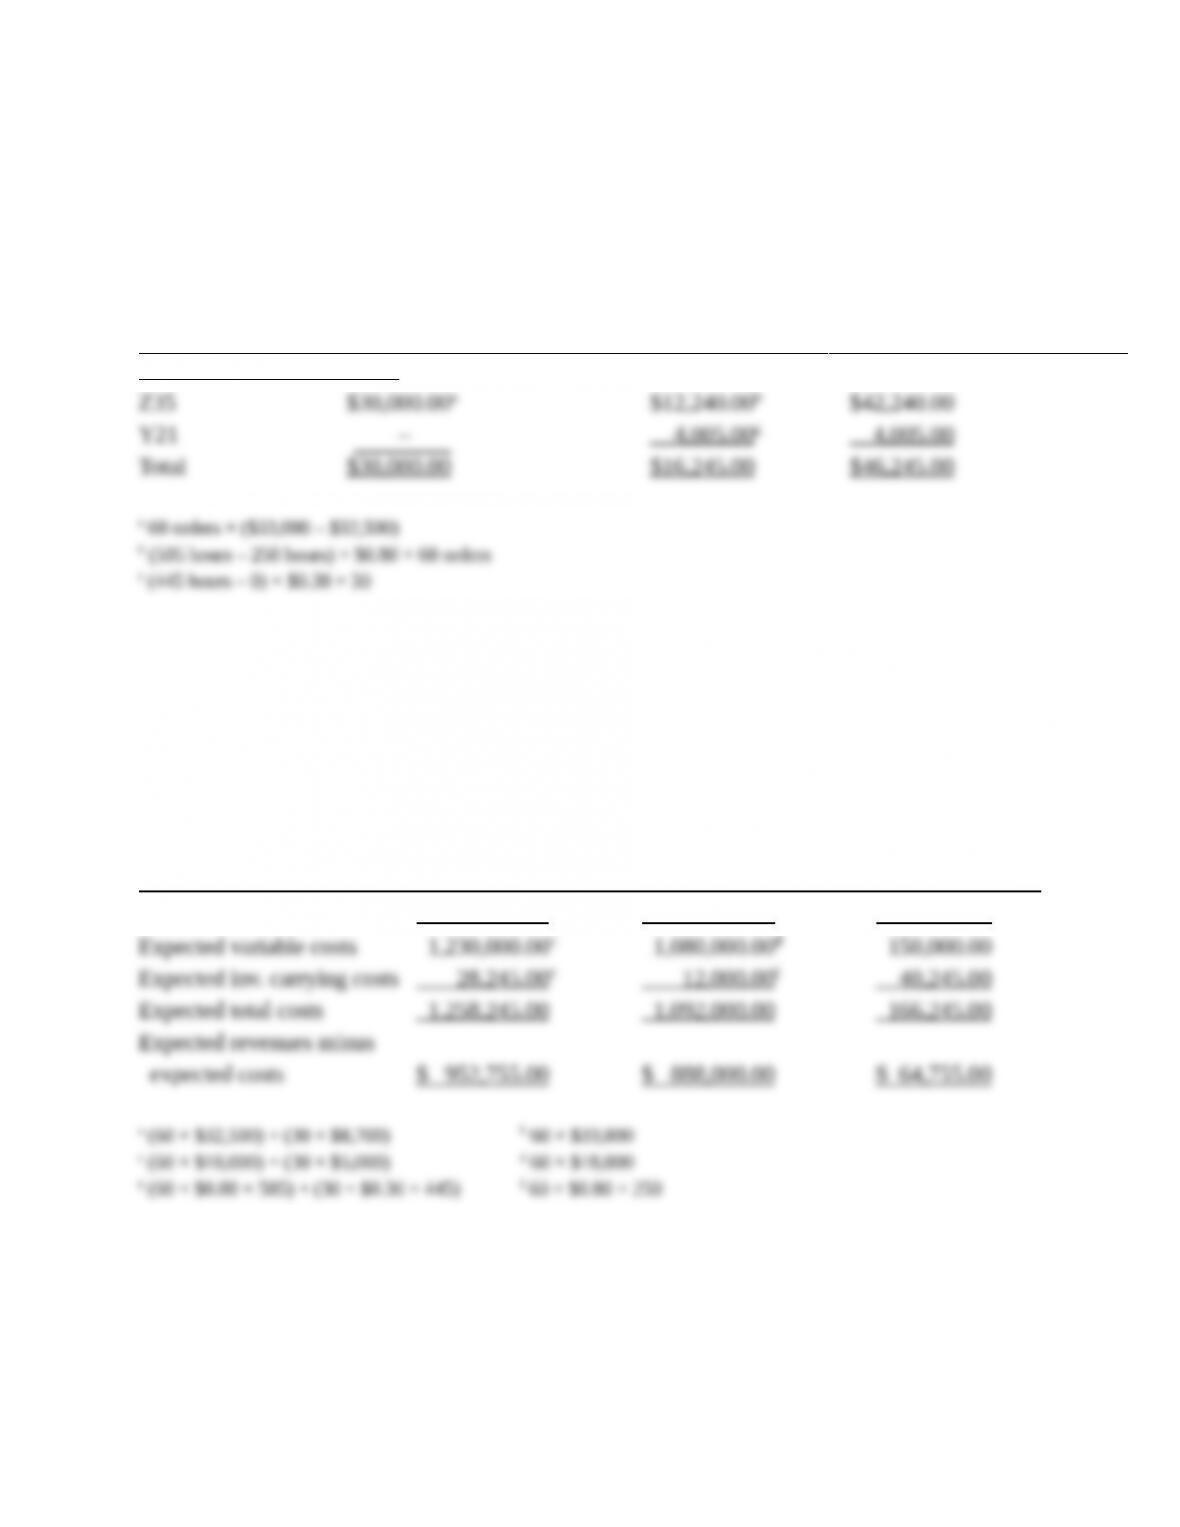
Alternative calculations of incremental revenues and incremental costs of introducing Y21:
Alternative 2:
Alternative 1: Do Not Relevant Revenues
Introduce Y21 Introduce Y21 and Relevant Costs
(1) (2) (3) = (1) – (2)
Expected revenues $2,211,000.00a$1,980,000.00b$231,000.00
19-35 Manufacturing cycle times, relevant revenues, and relevant costs. The DJ Corporation
makes custom specified wire harnesses for the trucking industry only upon receiving firm orders
from its customers. DJ has recently purchased a new machine to make two types of wire
harnesses, one for Peterbilt and the other for Kenworth. The annual capacity of the new machine
is 5,000 hours. The following information is available for next year:

Required:
1. Calculate the average manufacturing cycle times per order (a) if DJ manufactures only
Peterbilt and (b) if DJ manufactures both Peterbilt and Kenworth.
2. Even though Kenworth has a positive contribution margin, DJ’s managers are evaluating
whether DJ should (a) make and sell only Peterbilt or (b) make and sell both Peterbilt and
Kenworth. Which alternative will maximize DJ’s operating income? Show your calculations.
3. What other factors should DJ consider in choosing between the alternatives in requirement 2?
SOLUTION
(4045 min.) Manufacturing cycle times, relevant revenues, and relevant costs.
1a. Average waiting time for an order of Peterbilt harnesses if DJ Corporation manufactures
only for Peterbilt
=
2
Average number Manufacturing
of orders for Peterbilt time for Peterbilt harnesses
Annual machine Average number Manufacturing
2capacity of orders for Peterbilt time for Peterbilt harnesses
æ ö æ ö
´
ç ÷ ç ÷
è ø è ø
æ ö
´ - ´
ç
è
é ù
ê ú
÷
ø
ë û
=
2
[100 (40) ]
2 [5,000 (100 40)]
´
´ - ´
=
(100 1, 600)
2 (5, 000 4,000)
´
´ -
=
160,000
(2 1,000)´
= 80 hours
Average manufacturing
cycle time for Peterbilt harnesses
=
Average order waiting
time for Peterbilt harnesses
+
Order manufacturing time
for Peterbilt harnesses
1b. Average waiting time for an order of Peterbilt harnesses and Kenworth harnesses if DJ
Corporation manufactures harnesses for both Peterbilt and Kenworth.
()()()()
2 2
Average number Manufacturing Average number Manufacturing
of orders for Peterbilt time for Peterbilt of orders for Kenworth time for Kenworth
Annual machine Average numbe
capacity
2
´ ´
é ù é ù
+
ê ú ê ú
ë û ë û
´ -
()
()
Average number Manufacturing
r Manufacturing
of orders for Peterbilt time for Peterbilt of orders for Kenworth time for Kenworth
´ ´
é ù
-
ê ú
ë û
=
2 2
[100 (40) ] [10 (50) ]
2 [5, 000 (100 40) (10 50)]
´ + ´
´ - ´ - ´
=
[(100 1, 600) (10 2,500)]
2 [5,000 4,000 500]
´ + ´
´ - -
=
(160,000 25,000)
2 500
+
´
=
185,000 185 hours
1,000 =
Average manufacturing
cycle time for Peterbilt
=
Average order
waiting time
+
Order manufacturing
time for Peterbilt
Average manufacturing
cycle time for Kenworth
=
Average order
waiting time
+
Order manufacturing
time for Kenworth
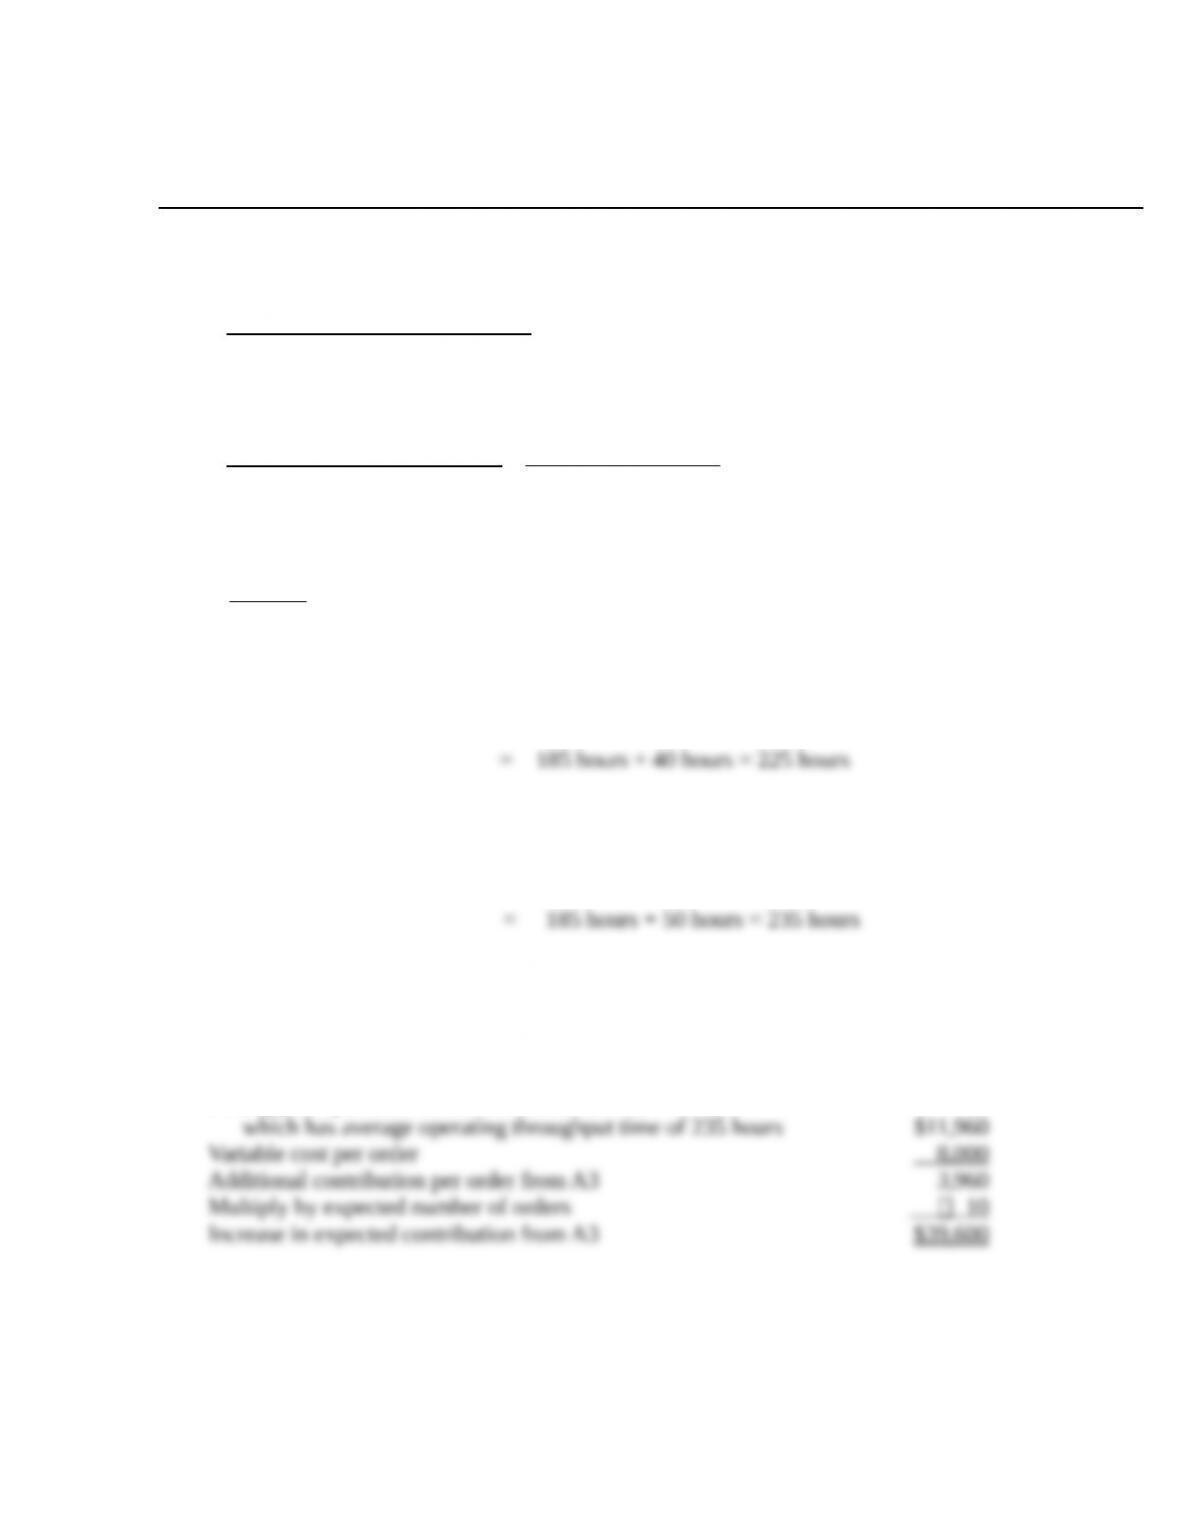
2. The direct approach is to look at incremental revenues and incremental costs of
manufacturing and selling harnesses for Kenworth.
Selling price per order for Kenworth harnesses,
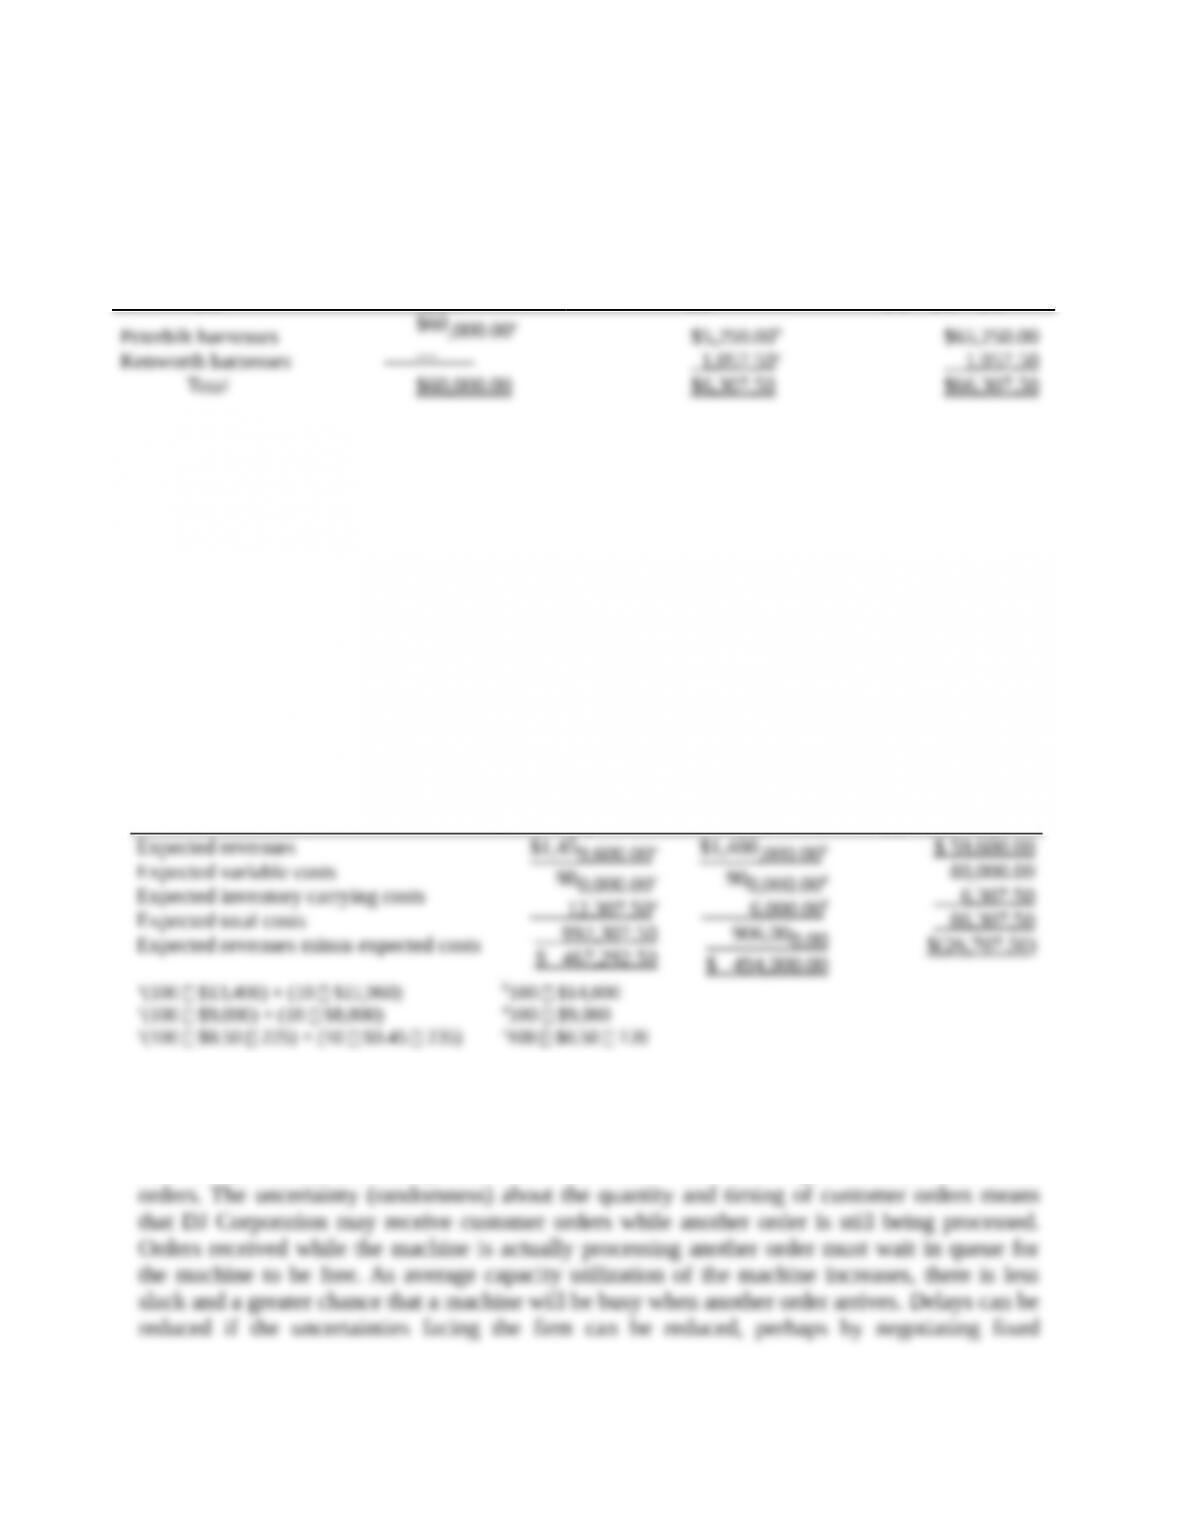
Expected loss in revenues and increase in costs from introducing harnesses for Kenworth:
Product
(1)
Expected Loss in
Revenues from
Increasing Average
Manufacturing Cycle
Times for All Products
(2)
Expected Increase in
Carrying Costs from
Increasing Average
Manufacturing Cycle
Times for All Products
(3)
Expected Loss in
Revenues Plus
Expected Increases in
Carrying Costs of
Introducing A3
(4) = (2) + (3)
$60,000.00a
a100 orders ($14,000 $13,400)
b(225 hours – 120 hours) $0.50 100 orders
c(235 hours – 0) $0.45 10 orders
Increase in expected contribution from Kenworth harnesses of $39,600 is less than increase in
expected costs of $66,307.50 by $26,707.50. Therefore, DJ Corporation should not sell harnesses
to Kenworth; instead, it should only sell harnesses to Peterbilt.
Alternative calculations of incremental revenues and incremental costs of introducing A3 follow.
Alternative 1:
Introduce
Kenworth
harnesses
(1)
Alternative 2:
Do Not
Introduce
Kenworth
harnesses
(2)
Relevant Revenues
and Relevant Costs
(3) = (1) – (2)
Expected revenues
$1
$1
$ 59 ,600.00
3. Delays occur in processing will occur if DJ Corporation produces harnesses for both
Peterbilt and Kenworth because of (a) uncertainty about how many orders DJ Corporation will
actually receive (DJ Corporation expects to receive 100 orders from Peterbilt and 10 orders from
Kenworth), and (b) uncertainty about the actual dates when DJ Corporation will receive the
Selling harnesses to Kenworth may be a strategically important product for DJ
If DJ Corporation could reduce manufacturing time for Kenworth harnesses (and Peterbilt
harnesses), it could find it profitable to manufacture both harnesses. DJ Corporation may also
19-36 Compensation linked with profitability, waiting time, and quality measures. Family
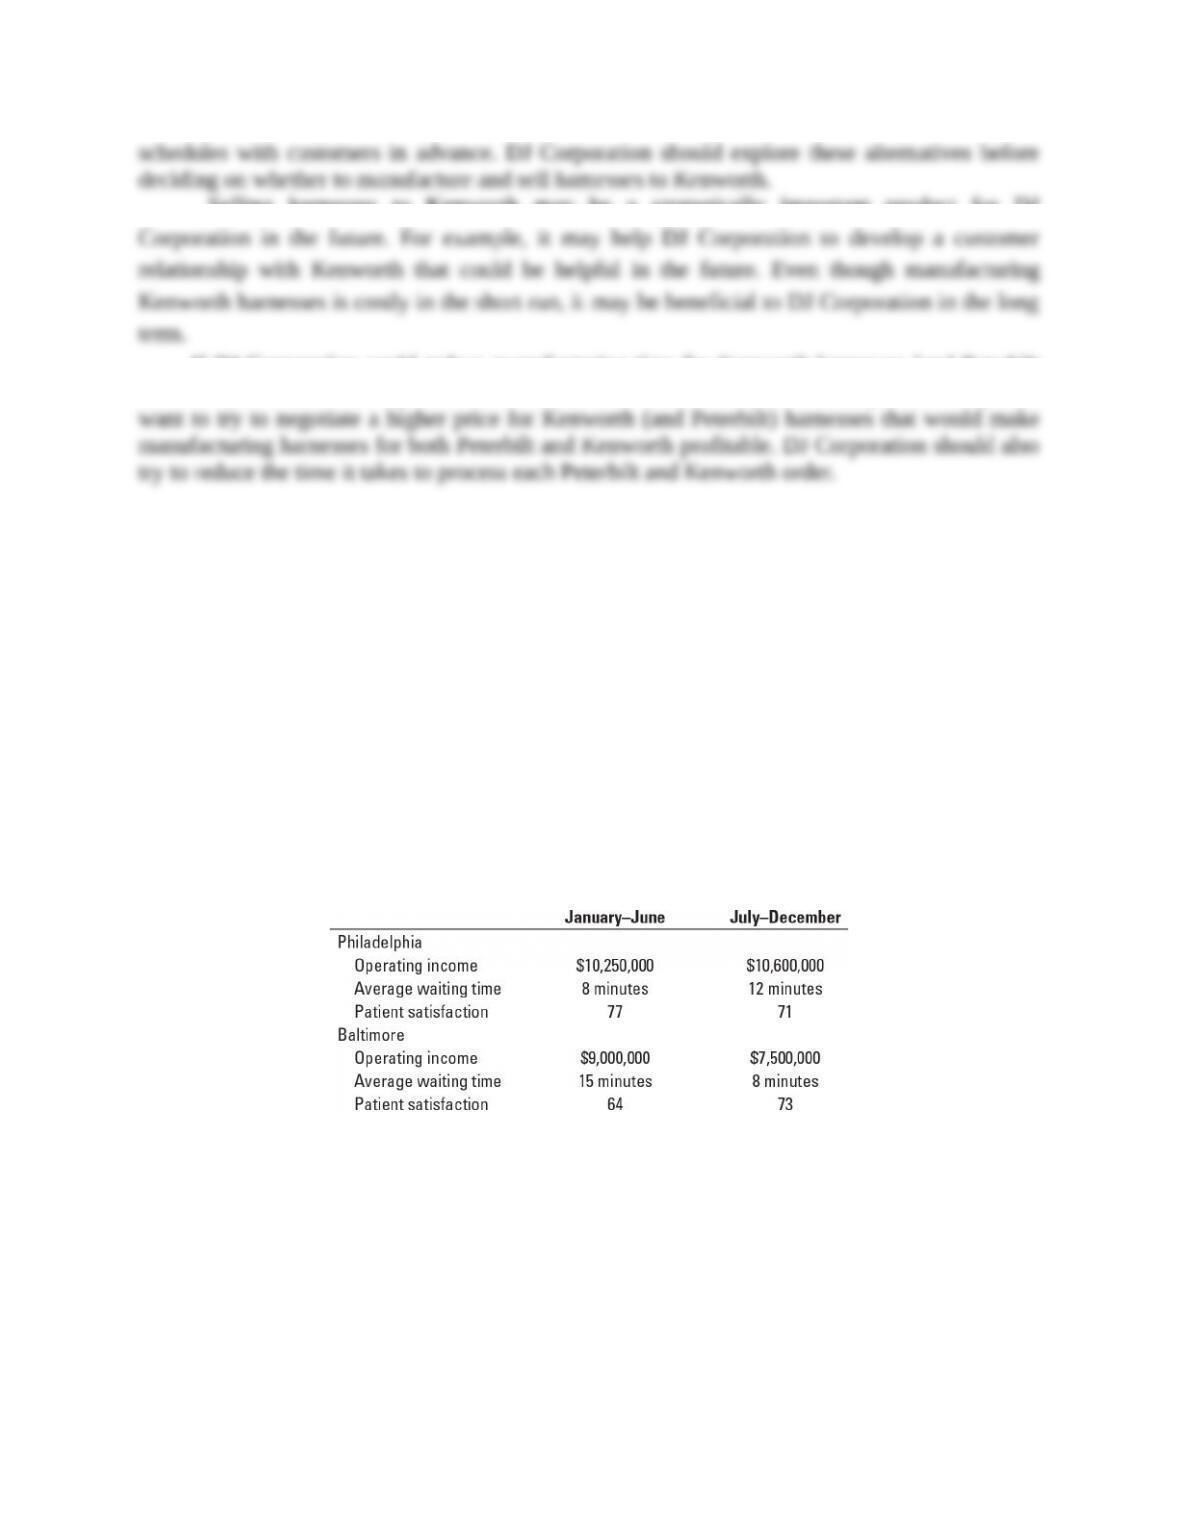
First Healthcare operates two medical groups, one in Philadelphia and one in Baltimore. The
semiannual bonus plan for each medical group’s president has three components:
a. Profitability performance. Add 0.75% of operating income.
b. Average patient waiting time. Add $40,000 if the average waiting time for a patient to see a
doctor after the scheduled appointment time is less than 10 minutes. If average patient
waiting time is more than 10 minutes, add nothing.
c. Patient satisfaction performance. Deduct $45,000 if patient satisfaction (measured using a
survey asking patients about their satisfaction with their doctor and their overall satisfaction
with Family First Healthcare) falls below 70 on a scale from 0 (lowest) to 100 (highest). No
additional bonus is awarded for satisfaction scores of 70 or more.
Semiannual data for 2017 for the Philadelphia and Baltimore groups are as follows:
Required:
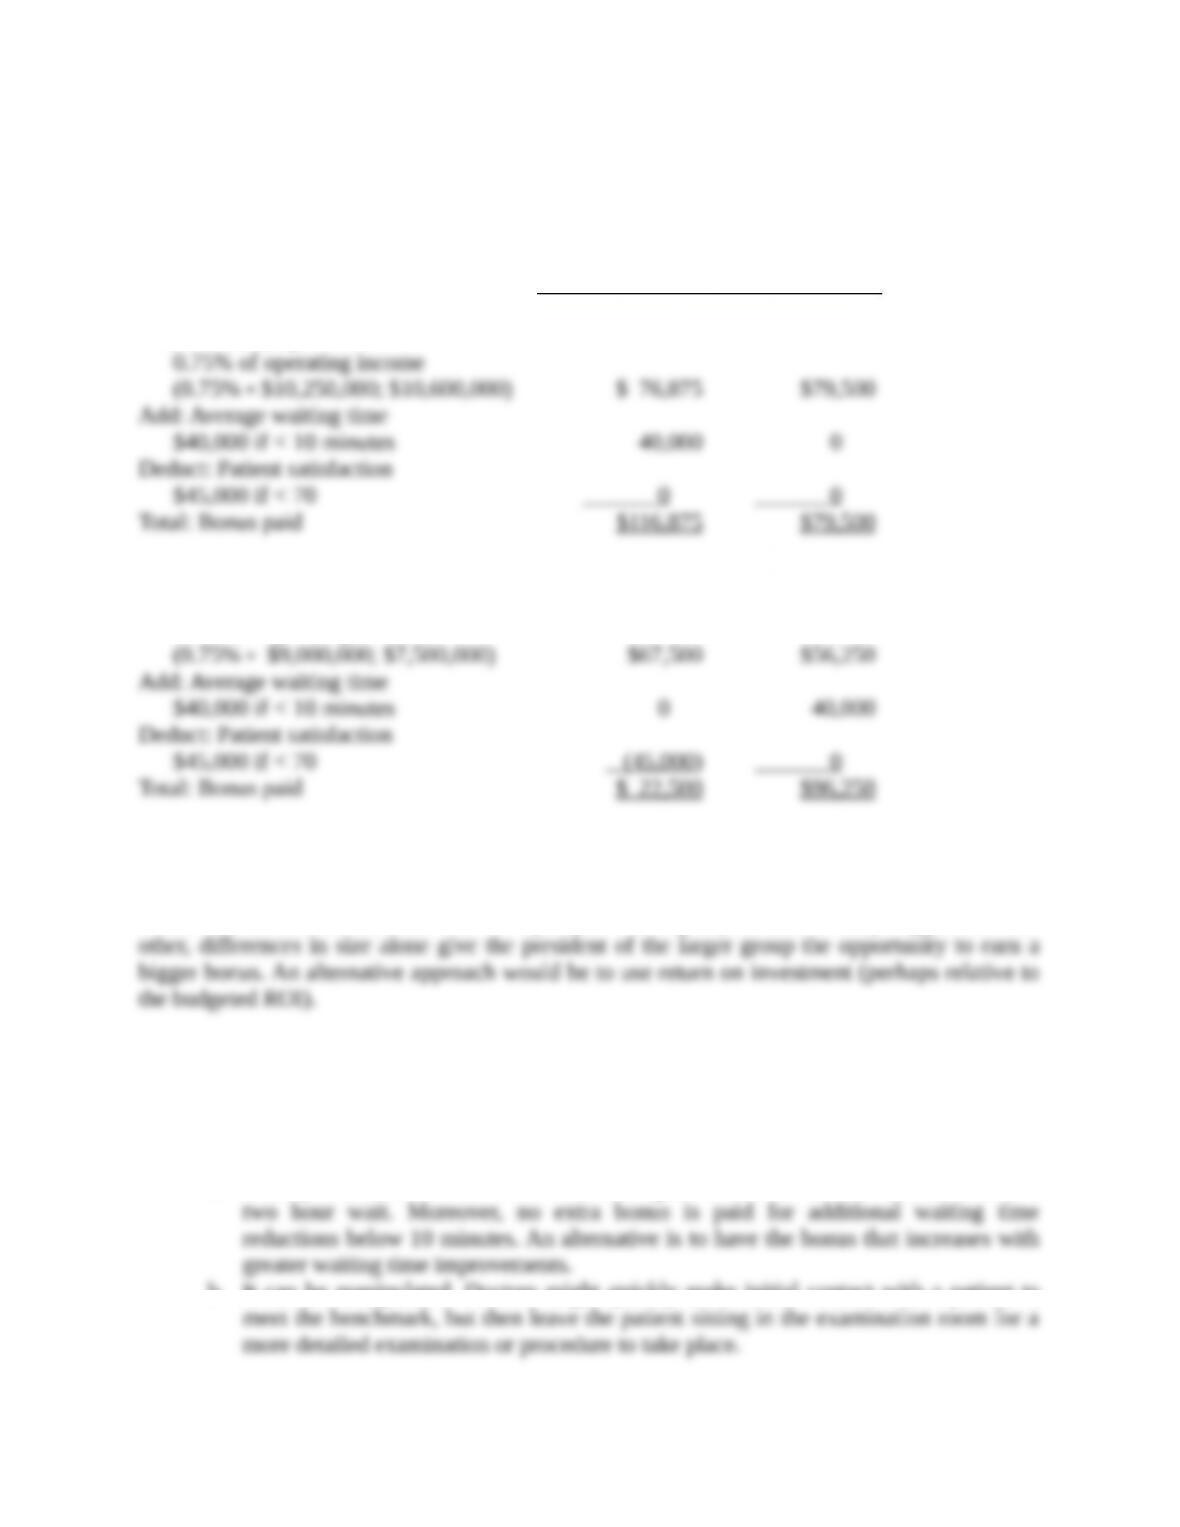
1. Compute the bonuses paid in each half year of 2017 to the Philadelphia and Baltimore
medical group presidents.
2. Discuss the validity of the components of the bonus plan as measures of profitability, waiting
time performance, and patient satisfaction. Suggest one shortcoming of each measure and
how it might be overcome (by redesign of the plan or by another measure).
3. Why do you think Family First Healthcare includes measures of both operating income and
waiting time in its bonus plan for group presidents? Give one example of what might happen
if waiting time was dropped as a performance measure.
SOLUTION
(30–40 min.) Compensation linked with profitability, waiting time, and quality measures.
1. Jan.-June July-Dec.
Philadelphia
Add: Profitability
Baltimore
Add: Profitability
0.75% of operating income
2. Operating income as a measure of profitability
Operating income captures revenue and cost-related factors. However, there is no recognition of
investment differences between the two groups. If one group is substantially bigger than the
10 minute benchmark as a measure of patient response time
This measure reflects the ability of Family First Healthcare to meet a benchmark for patient
response time. Several concerns arise with this specific measure:
a. It is a yes-or-no cut-off. A 12-minute waiting time earns no bonus, but neither does a
b. It can be manipulated. Doctors might quickly make initial contact with a patient to
c. It reflects performance relative only to the initial waiting time. It does not consider
Problems in (b) and (c) can be overcome by measuring total patient response time (such as how
long it takes from the time a patient makes an appointment to the time the actual appointment is
concluded), in addition to average waiting time to meet the doctor.
Patient satisfaction as a measure of quality
This measure represents a common method for assessing quality. However, there are several
concerns with its use:
a. Patient satisfaction is likely to be influenced by a number of factors that are outside
b. It is influenced by the questions asked in the survey and the survey methodology. As a
A combination of measures may work well as a composite measure of quality.
3. Most companies use both financial and nonfinancial measures to evaluate performance,
sometimes presented in a single report such as a balanced scorecard. Using multiple measures of
performance enables top management to evaluate whether lower-level managers have improved
An important issue is the relative importance to place on the different measures. If waiting
time is not used for performance evaluation, managers will concentrate on increasing operating
income and give less attention to waiting time, even if waiting time has a significant influence on
19-37 Ethics and quality. Weston Corporation manufactures auto parts for two leading
Japanese automakers. Nancy Evans is the management accountant for one of Weston’s largest
manufacturing plants. The plant’s general manager, Chris Sheldon, has just returned from a
meeting at corporate headquarters where quality expectations were outlined for 2017. Chris calls
Nancy into his office to relay the corporate quality objective that total quality costs will not
exceed 10% of total revenues by plant under any circumstances. Chris asks Nancy to provide
him with a list of options for meeting corporate headquarters’ quality objective. The plant’s
initial budgeted revenues and quality costs for 2017 are as follows:
Prior to receiving the new corporate quality objective, Nancy had collected information for all of
the plant’s possible options for improving both product quality and costs of quality. She was
planning to introduce the idea of reengineering the manufacturing process at a one-time cost of
$112,500, which would decrease product inspection costs by approximately 25% per year and
was expected to reduce warranty repairs and customer support by an estimated 40% per year.
After seeing the new corporate objective, Nancy is reconsidering the reengineering idea.
Nancy crunches the numbers again. By increasing the cost-of-quality control training for
production staff by $22,500 per year, the company would reduce inspection costs by 10%
annually and reduce warranty repairs and customer support costs by 20% per year as well. She is
leaning toward only presenting this latter option to Chris because this is the only option that
meets the new corporate quality objective.
Required:
1. Calculate the ratio of each budgeted costs-of-quality category (prevention, appraisal, internal
failure, and external failure) to budgeted revenues for 2017. Are the budgeted total costs of
quality as a percentage of budgeted revenues currently less than 10%?
2. Which of the two quality options should Nancy propose to the general manager, Chris
Sheldon? Show the 2-year outcome for each option: (a) reengineer the manufacturing process
for $112,500 and (b) increase quality training expenditure by $22,500 per year.
3. Suppose Nancy decides not to present the reengineering option to Chris. Is Nancy’s action
unethical? Explain.


