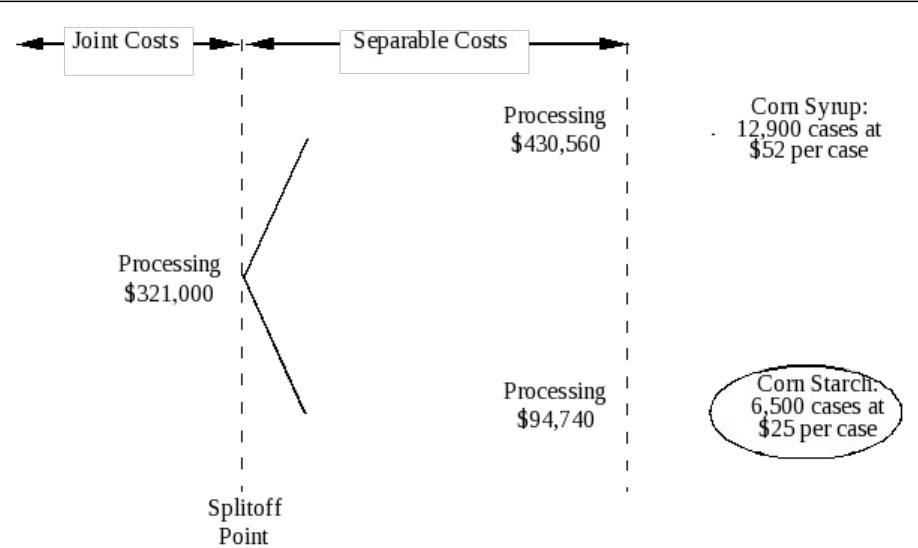
SOLUTION EXHIBIT 16-23 (all numbers are in thousands)
16-24 Alternative joint-cost-allocation methods, further-process decision. The Tempura
Spirits Company produces two products—methanol (wood alcohol) and turpentine—by a joint
process. Joint costs amount to $124,000 per batch of output. Each batch totals 9,500 gallons:
25% methanol and 75% turpentine. Both products are processed further without gain or loss in
volume. Separable processing costs are methanol, $4 per gallon, and turpentine, $2 per gallon.
Methanol sells for $22 per gallon. Turpentine sells for $16 per gallon.
Required:
1. How much of the joint costs per batch will be allocated to methanol and to turpentine,
assuming that joint costs are allocated based on the number of gallons at splitoff point?
2. If joint costs are allocated on an NRV basis, how much of the joint costs will be allocated to
methanol and to turpentine?
3Prepare product-line income statements per batch for requirements 1 and 2. Assume no
beginning or ending inventories.
4. The company has discovered an additional process by which the methanol (wood alcohol)
can be made into a pleasant-tasting alcoholic beverage. The selling price of this beverage
would be $55 a gallon. Additional processing would increase separable costs $12 per gallon
(in addition to the $4 per gallon separable cost required to yield methanol). The company
would have to pay excise taxes of 20% on the selling price of the beverage. Assuming no
other changes in cost, what is the joint cost applicable to the wood alcohol (using the NRV
method)? Should the company produce the alcoholic beverage? Show your computations.
SOLUTION
(40 min.) Alternative joint-cost-allocation methods, further-process decision.
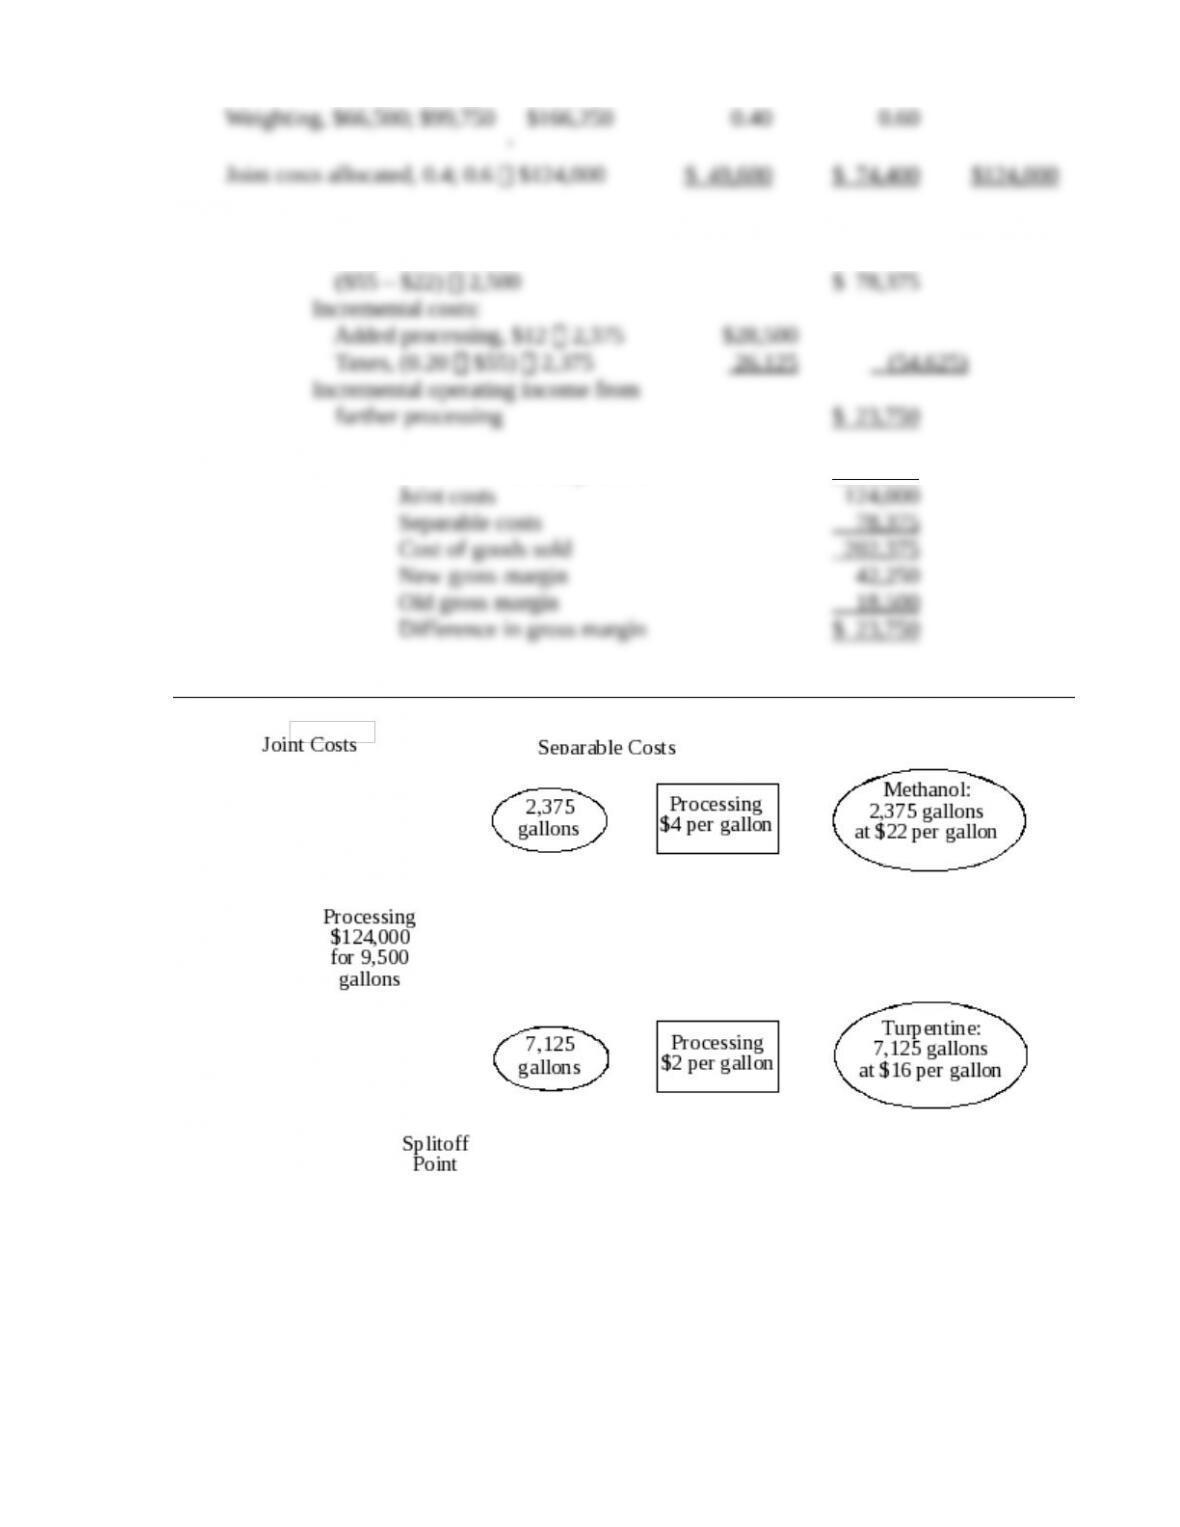
A diagram of the situation is in Solution Exhibit 16-24.
1. Methanol Turpentine Total
2. Methanol Turpentine Total
Final sales value of total production,
3. a. Physical-measure (gallons) method:
Methanol Turpentine Total
b. Estimated net realizable value method:
Methanol Turpentine Total
Alcohol Bev. Turpentine Total
An incremental approach demonstrates that the company should use the new process:
Incremental revenue,
Proof: Total sales of both products $244,625
SOLUTION EXHIBIT 16-24
16-25 Alternative methods of joint-cost allocation, ending inventories. The Cook Company
operates a simple chemical process to convert a single material into three separate items, referred
to here as X, Y, and Z. All three end products are separated simultaneously at a single splitoff
point.
Products X and Y are ready for sale immediately upon splitoff without further processing or
any other additional costs. Product Z, however, is processed further before being sold. There is
no available market price for Z at the splitoff point.
The selling prices quoted here are expected to remain the same in the coming year. During
2017, the selling prices of the items and the total amounts sold were as follows:
■X—68 tons sold for $1,200 per ton
■Y—480 tons sold for $900 per ton
■Z—672 tons sold for $600 per ton
The total joint manufacturing costs for the year were $580,000. Cook spent an additional
$200,000 to finish product Z.
There were no beginning inventories of X, Y, or Z. At the end of the year, the following
inventories of completed units were on hand: X, 132 tons; Y, 120 tons; Z, 28 tons. There was no
beginning or ending work in process.
Required:
1. Compute the cost of inventories of X, Y, and Z for balance sheet purposes and the cost of
goods sold for income statement purposes as of December 31, 2017, using the following
joint-cost-allocation methods:
a. NRV method
b. Constant gross-margin percentage NRV method
2. Compare the gross-margin percentages for X, Y, and Z using the two methods given in
requirement 1.
SOLUTION
(40 min.) Alternative methods of joint-cost allocation, ending inventories.
Total production for the year was:
Ending Total
Sold Inventories Production
A diagram of the situation is in Solution Exhibit 16-25.
1. a. Net realizable value (NRV) method:
X Y Z Total
Final sales value of total production,
¸
Joint costs allocated,
Ending Inventory Percentages:
X Y Z
Income Statement
X Y Z Total
Revenues,
b. Constant gross-margin percentage NRV method:
Step 1:
Step 2:
X Y Z Total
Final sales value of total production,
Income Statement
X Y Z Total
Revenues, 68 $1,200;
Cost of goods sold:
Summary
X Y Z Total
a. NRV method:
b. Constant gross-margin
percentage NRV method
2.Gross-margin percentages:
X Y Z
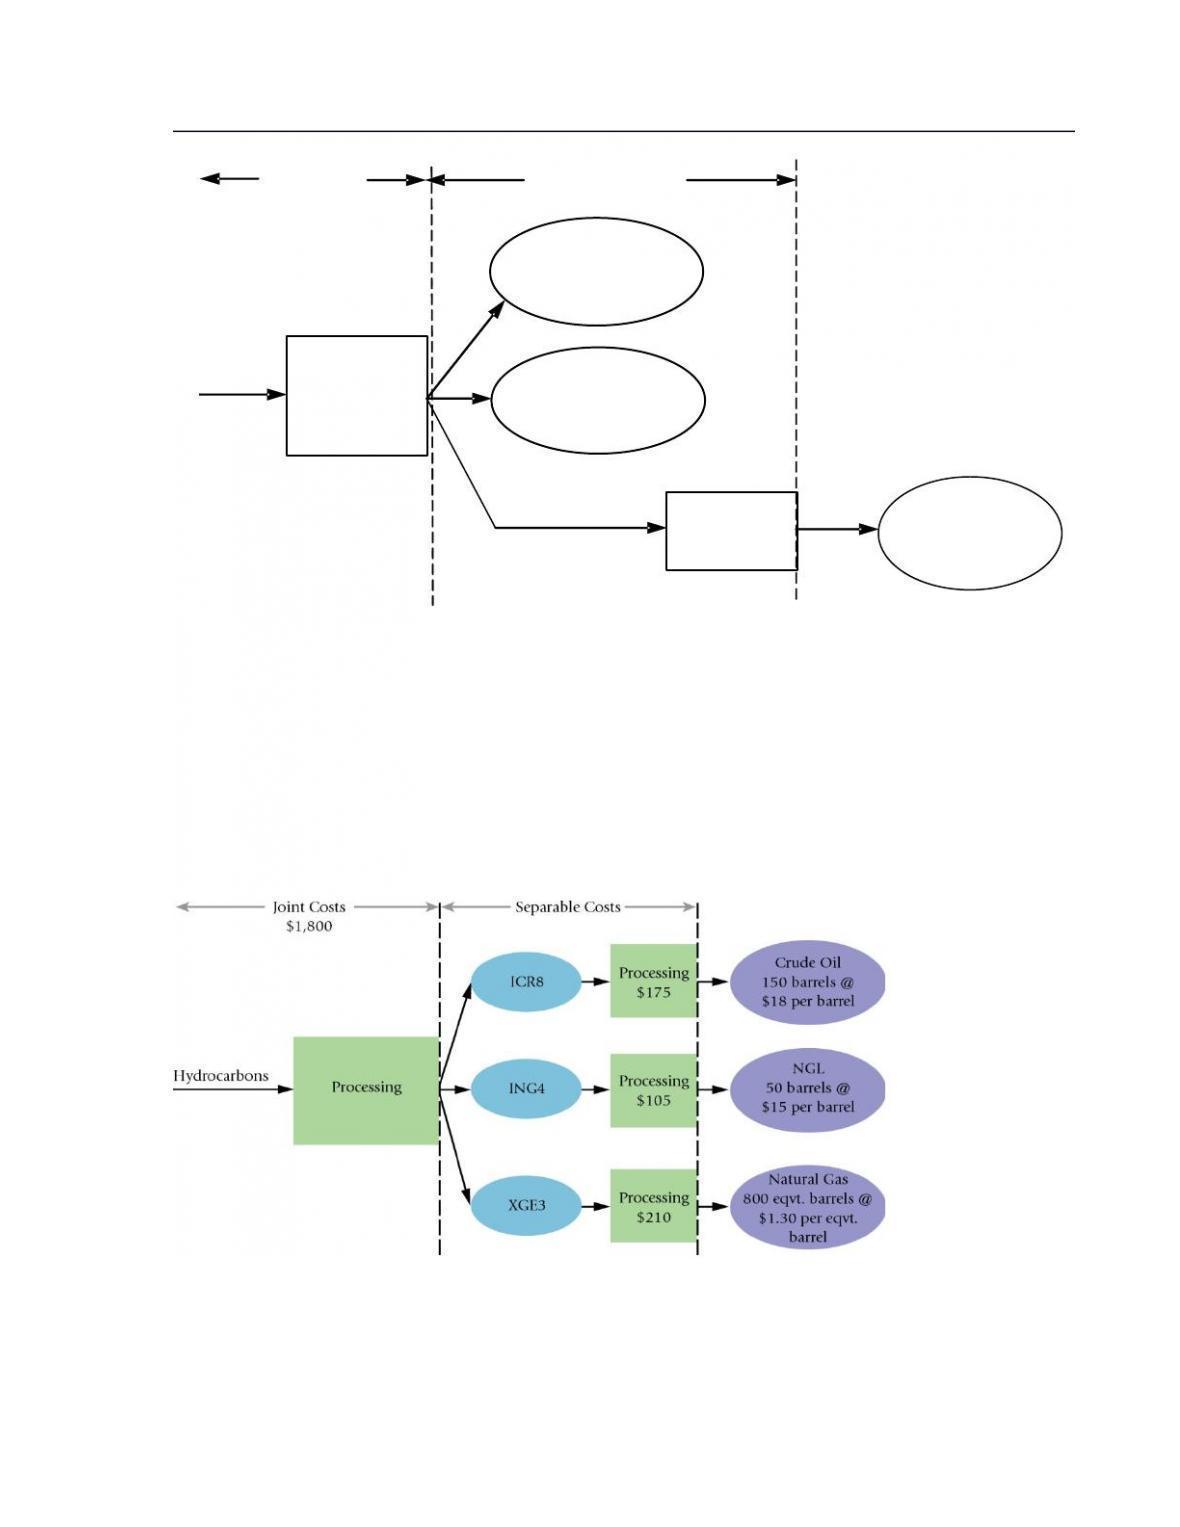
SOLUTION EXHIBIT 16-25
Splitoff
Point
Processing
$200000
Product Y:
600 tons at
$900 per ton
Product X:
200 tons at
$1,200 per ton
Joint
Processing
Costs
$580,000
Product Z:
700 tons at
$600 per ton
Joint Costs
Separable Costs
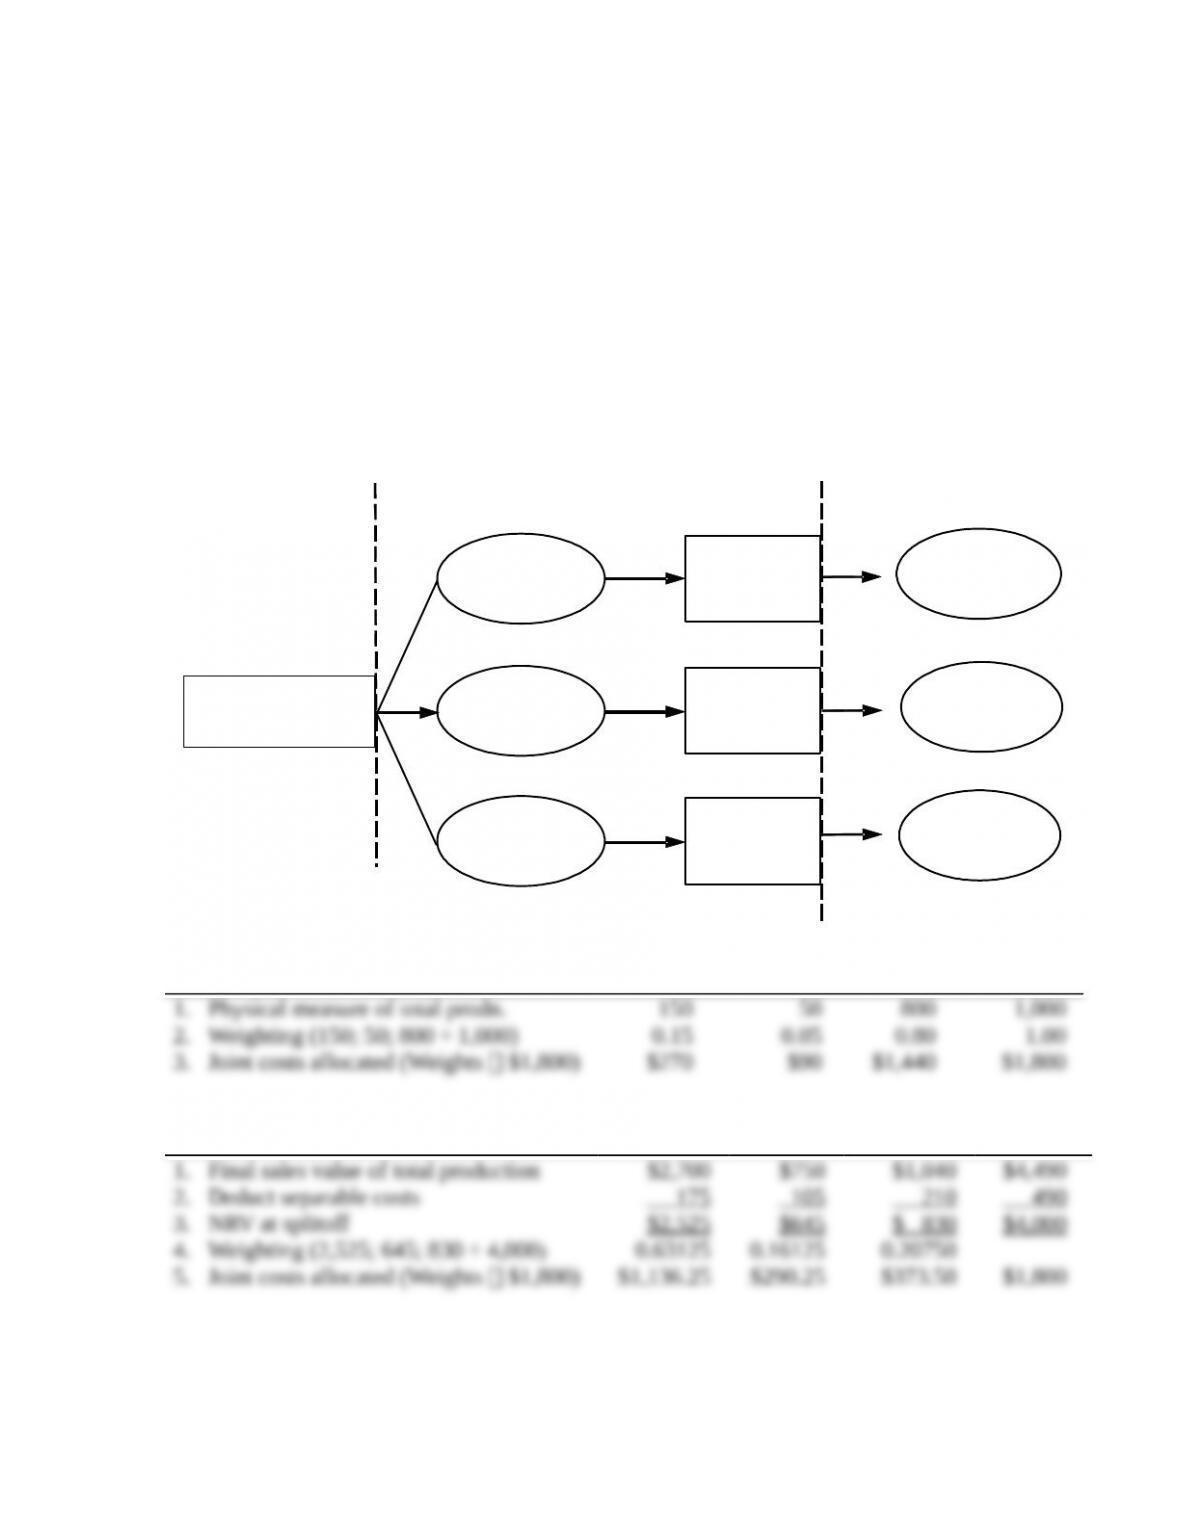
16-26 Joint-cost allocation, process further. Sinclair Oil & Gas, a large energy conglomerate,
jointly processes purchased hydrocarbons to generate three nonsalable intermediate products:
ICR8, ING4, and XGE3. These intermediate products are further processed separately to produce
crude oil, natural gas liquids (NGL), and natural gas (measured in liquid equivalents). An
overview of the process and results for August 2017 are shown here. (Note: The numbers are
small to keep the focus on key concepts.)
A federal law that has recently been passed taxes crude oil at 30% of operating income. No new
tax is to be paid on natural gas liquids or natural gas. Starting August 2017, Sinclair Oil & Gas
must report a separate product-line income statement for crude oil. One challenge facing Sinclair
Oil & Gas is how to allocate the joint cost of producing the three separate salable outputs.
Assume no beginning or ending inventory.
Required:
1. Allocate the August 2017 joint cost among the three products using the following:
a. Physical-measure method
b. NRV method
2. Show the operating income for each product using the methods in requirement 1.
3. Discuss the pros and cons of the two methods to Sinclair Oil & Gas for making decisions
about product emphasis (pricing, sell-or-process-further decisions, and so on).
4. Draft a letter to the taxation authorities on behalf of Sinclair Oil & Gas that justifies the
joint-cost-allocation method you recommend Sinclair use.
SOLUTION
(30 min.) Joint-cost allocation, process further.
Joint Costs =
$1800
ICR8
(Non-Saleable)
ING4
(Non-Saleable)
XGE3
(Non-Saleable)
Processing
$175
Processing
$210
Processing
$105
Crude Oil
150 bbls × $18 / bbl =
$2700
NGL
50 bbls × $15 / bbl =
$750
Gas
800 eqvt bbls ×
$1.30 / eqvt bbl =
$1040
Splitoff
Point
1a. Physical Measure Method
Crude Oil NGL Gas Total
1b. NRV Method
Crude Oil NGL Gas Total
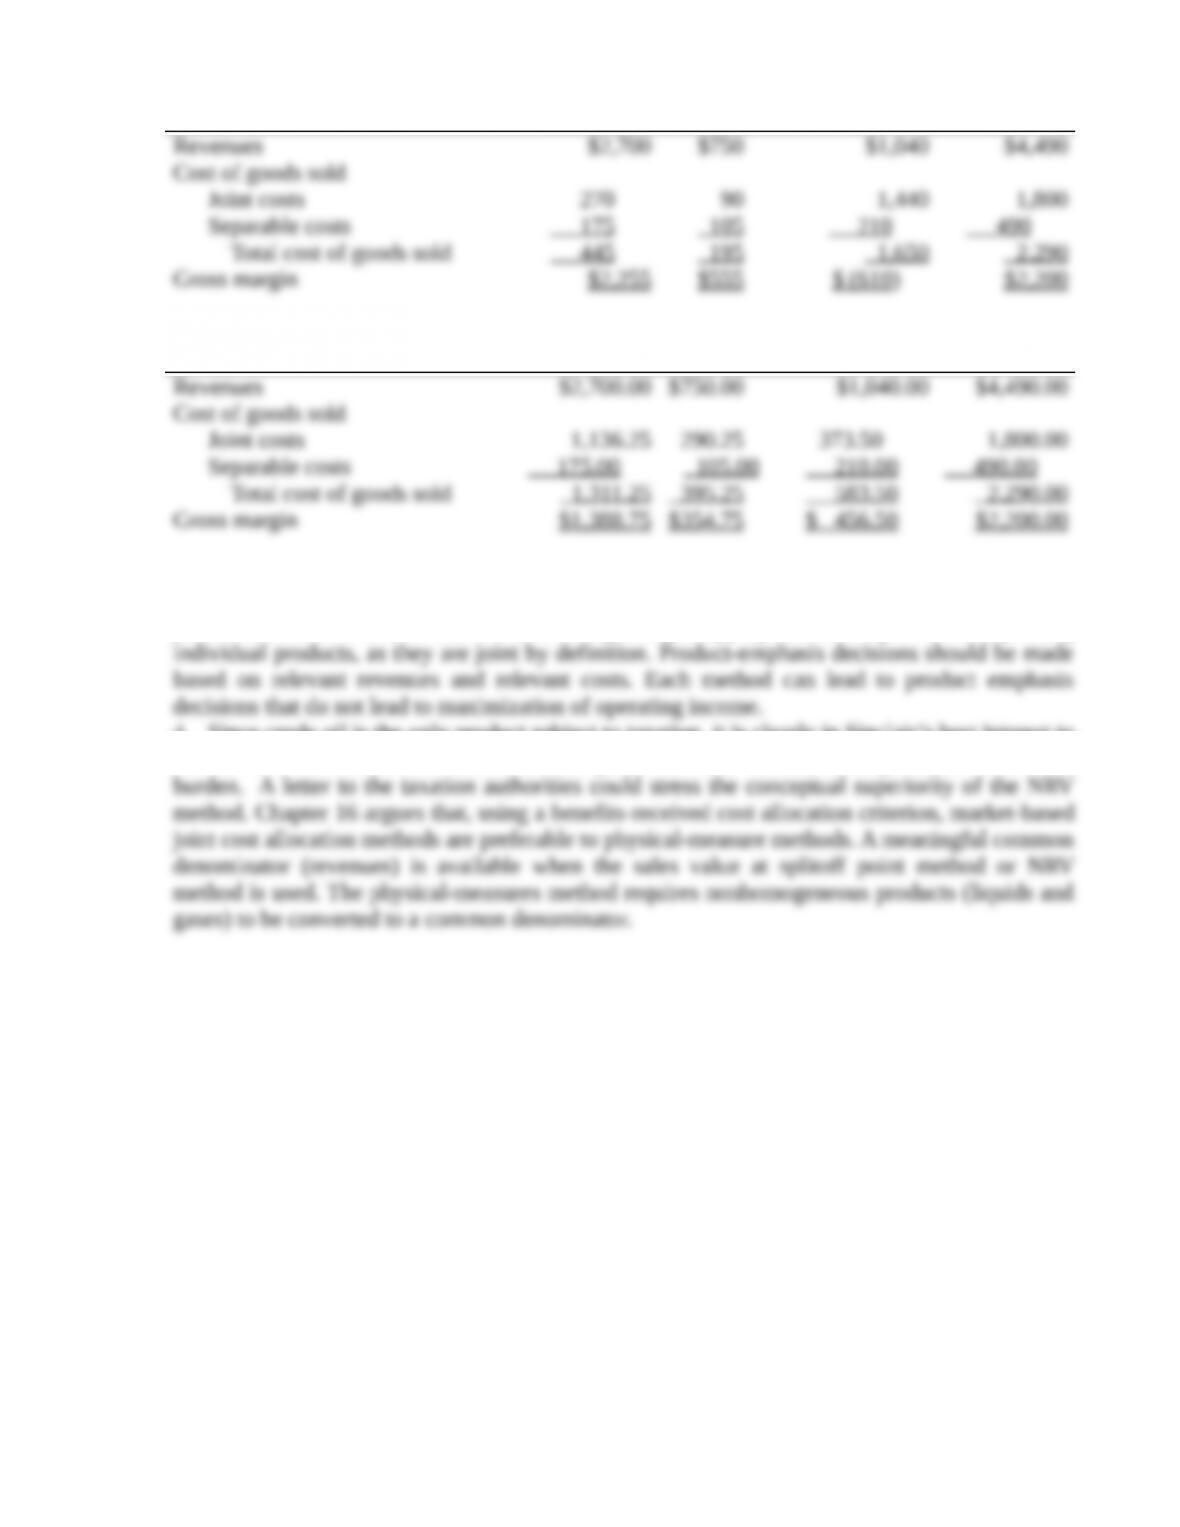
2. The operating-income amounts for each product using each method is:
(a) Physical Measure Method
Crude Oil NGL Gas Total
(b) NRV Method
Crude Oil NGL Gas Total
3. Neither method should be used for product emphasis decisions. It is inappropriate to use
joint-cost-allocated data to make decisions regarding dropping individual products, or pushing
4. Since crude oil is the only product subject to taxation, it is clearly in Sinclair’s best interest to
use the NRV method since it leads to a lower profit for crude oil and, consequently, a smaller tax
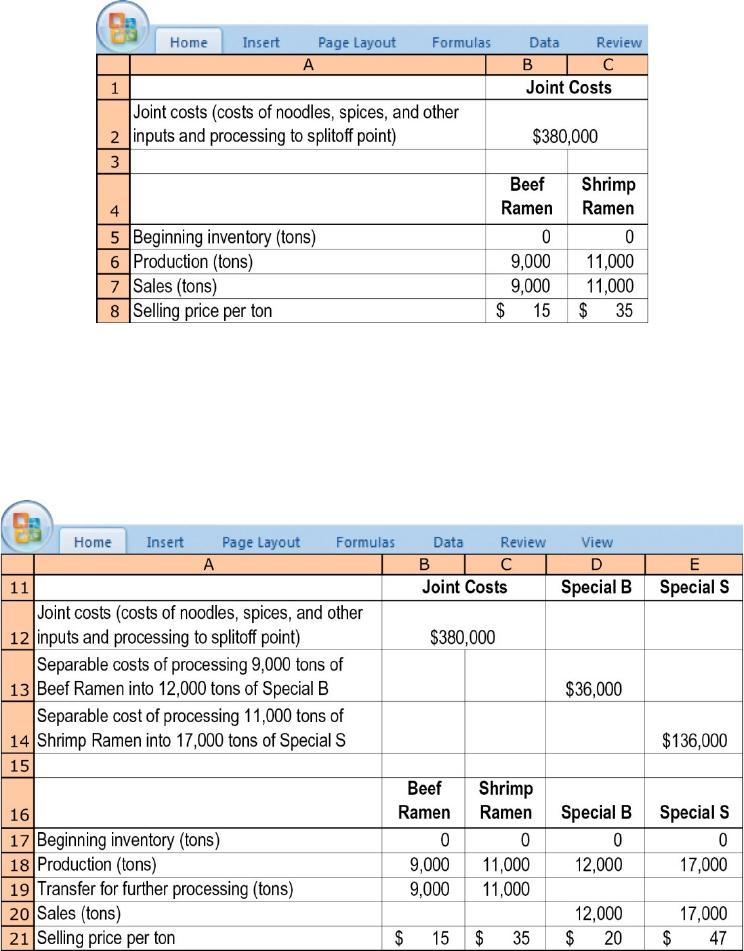
16-27 Joint-cost allocation, sales value, physical measure, NRV methods. Tasty Foods
produces two types of microwavable products: beef-flavored ramen and shrimp-flavored ramen.
The two products share common inputs such as noodle and spices. The production of ramen
results in a waste product referred to as stock, which Tasty dumps at negligible costs in a local
drainage area. In June 2017, the following data were reported for the production and sales of
beef-flavored and shrimp-flavored ramen:
Due to the popularity of its microwavable products, Tasty decides to add a new line of products that
targets dieters. These new products are produced by adding a special ingredient to dilute the original
ramen and are to be sold under the names Special B and Special S, respectively. Following are the
monthly data for all the products:
Required:
1. Calculate Tasty’s gross-margin percentage for Special B and Special S when joint costs are
allocated using the following:
a. Sales value at splitoff method
b. Physical-measure method
c. Net realizable value method
2. Recently, Tasty discovered that the stock it is dumping can be sold to cattle ranchers at $5 per
ton. In a typical month with the production levels shown, 3,000 tons of stock are produced
and can be sold by incurring marketing costs of $11,100. Sabrina Donahue, a management
accountant, points out that treating the stock as a joint product and using the sales value at
splitoff method, the stock product would lose about $6,754 each month, so it should not be
sold. How did Donahue arrive at that final number, and what do you think of her analysis?
Should Tasty sell the stock?