SOLUTION
(25 min.) Methods of joint-cost allocation, ending inventory.
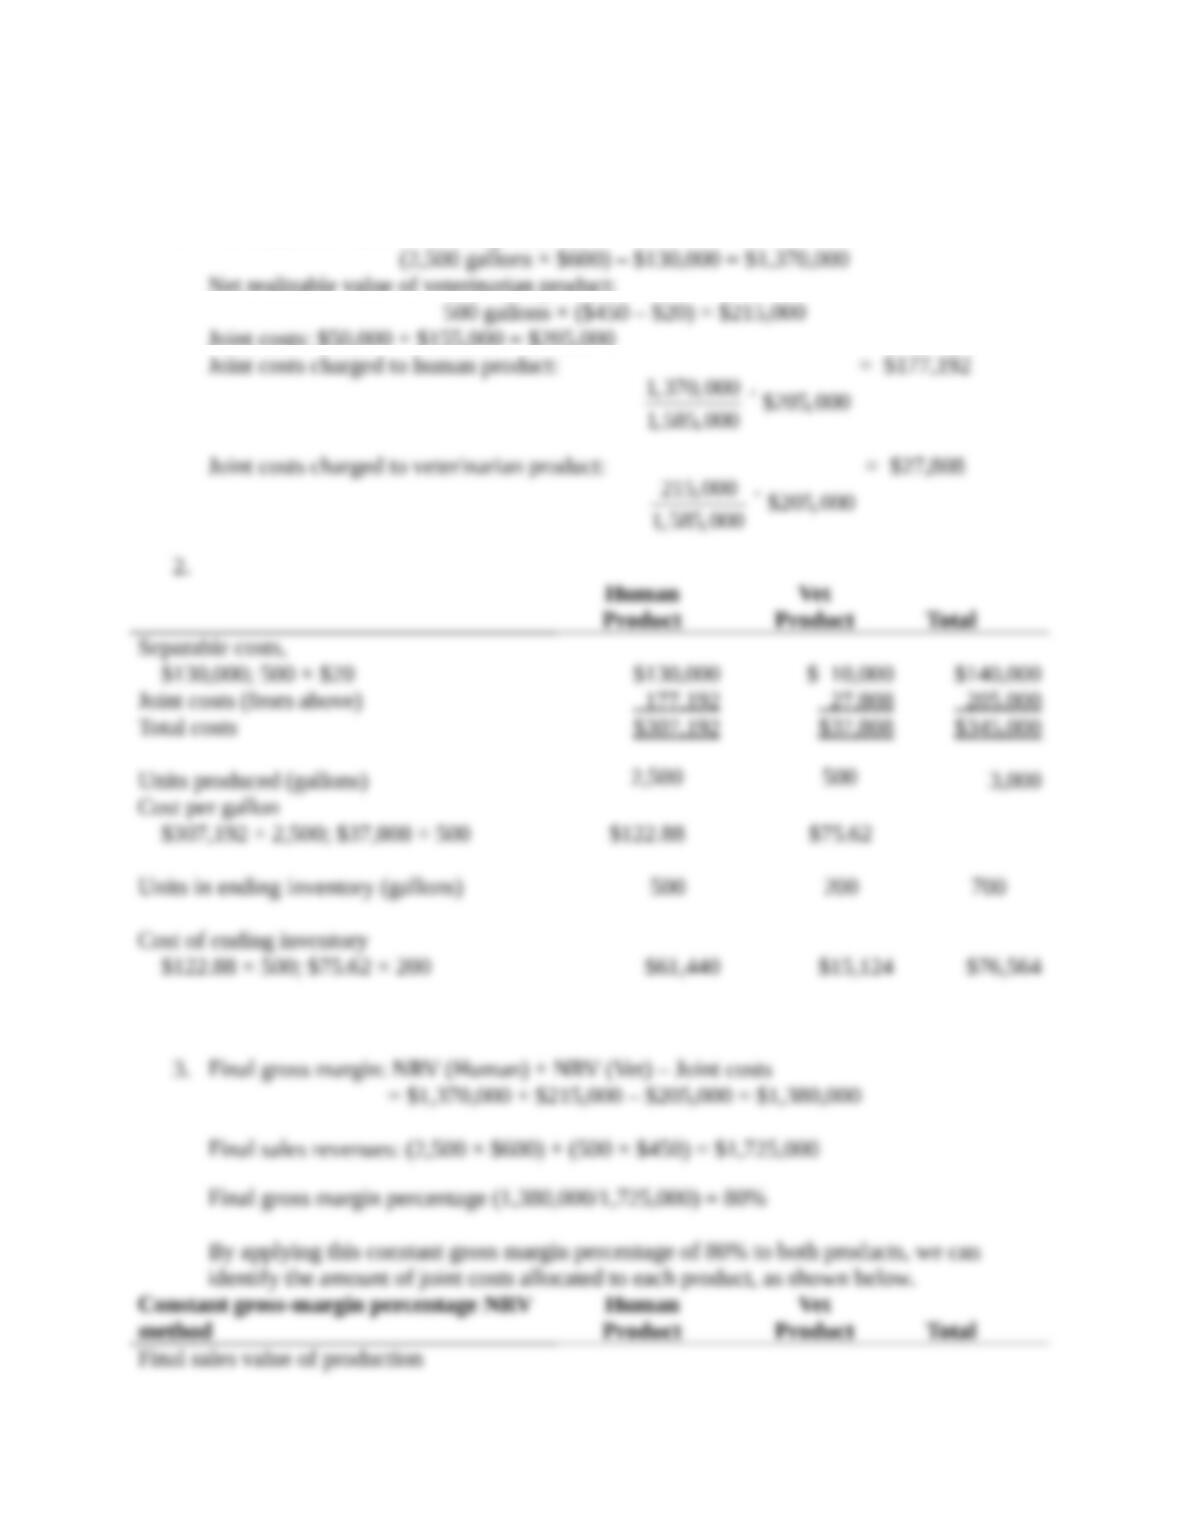
1. Net realizable value of human product:
Net realizable value of veterinarian product:
Joint costs: $50,000 + $155,000 = $205,000
Joint costs charged to human product:
1,370,000 $205,000
1,585,000 ´
= $177,192
Joint costs charged to veterinarian product:
215,000 $205,000
1,585, 000 ´
= $27,808
2.
Human
Product
Vet
Product Total
Separable costs,
$130,000; 500 × $20 $130,000 $ 10,000 $140,000
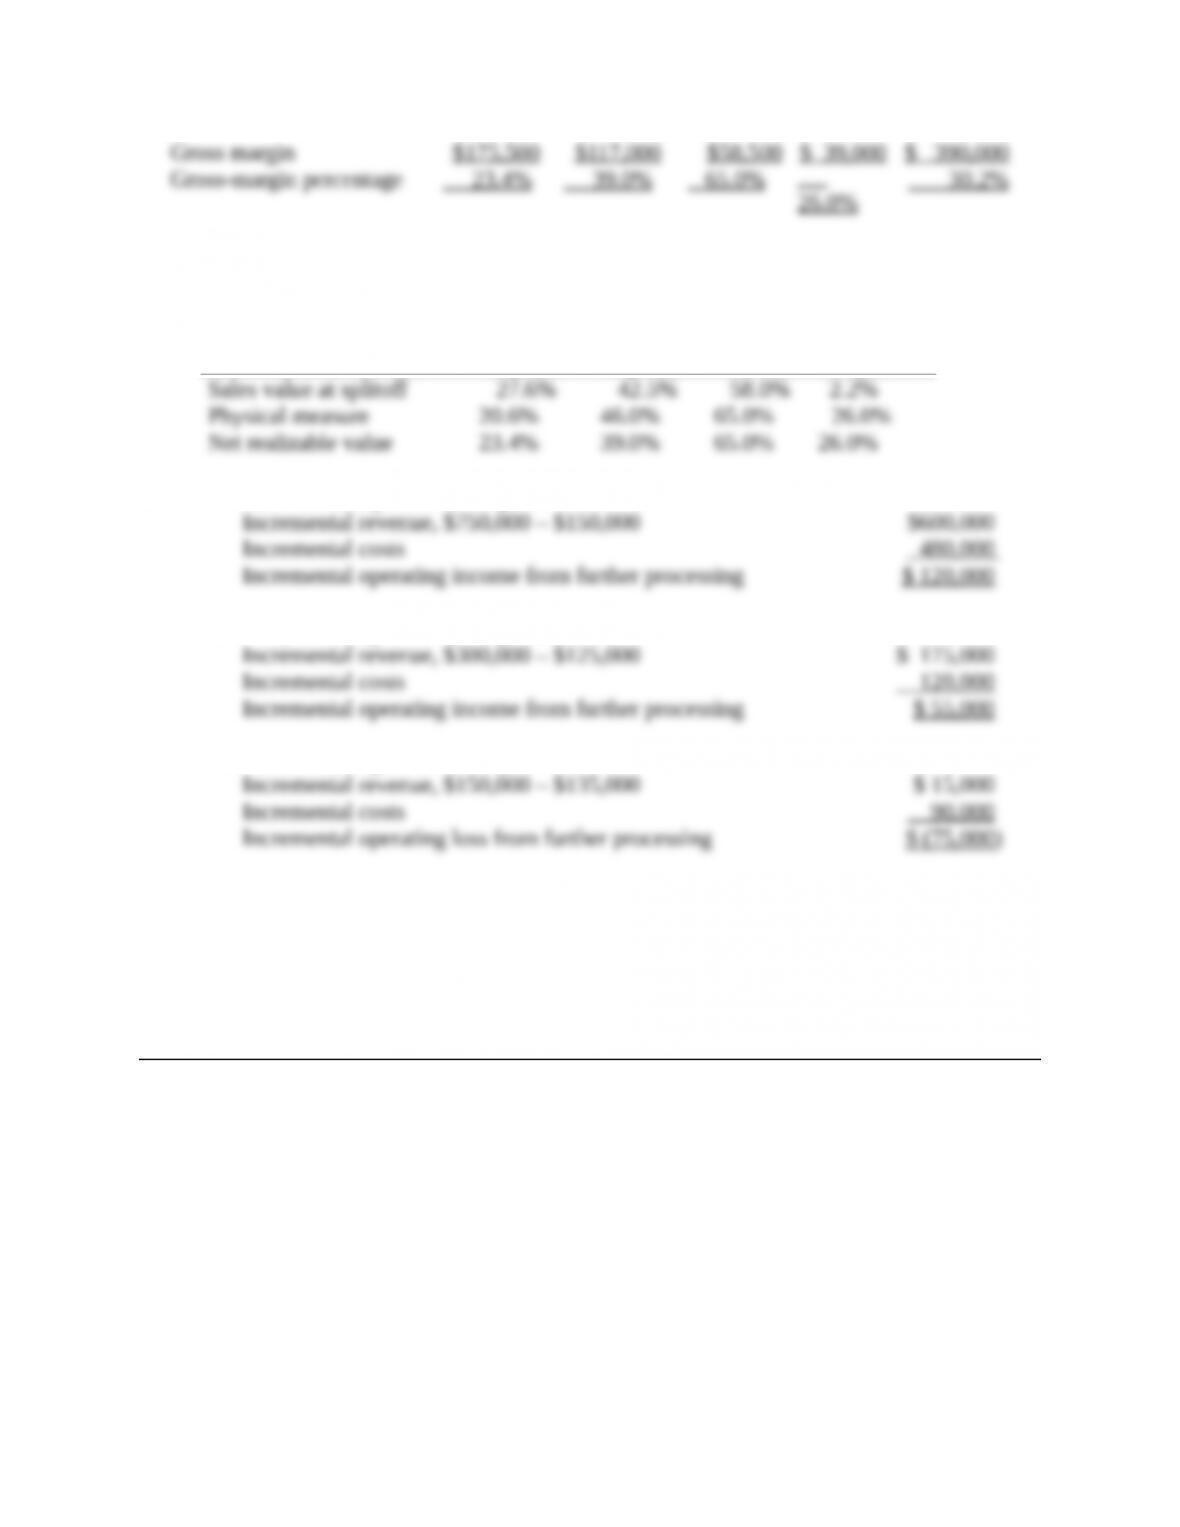
3. Final gross margin: NRV (Human) + NRV (Vet) – Joint costs
By applying this constant gross margin percentage of 80% to both products, we can
identify the amount of joint costs allocated to each product, as shown below.
Constant gross-margin percentage NRV
method
Human
Product
Vet
Product Total
Final sales value of production
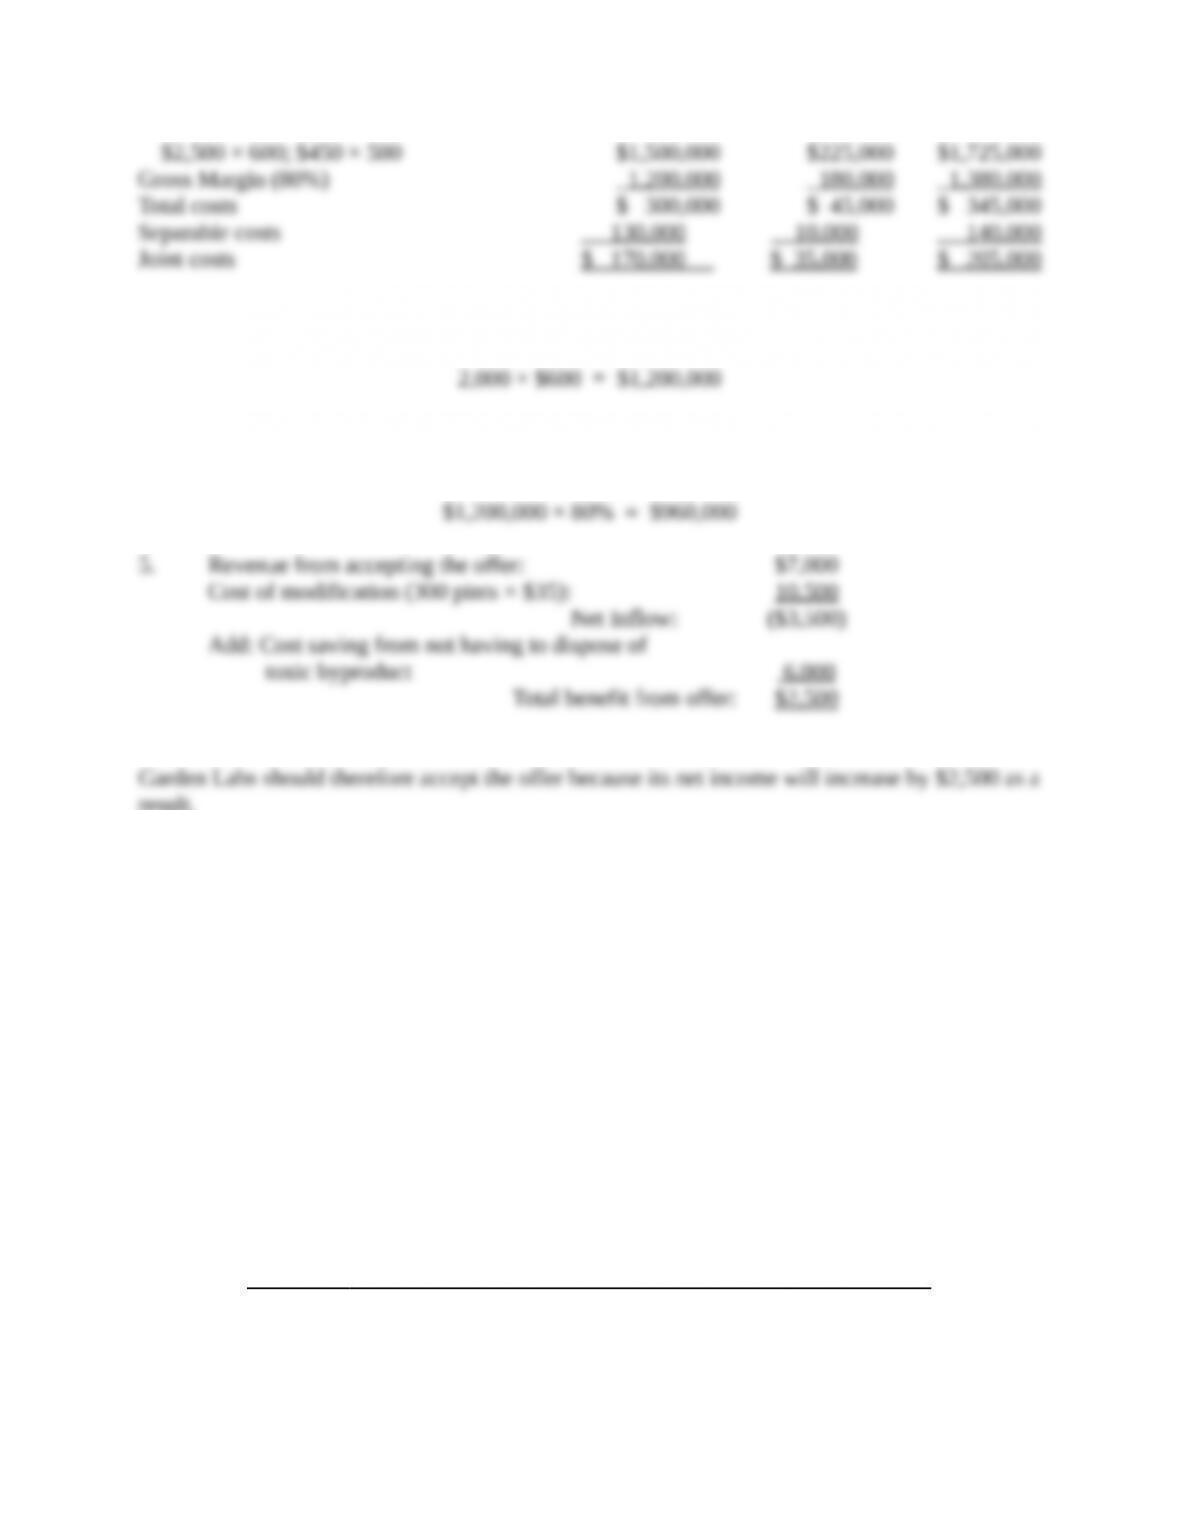
4. In March, Garden Labs sold 2,000 gallons for human use for a sales revenue of:
Under the constant gross-margin percentage NRV method, each product is provided a gross
margin of 80%. Therefore, the gross margin for the sale of human product in March is:
result.
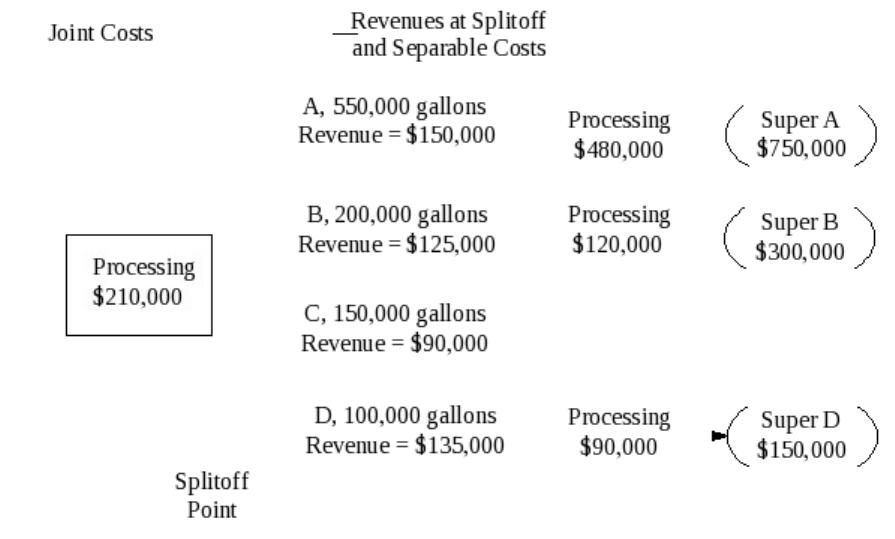
16-33 Alternative methods of joint-cost allocation, product-mix decisions. The Chicago Oil
Company buys crude vegetable oil. Refining this oil results in four products at the splitoff point:
A, B, C, and D. Product C is fully processed by the splitoff point. Products A, B, and D can
individually be further refined into Super A, Super B, and Super D. In the most recent month
(November), the output at the splitoff point was as follows:
■ Product A, 550,000 gallons
■ Product B, 200,000 gallons
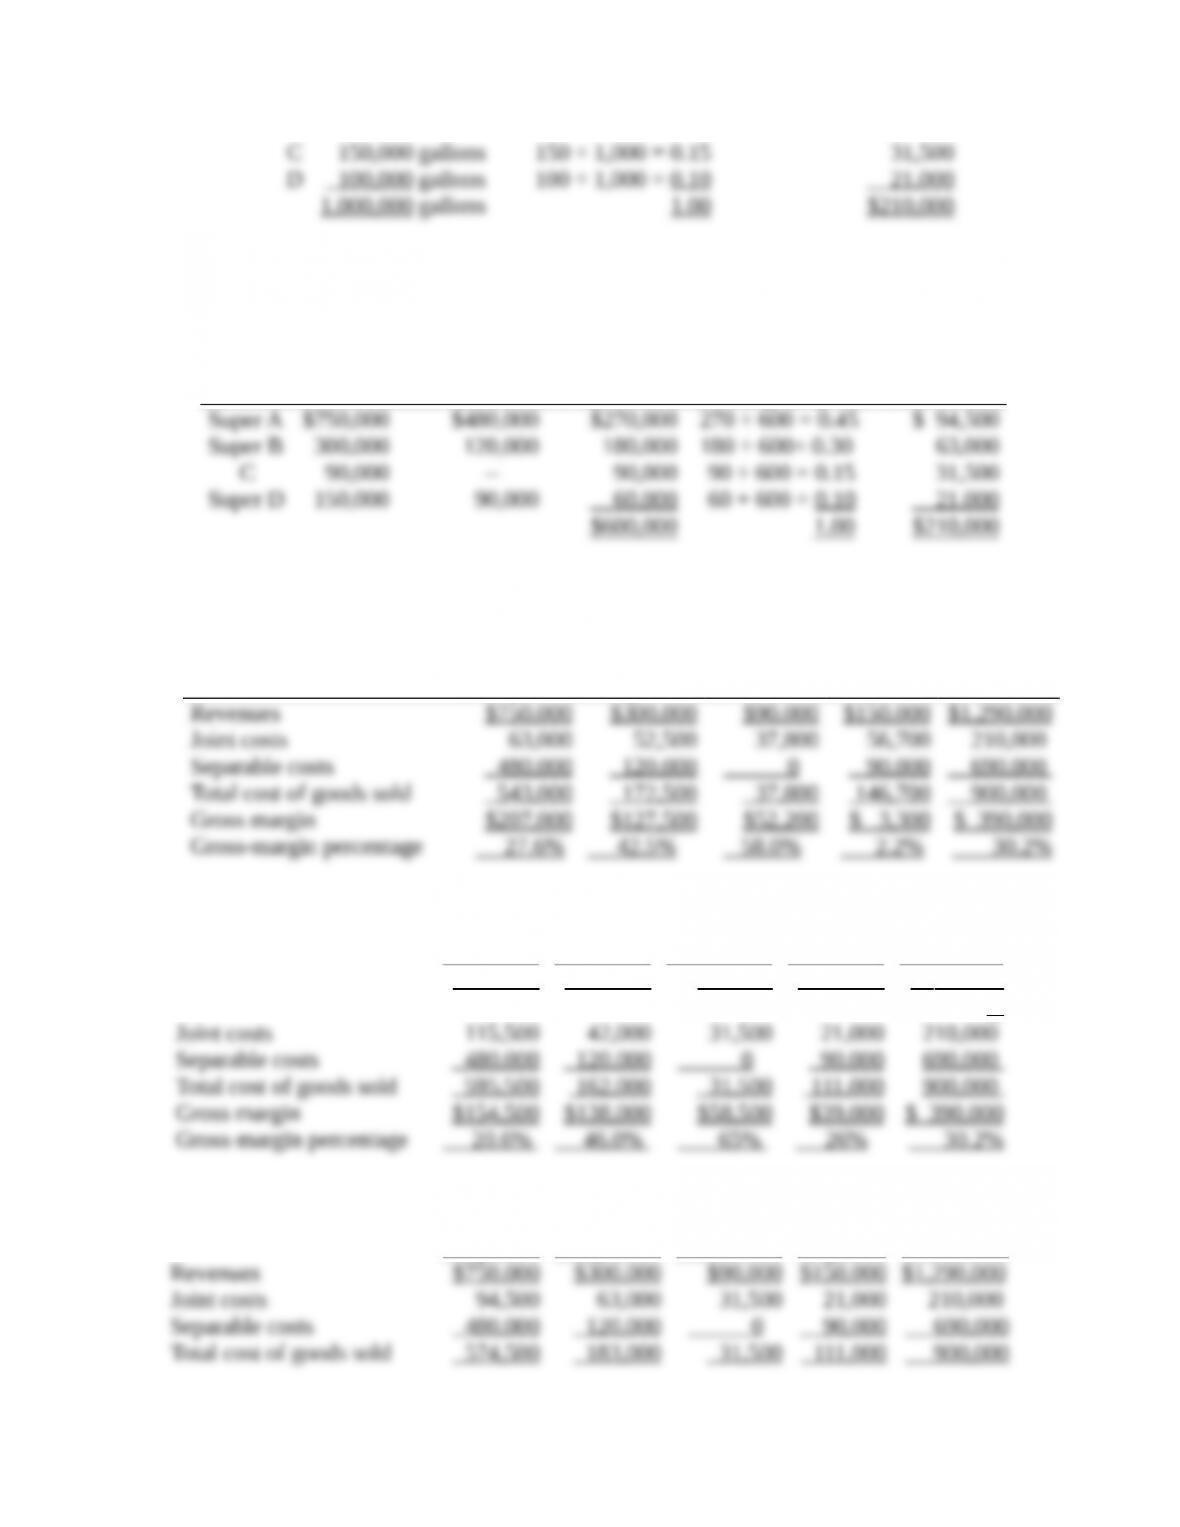
■ Product C, 150,000 gallons
■ Product D, 100,000 gallons
The joint costs of purchasing and processing the crude vegetable oil were $210,000. Chicago had
no beginning or ending inventories. Sales of product C in November were $90,000. Products A,
B, and D were further refined and then sold. Data related to November are as follows:
Separable Processing Costs to Make
Super Products
Revenues
Super A $480,000 $750,000
Super B 120,000 300,000
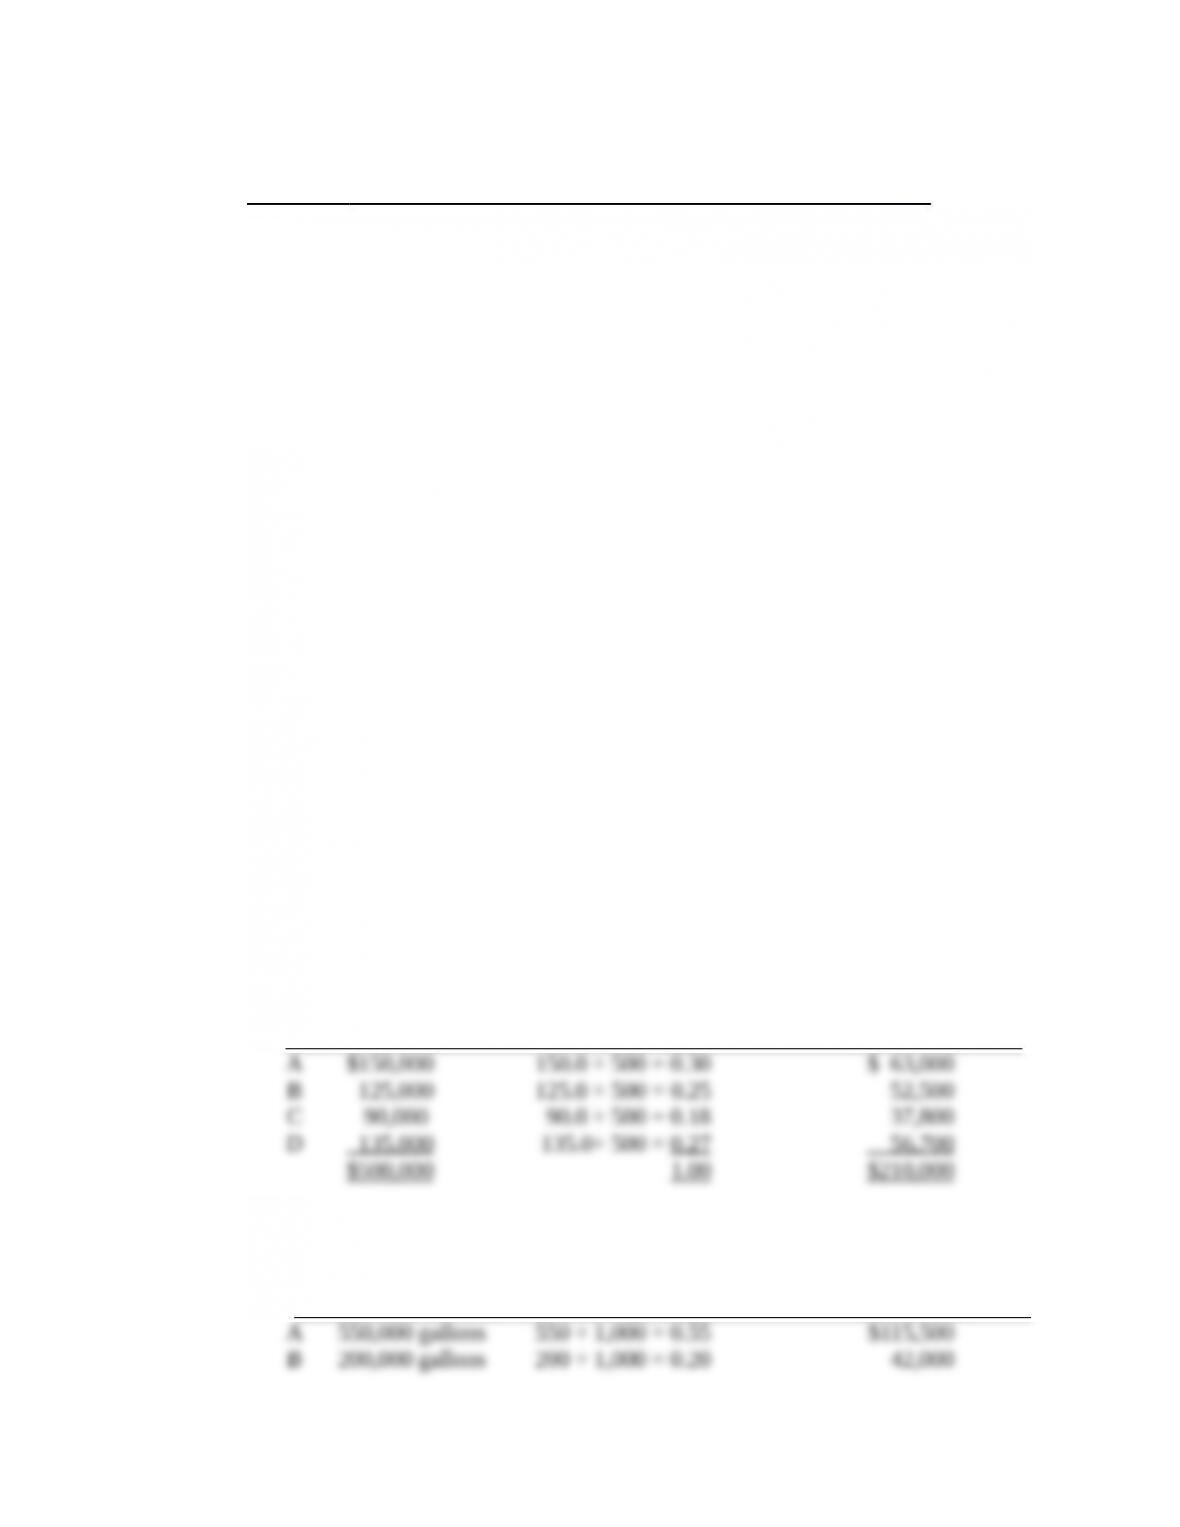
Separable Processing Costs to Make
Super Products
Revenues
Super D 90,000 150,000
Chicago had the option of selling products A, B, and D at the splitoff point. This alternative
would have yielded the following revenues for the November production:
■ Product A, $150,000
■ Product B, $125,000
■ Product D, $135,000
Required:
1. Compute the gross-margin percentage for each product sold in November, using the
following methods for allocating the $210,000 joint costs:
a. Sales value at splitoff
b. Physical measure
c. NRV
2. Could Chicago Oil have increased its November operating income by making different
decisions about the further processing of products A, B, or D? Show the effect on operating
income of any changes you recommend.
SOLUTION
(40 min.) Alternative methods of joint-cost allocation, product-mix decisions.
A diagram of the situation is in Solution Exhibit 16-33.
1. Computation of joint-cost allocation proportions:
a. Sales Value of
Total Production Allocation of $210,000
at Splitoff Weighting Joint Costs
b.
Physical Measure Allocation of $210,000
of Total Production Weighting Joint Costs
c.
Final Sales
Value of
Total
Production
Separable
Costs
Net
Realizable
Value at
Splitoff Weighting
Allocation
of
$210,000
Joint Costs
Computation of gross-margin percentages:
a. Sales value at splitoff method:
Super A Super B C Super D Total
b. Physical-measure method:
Super A Super B C Super D Total
Revenues $750 ,000 $300 ,000 $90 ,000 $150 ,000 $1 ,290,00
0
c. Net realizable value method:
Super A Super B C Super D Total
26.0%
Summary of gross-margin percentages:
Joint-Cost
Allocation Method Super A Super B C Super D
2. Further Processing of A into Super A:
Further processing of B into Super B:
Further Processing of D into Super D:
Chicago Oil Company is making the right decision by processing A and B further. However, the
company will increase its operating income by $75,000 if it sells D at the splitoff point rather
than refining it into Super D.
SOLUTION EXHIBIT 16-33
16-34 Comparison of alternative joint-cost-allocation methods, further-processing decision,
chocolate products. The Rich and Creamy Edibles Factory manufactures and distributes
chocolate products. It purchases cocoa beans and processes them into two intermediate products:
chocolate-powder liquor base and milk-chocolate liquor base. These two intermediate products
become separately identifiable at a single splitoff point. Every 600 pounds of cocoa beans yields
20 gallons of chocolate-powder liquor base and 60 gallons of milk-chocolate liquor base.
The chocolate-powder liquor base is further processed into chocolate powder. Every 20
gallons of chocolate-powder liquor base yield 680 pounds of chocolate powder. The
milk-chocolate liquor base is further processed into milk chocolate. Every 60 gallons of
milk-chocolate liquor base yield 1,100 pounds of milk chocolate.
Production and sales data for August 2017 are as follows (assume no beginning inventory):
■Cocoa beans processed, 27,600 pounds
■Costs of processing cocoa beans to splitoff point (including purchase of beans), $70,000
Production Sales Selling Price Separable
Processing Costs
Chocolate
powder
31,280 pounds 6,800 pounds $8 per pound $46,035
Milk chocolate 50,600 pounds 14,400 pounds $9 per pound $55,085
Rich and Creamy Edibles Factory fully processes both of its intermediate products into chocolate
powder or milk chocolate. There is an active market for these intermediate products. In August
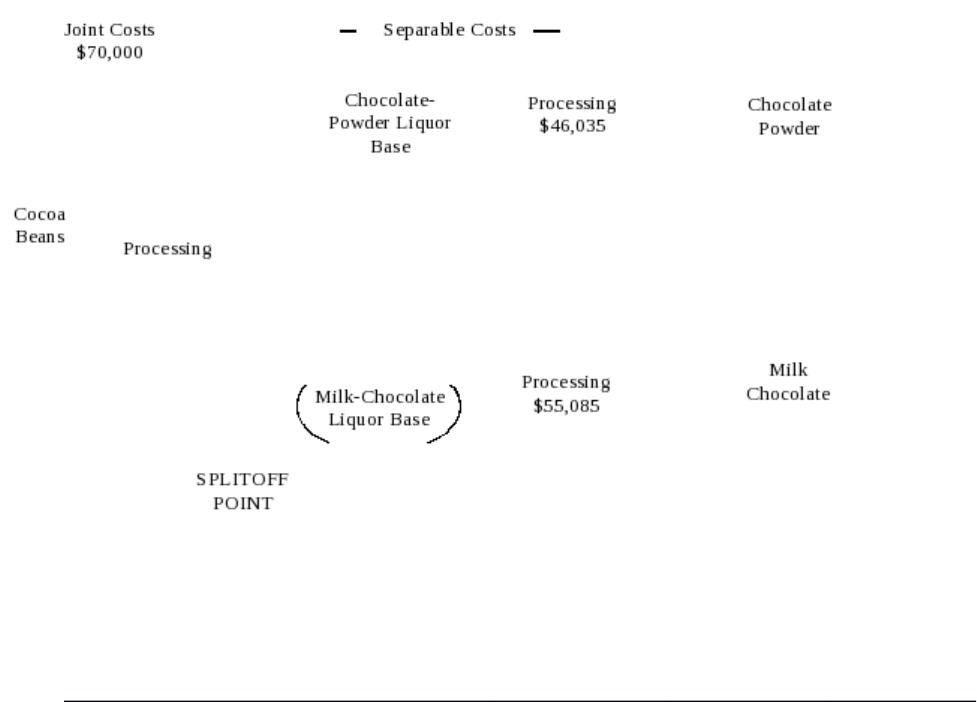
2017, Rich and Creamy Edibles Factory could have sold the chocolate-powder liquor base for $21
a gallon and the milk-chocolate liquor base for $28 a gallon.
Required:
1. Calculate how the joint costs of $70,000 would be allocated between chocolate powder and
milk chocolate under the following methods:
a. Sales value at splitoff
b. Physical measure (gallons)
c. NRV
d. Constant gross-margin percentage NRV
2. What are the gross-margin percentages of chocolate powder and milk chocolate under each
of the methods in requirement 1?
3. Could Rich and Creamy Edibles Factory have increased its operating income by a change in
its decision to fully process both of its intermediate products? Show your computations.
SOLUTION
(40–60 min.) Comparison of alternative joint-cost allocation methods, further-processing
decision, chocolate products.
1a. Sales value at splitoff method:
Chocolate-
Powder/
Liquor Base
Milk-
Chocolate/
Liquor Base
Total
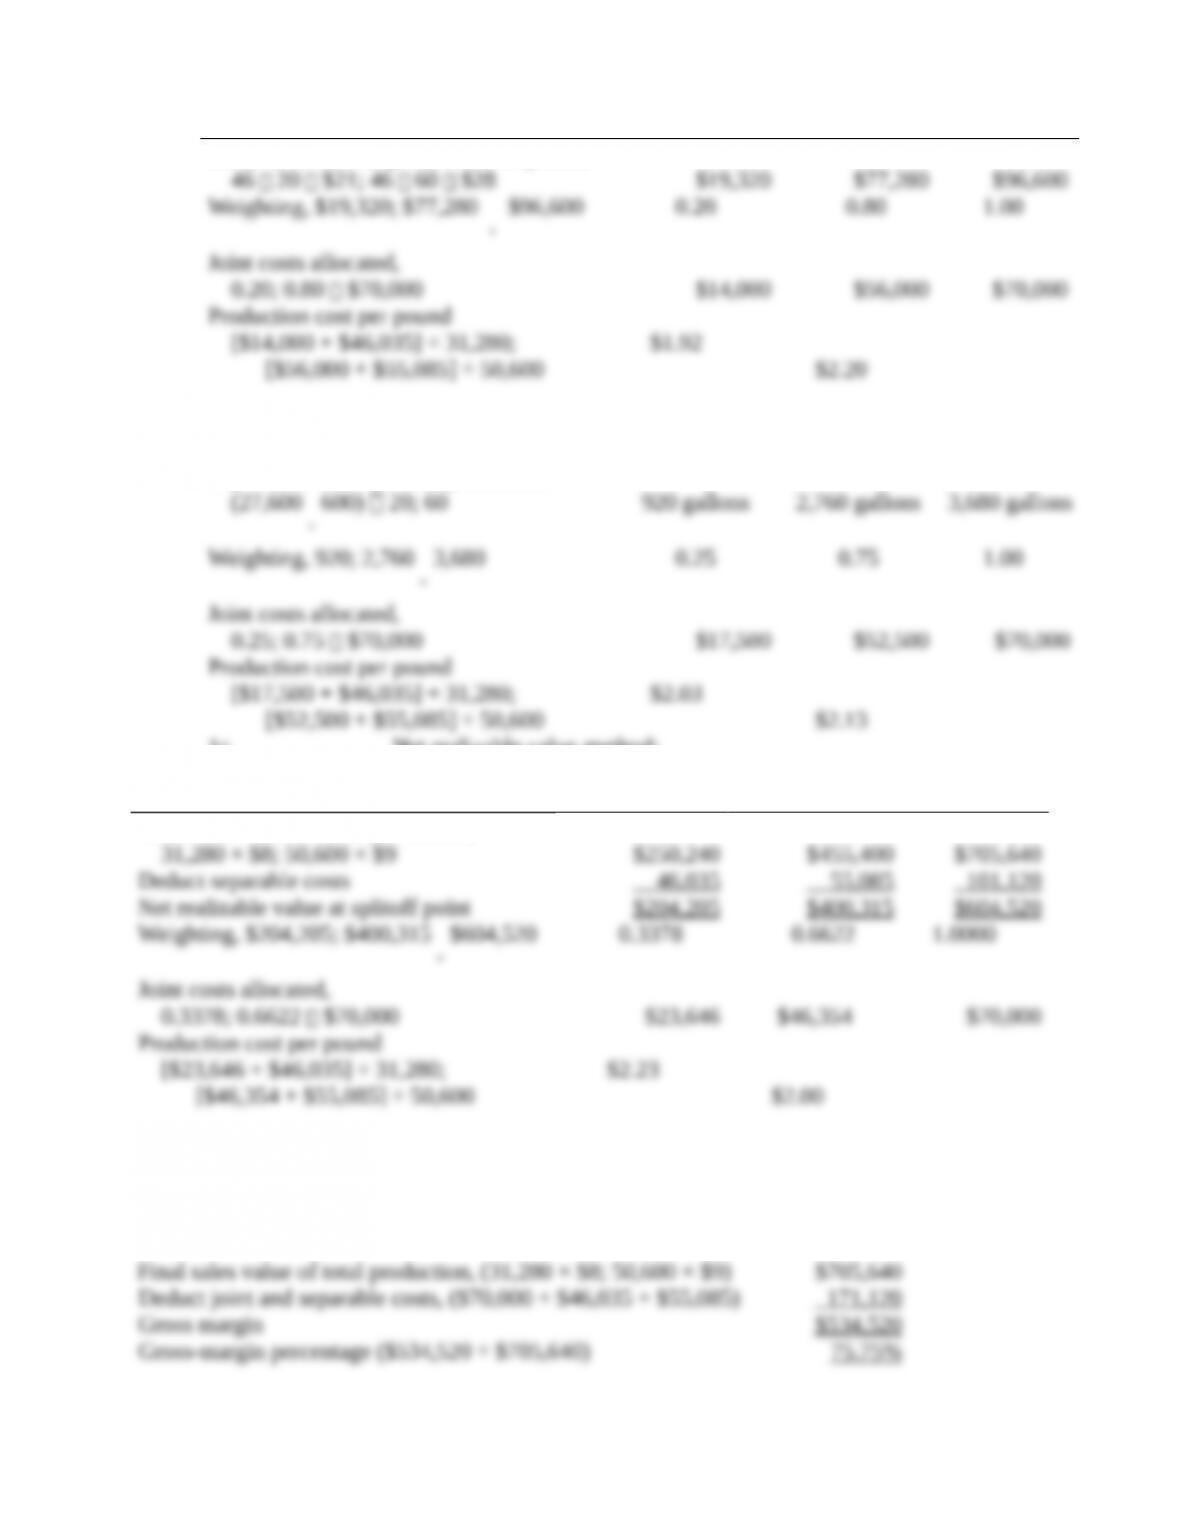
Sales value of total production at splitoff,
1b.
Physical-measure method:
Physical measure of total production
1c. Net realizable value method:
Chocolate
Powder
Milk
Chocolate Total
Final sales value of total production,
1d. Constant gross-margin percentage NRV method:
Step 1:
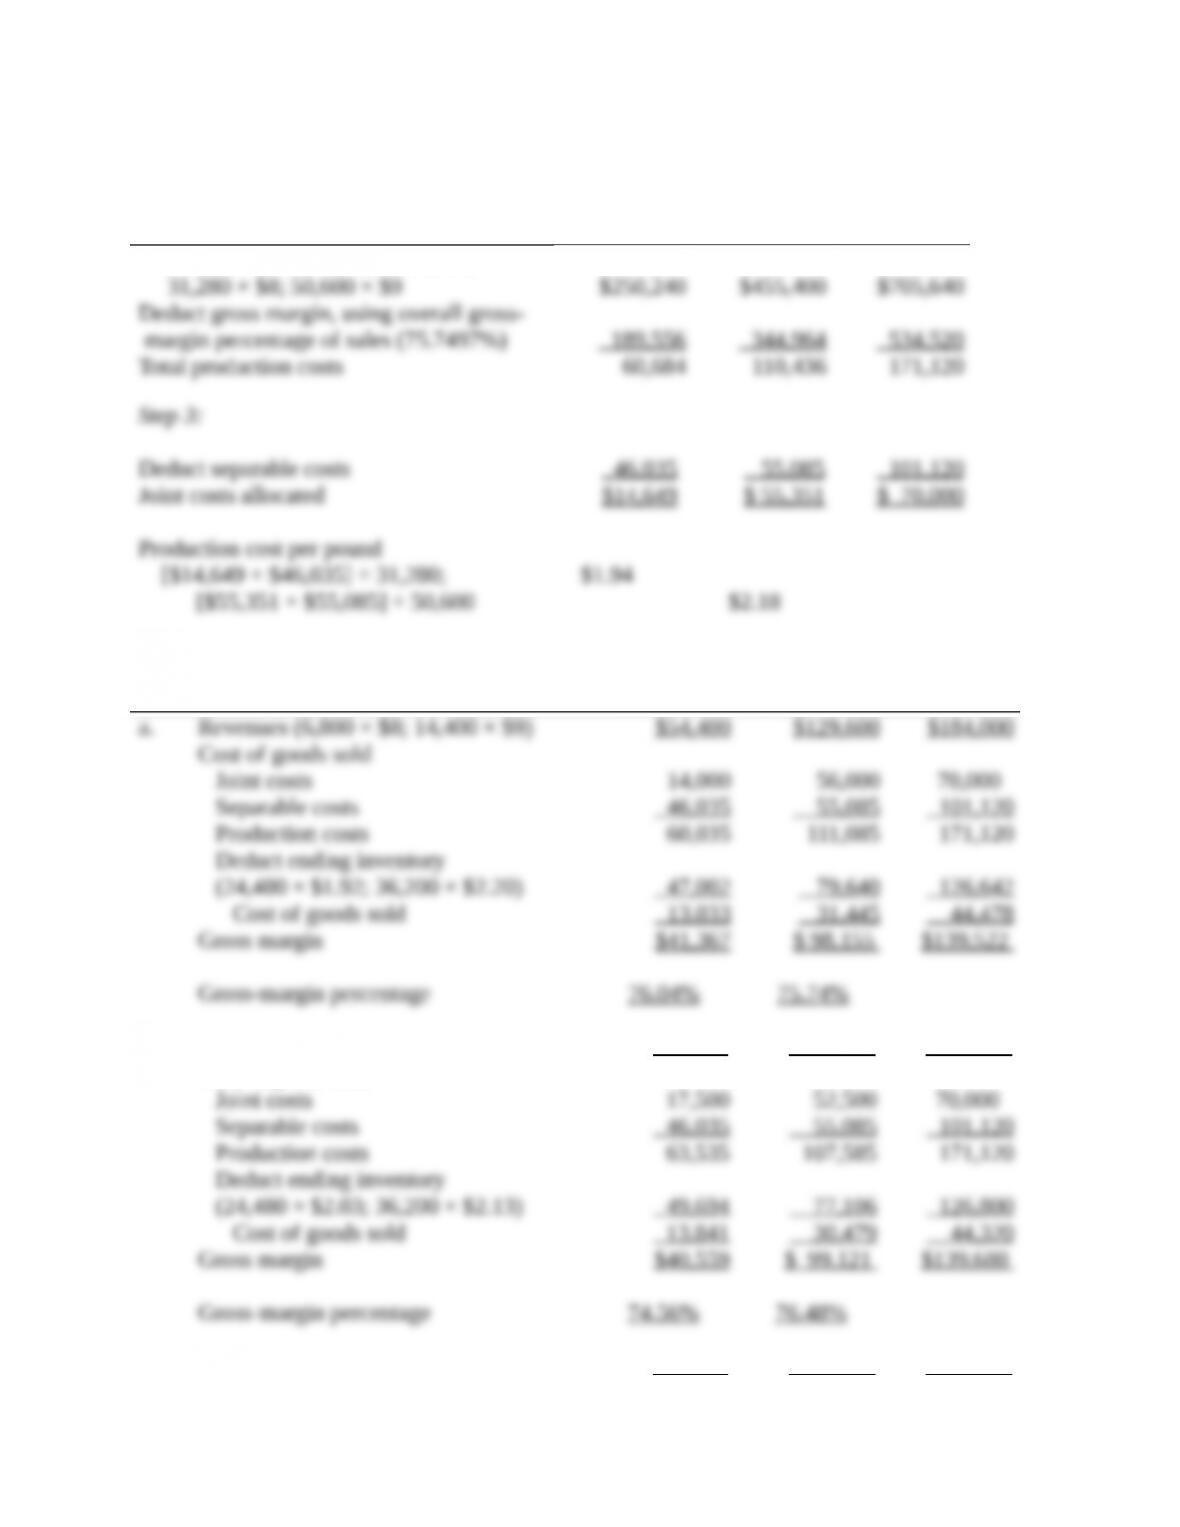
Step 2:
Chocolate Milk
Powder Chocolate Total
Final sales value of total production,
2. Chocolate Milk
Powder Chocolate Total
b. Revenues $ 54 ,400 $ 129 ,600 $ 184 ,000
Cost of goods sold
c. Revenues $ 54 ,400 $ 129 ,600 $ 184 ,000
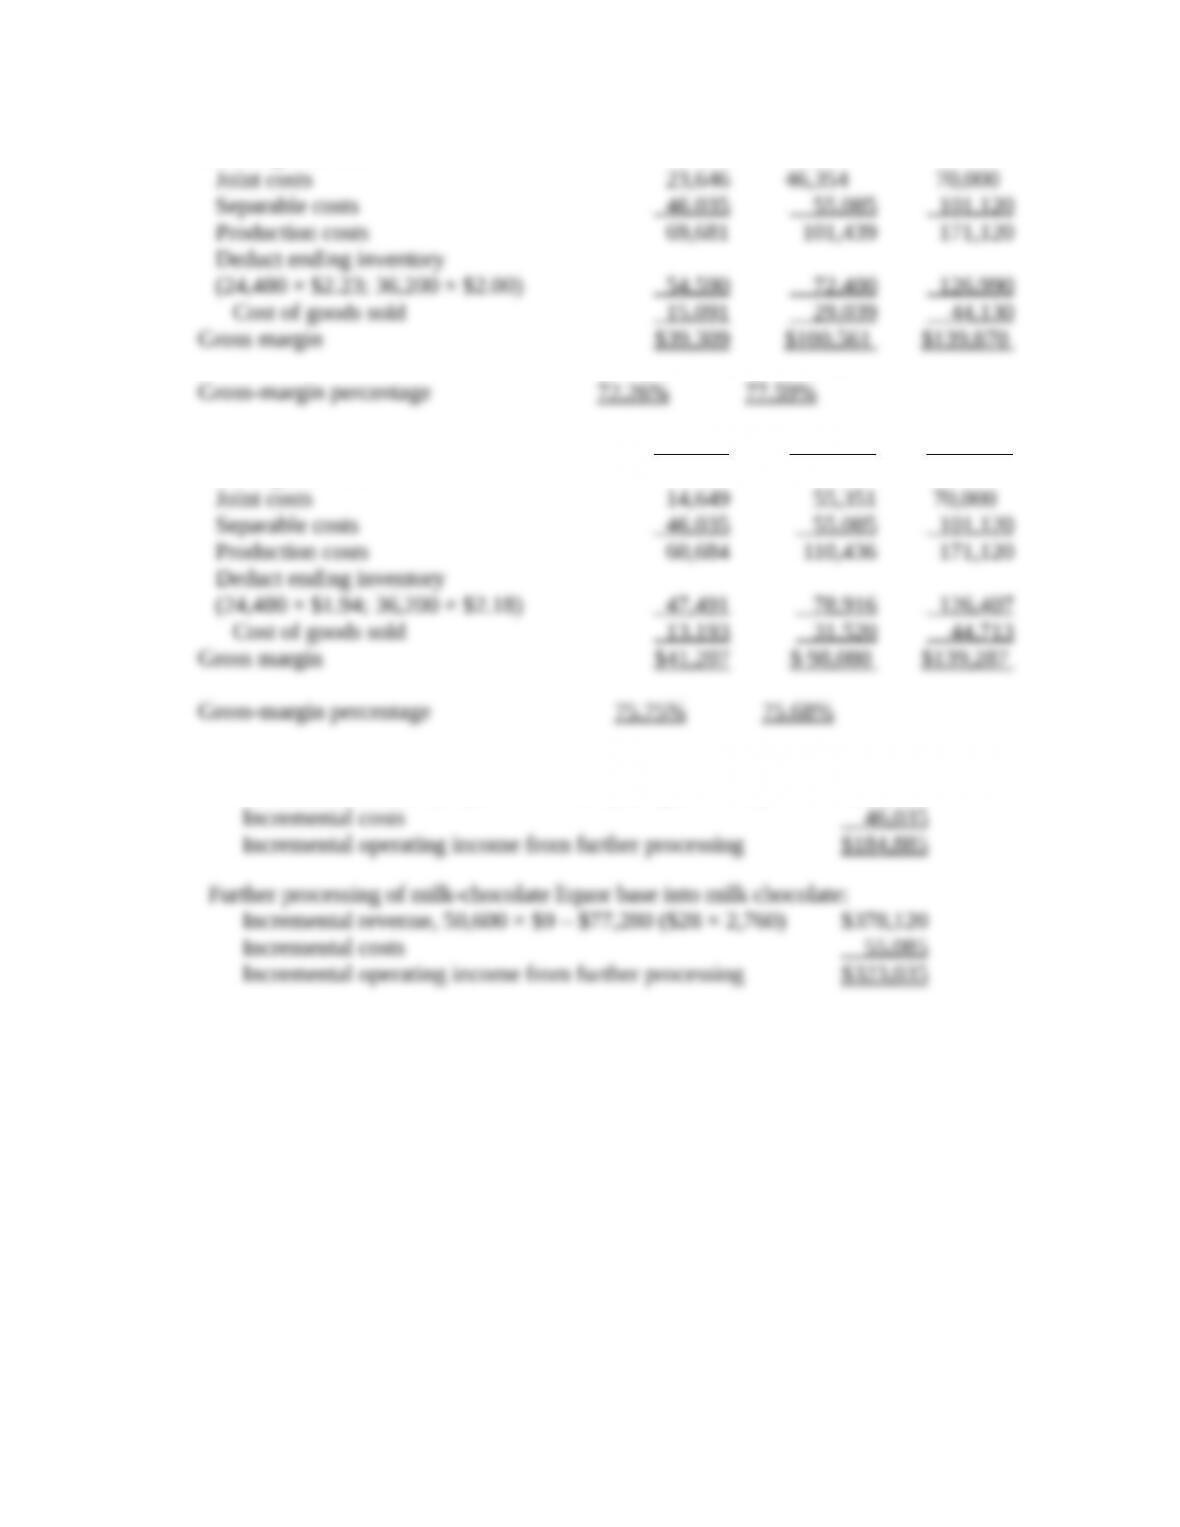
Cost of goods sold
d. Revenues $ 54 ,400 $ 129 ,600 $ 184 ,000
Cost of goods sold
3. Further processing of chocolate-powder liquor base into chocolate powder:
Incremental revenue, 31,280 × $8 – $19,320 ($21 × 920) $230,920
Chocolate Factory should continue to process milk-chocolate liquor base into milk chocolate,
and chocolate-powder liquor base into chocolate powder.
16-35 Joint-cost allocation, process further or sell. (CMA, adapted) Liverpool Sawmill, Inc.
(LSI) purchases logs from independent timber contractors and processes the logs into three types
of lumber products:
■ Studs for residential buildings (walls, ceilings)
■ Decorative pieces (fireplace mantels, beams for cathedral ceilings)
■ Posts used as support braces (mine support braces, braces for exterior fences on ranch
properties)
These products are the result of a joint sawmill process that involves removal of bark from the
logs, cutting the logs into a workable size (ranging from 8 to 16 feet in length), and then cutting
the individual products from the logs.
The joint process results in the following costs of products for a typical month:
Direct materials (rough timber logs) $ 480,000
Debarking (labor and overhead) 50,000
Sizing (labor and overhead) 220,000
Product cutting (labor and overhead) 260,000
Total joint costs $1,010,000
Product yields and average sales values on a per-unit basis from the joint process are as follows:
Product Monthly Output of Materials at Splitoff
Point
Fully Processed Selling
Price
Studs 78,000 units $ 5
Decorative pieces 4,000 units 85
Posts 28,000 units 26
The studs are sold as rough-cut lumber after emerging from the sawmill operation without
further processing by LSI. Also, the posts require no further processing beyond the splitoff point.
The decorative pieces must be planed and further sized after emerging from the sawmill. This
additional processing costs $90,000 per month and normally results in a loss of 10% of the units
entering the process. Without this planing and sizing process, there is still an active intermediate
market for the unfinished decorative pieces in which the selling price averages $55 per unit.
Required:
1. Based on the information given for Liverpool Sawmill, allocate the joint processing costs of
$1,010,000 to the three products using:
a. Sales value at splitoff method
b. Physical-measure method (volume in units)
c. NRV method
2. Prepare an analysis for Liverpool Sawmill that compares processing the decorative pieces
further, as it currently does, with selling them as a rough-cut product immediately at splitoff.
3. Assume Liverpool Sawmill announced that in six months it will sell the unfinished
decorative pieces at splitoff due to increasing competitive pressure. Identify at least three
types of likely behavior that will be demonstrated by the skilled labor in the
planing-and-sizing process as a result of this announcement. Include in your discussion how
this behavior could be influenced by management.