SOLUTION
(20 min.)Market-share and market-size variances (continuation of 14-27).
In some editions of the text, the last sentence before “Required” reads “However, actual total sales volume in the western region was 1.5 million
cartons.” The word “western” should be replaced by “Midwest.”
Actual Budgeted
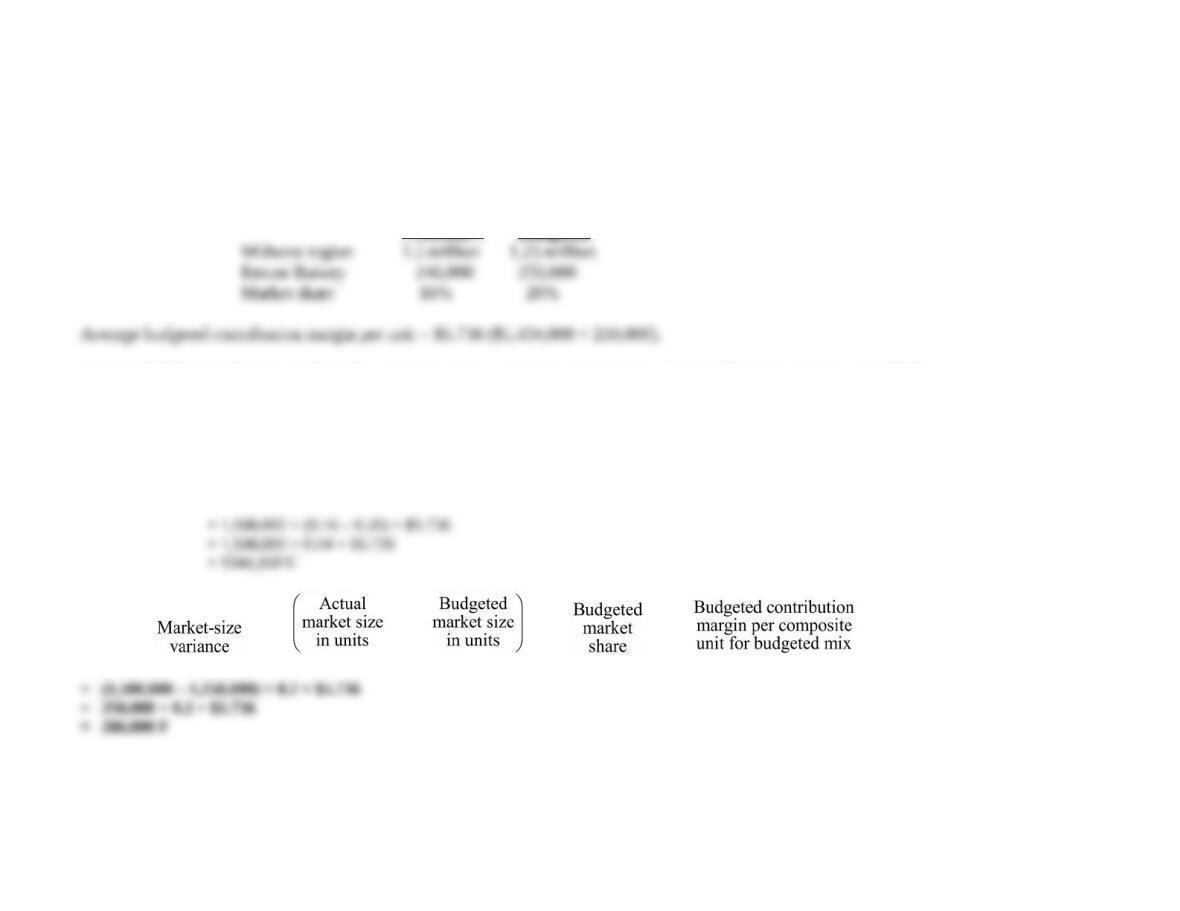
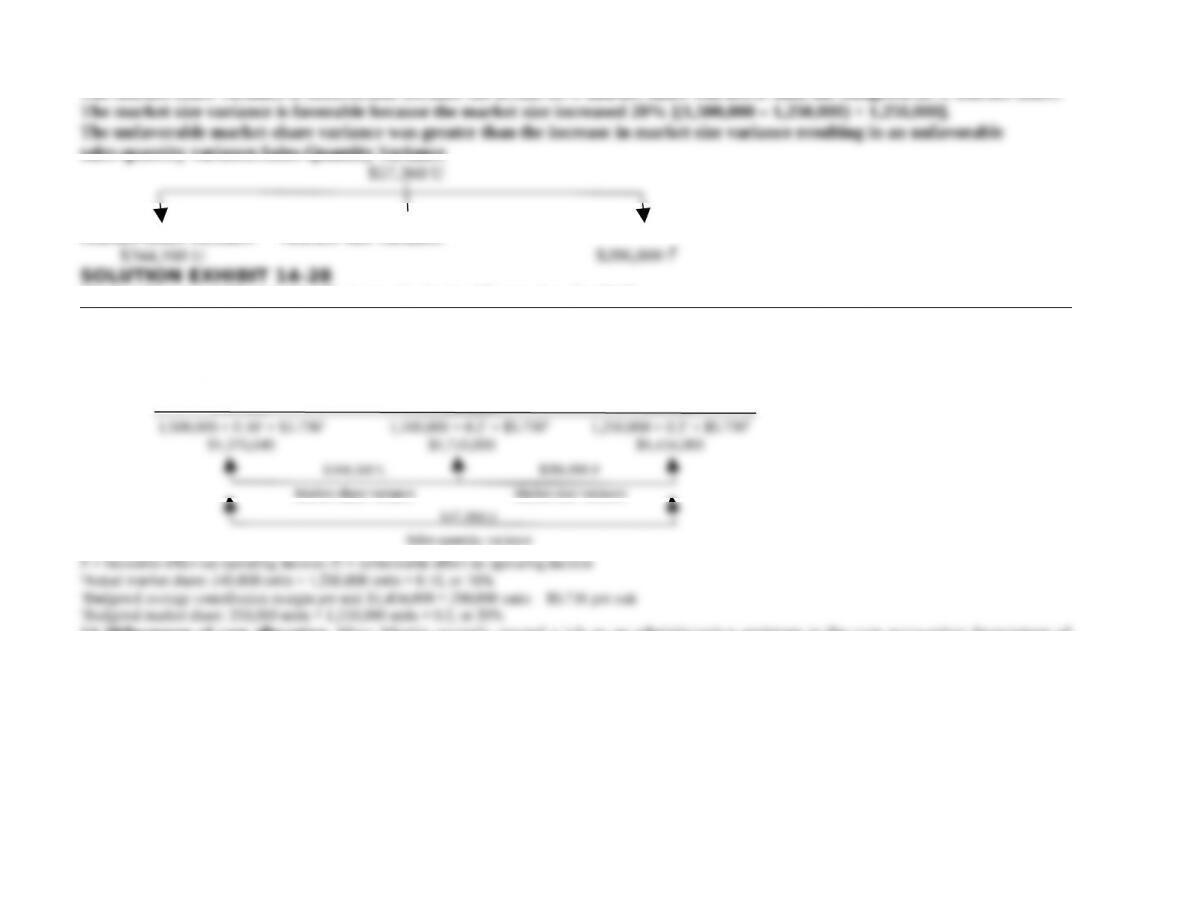
Solution Exhibit 14-28 presents the sales-quantity variance, market-size variance, and market-share variance for 2017.
Market share
variance
=
Actual market
size in units
´
Actual
market
share
æ
ç
ç
è
–
Budgeted
market
share
ö
÷
÷
ø
´
Budgeted contribution
margin per composite
unit for budgeted mix
= – × ×
The market share variance is unfavorable because the actual 16% market share was lower than the budgeted 20% market share.
sales-quantity variance.Sales-Quantity Variance
Market-share variance Market-size variance
SOLUTION EXHIBIT 14-28
Market-Share and Market-Size Variance Analysis of Emcee Inc. for 2017
Static Budget:
Actual Market Size Actual Market Size Budgeted Market Size
× Actual Market Share × Budgeted Market Share × Budgeted Market Share
× Budgeted Average × Budgeted Average × Budgeted Average
Contribution Margin Contribution Margin Contribution Margin
Per Unit Per Unit Per Unit
Market-share variance Market-size variance
Sales-quantity variance
F = favorable effect on operating income; U = unfavorable effect on operating income
14-29Purposes of cost allocation. Mary Martin recently started a job as an administrative assistant in the cost accounting department of
Needham Manufacturing. New to the area of cost accounting, Mary is puzzled by the fact that one of Needham’s manufactured products,
SR670, has a different cost depending on who asks for it. When the marketing department requested the cost of SR670 in order to
determine pricing for the new catalog, Mary was told to report one amount, but when a request came in the very next day from the
financial-reporting department for the cost of SR670, she was told to report a very different cost. Mary runs a report using Needham’s cost
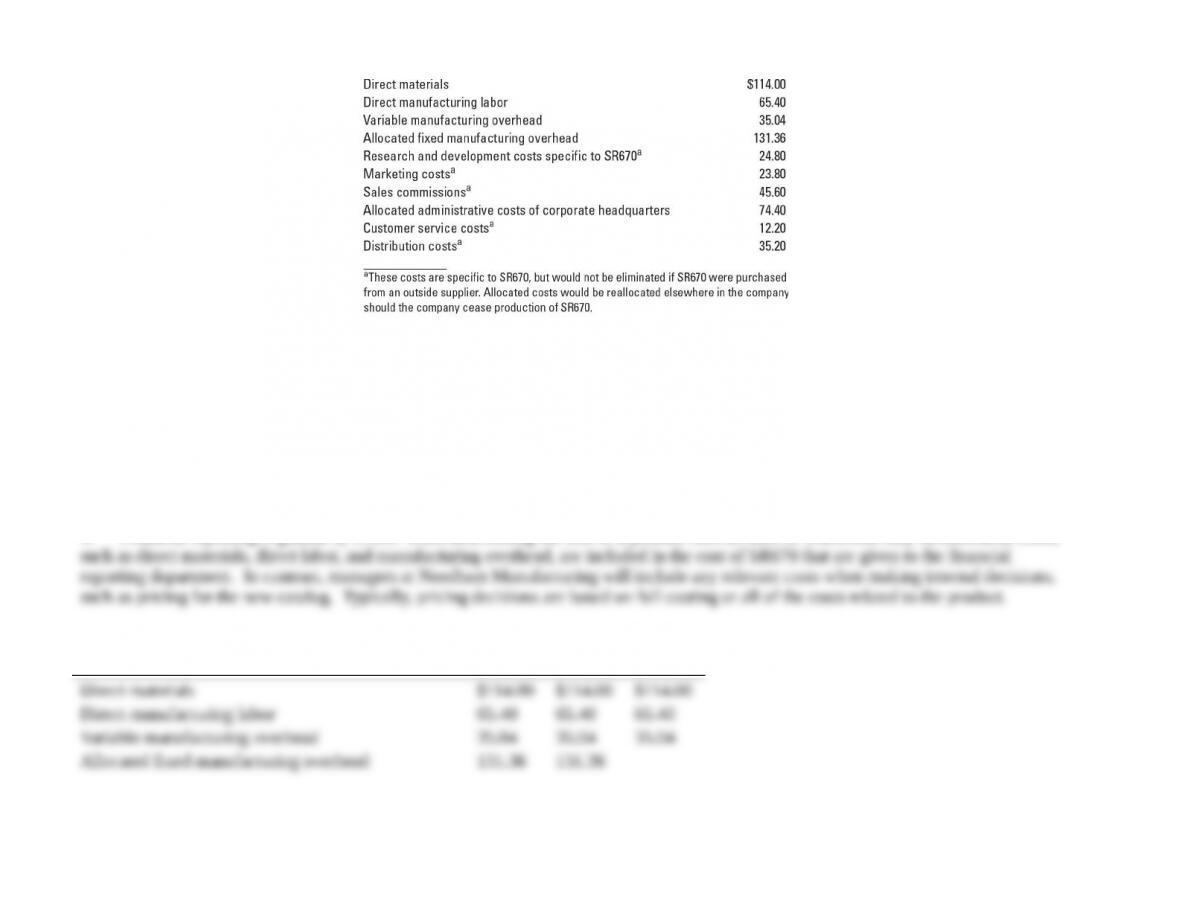
accounting system, which produces the following cost elements for one unit of SR670:
Required:
1. Explain to Mary why the cost given to the marketing and financial-reporting departments would be different.
2. Calculate the cost of one unit of SR670 to determine the following:
a. The selling price of SR670
b. The cost of inventory for financial reporting
c. Whether to continue manufacturing SR670 or to purchase it from an outside source (Assume that SR670 is used as a component in
one of Needham’s other products.)
SOLUTION
(30 min.) Purposes of cost allocation
1. Financial reporting is guided by GAAP when determining the cost of a product such as SR670. Therefore, only inventoriable costs,
2. For the four different purposes considered in the question, the cost of one unit of SR670 would be determined as follows:
a. b. c.
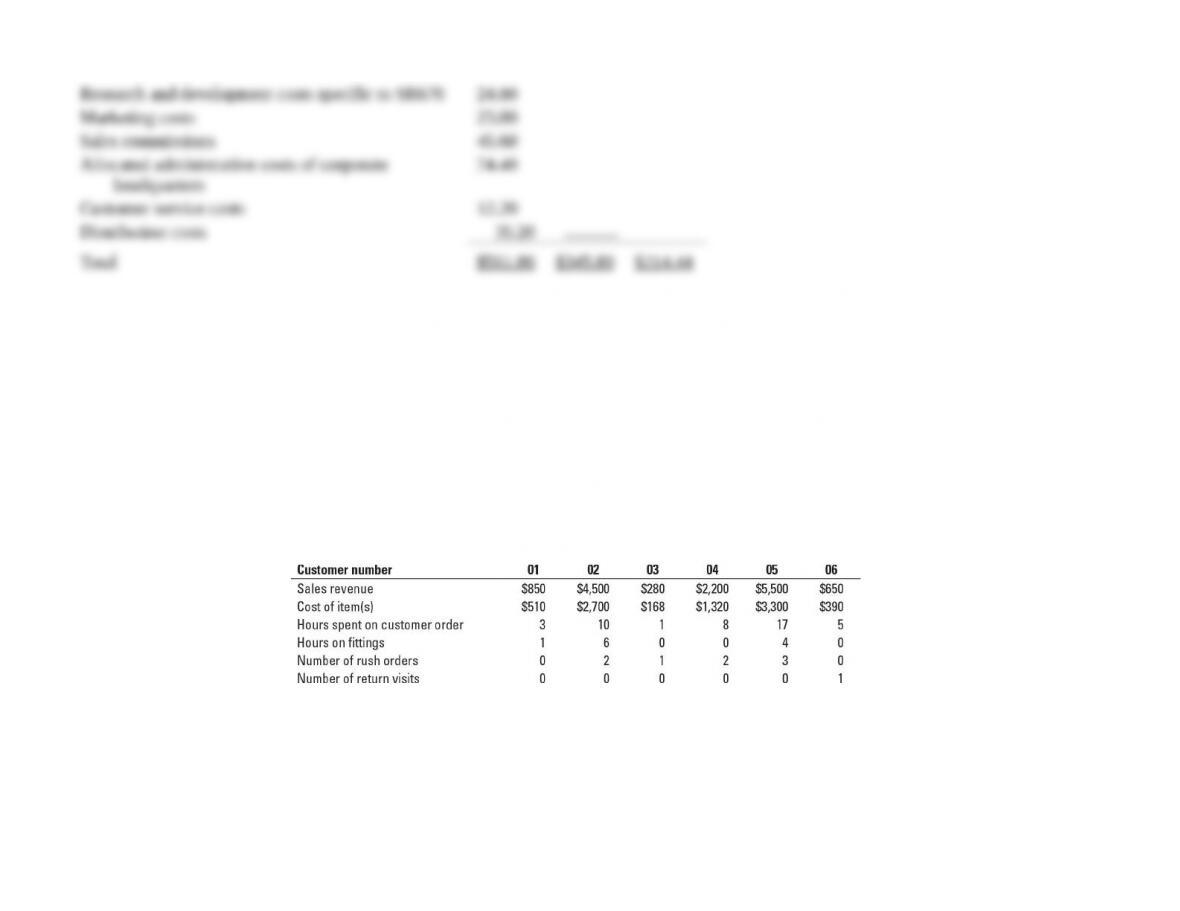
14-30 Customer profitability. Bracelet Delights is a new company that manufactures custom jewelry. Bracelet Delights currently has six
customers referenced by customer number: 01, 02, 03, 04, 05, and 06. Besides the costs of making the jewelry, the company has the
following activities:
1. Customer orders. The salespeople, designers, and jewelry makers spend time with the customer. The cost-driver rate is $42 per hour
spent with a customer.
2. Customer fittings. Before the jewelry piece is completed, the customer may come in to make sure it looks right and fits properly.
Cost-driver rate is $30 per hour.
3. Rush orders. Some customers want their jewelry quickly. The cost-driver rate is $90 per rush order.
4. Number of customer return visits. Customers may return jewelry up to 30 days after the pickup of the jewelry to have something
refitted or repaired at no charge. The cost-driver rate is $40 per return visit.
Information about the six customers follows. Some customers purchased multiple items. The cost of the jewelry is 60% of the selling
price.
Required:
1. Calculate the customer-level operating income for each customer. Rank the customers in order of most to least profitable and prepare a
customer-profitability analysis, as in Exhibits 14-3 and 14-4.
2. Are any customers unprofitable? What is causing this? What should Bracelet Delights do about these customers?
SOLUTION
(25 min.) Customer-profitability.
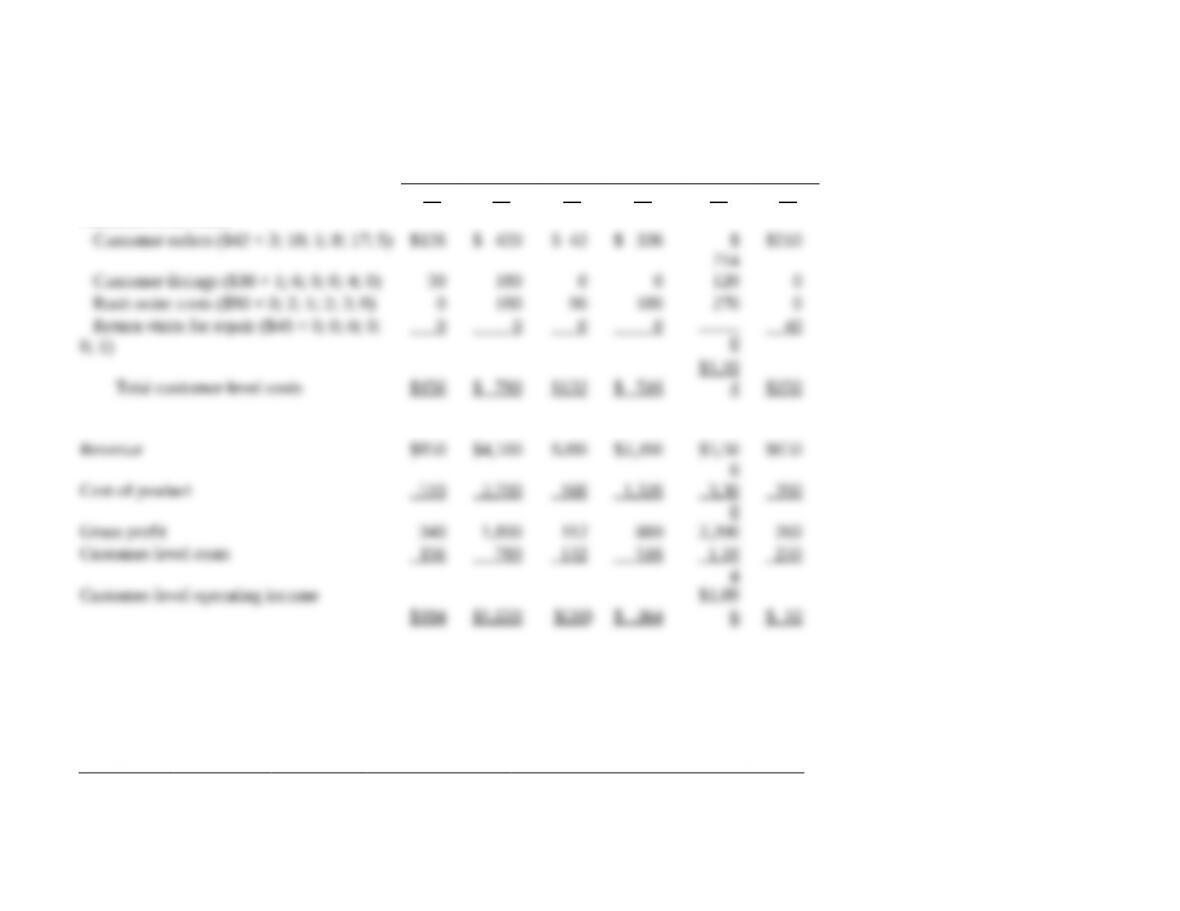
1.
Customer
01 02 03 04 05 06
Customer-level costs
The table indicates there are profitable and unprofitable customers. The ranking of customers from most to least profitable is:
Customer
Number
Customer-
Level
Operating
Income
(1)
Customer
Revenue
(2)
Customer-Level
Operating
Income
Divided by
Revenue
Cumulative
Customer-
Level
Operating
Income
Cumulative
Customer-Level
Operating Income
as a % of Total
Customer Income
(3) = (1) ÷ (2) (4) (5) = (4) ÷ $2,654
2. Customer 03 is unprofitable and of the rest, customer 06 has the lowest operating income and operating income as a percentage of
revenue. Customer 3 is unprofitable because it has very low revenues and requires a rush order. Customer 6 has a low operating income
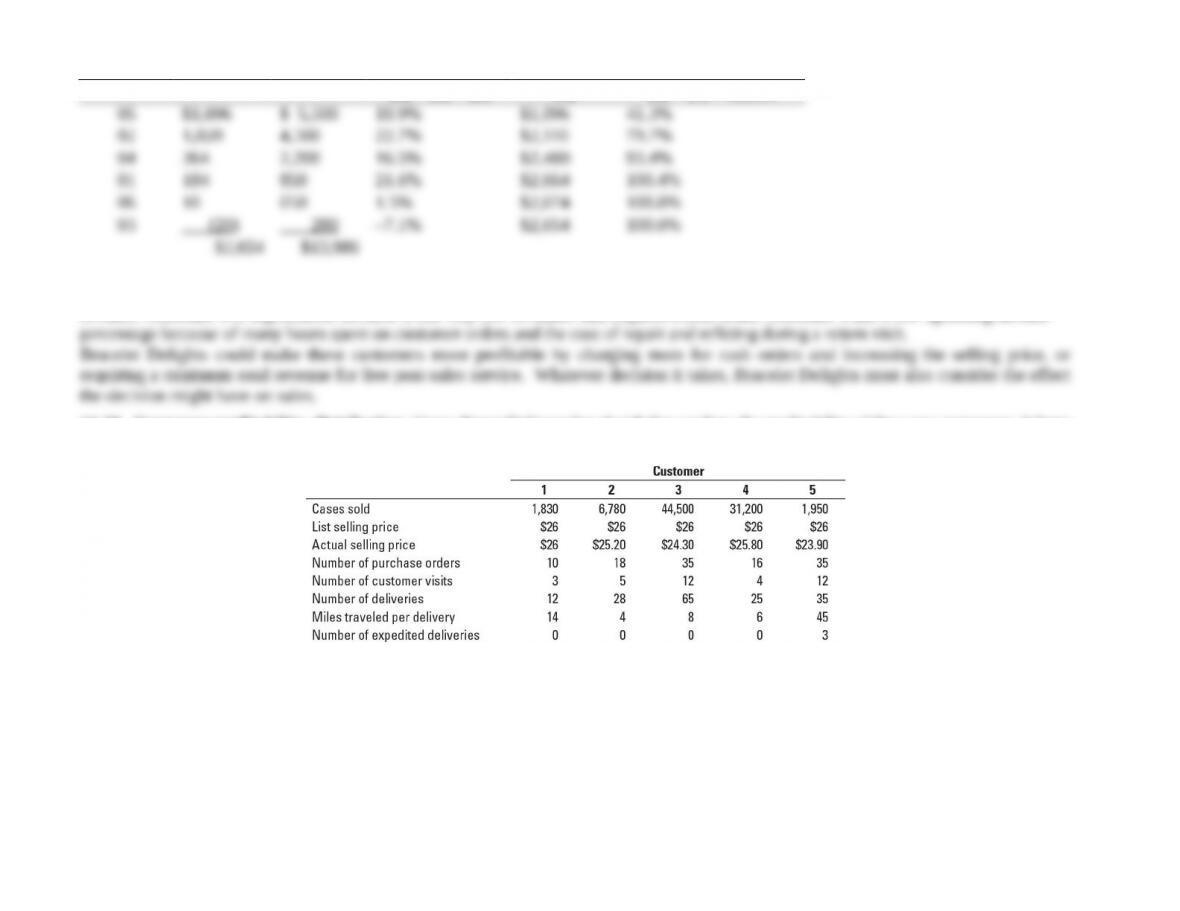
14-31 Customer profitability, distribution. Green Paper Delivery has decided to analyze the profitability of five new customers. It buys
recycled paper at $20 per case and sells to retail customers at a list price of $26 per case. Data pertaining to the five customers are:
Green Paper Delivery’s five activities and their cost drivers are:
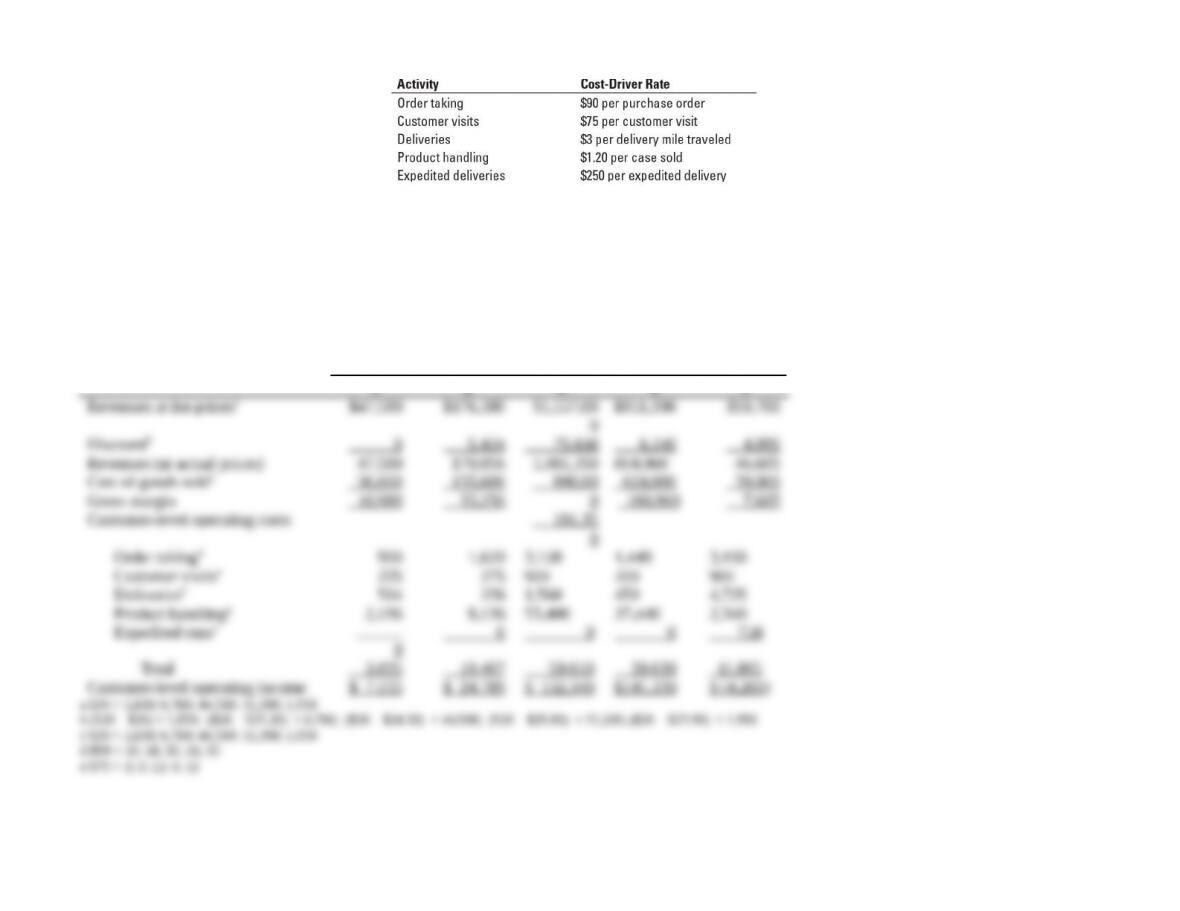
Required:
1. Compute the customer-level operating income of each of the five retail customers now being examined (1, 2, 3, 4, and 5). Comment on
the results.
2. What insights do managers gain by reporting both the list selling price and the actual selling price for each customer?
3. What factors should managers consider in deciding whether to drop one or more of the five customers?
SOLUTION
(30 min.) Customer profitability, distribution.
1. Customer
1 2 3 4 5
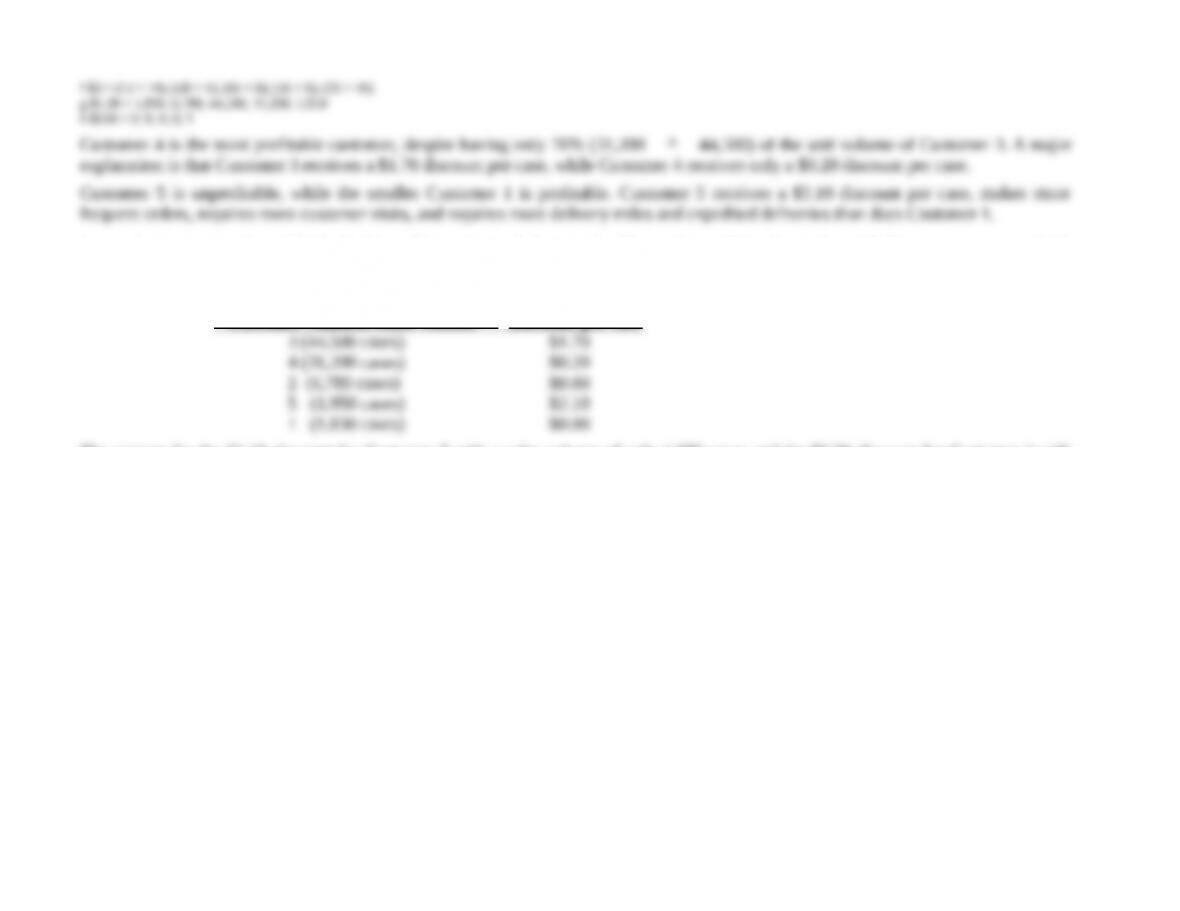
2. Separate reporting of both the list selling price and the actual selling price enables Green Paper Delivery to examine which
customers receive different discounts and how salespeople may differ in the discounts they grant. The following table shows the discounts
given after ranking customers on the basis of the total volume of products sold.
Customer Number/Sales Volume _Discount per case
The reasons for the $2.10 discount for Customer 5 with a sales volume of only 1,950 cases and the $0.80 discount for Customer 2 with
only 6,780 cases should be explored.
3. Dropping customers should be the last resort taken by Green Paper Delivery. Factors to consider include the following:
a. What is the expected future profitability of each customer? Are the currently unprofitable (5) or low-profit (1) customers likely
to be highly profitable in the future?
b. Are there externalities from having some customers, even if they are unprofitable in the short run? For example, some
customers have a marquee-value that is “in effect” advertising that benefits the business.
c. What costs are avoidable if one or more customers are dropped?
d. Can the relationship with the “problem” customers be restructured so that there is a “win-win” situation? For example, could
Customer 5 get by with fewer deliveries per month?
14-32 Customer profitability in a manufacturing firm. Mississippi Manufacturing makes a component called B2040. This component
is manufactured only when ordered by a customer, so Mississippi keeps no inventory of B2040. The list price is $112 per unit, but
customers who place “large” orders receive a 10% discount on price. The customers are manufacturing firms. Currently, the salespeople
decide whether an order is large enough to qualify for the discount. When the product is finished, it is packed in cases of 10. If the
component needs to be exchanged or repaired, customers can come back within 14 days for free exchange or repair.
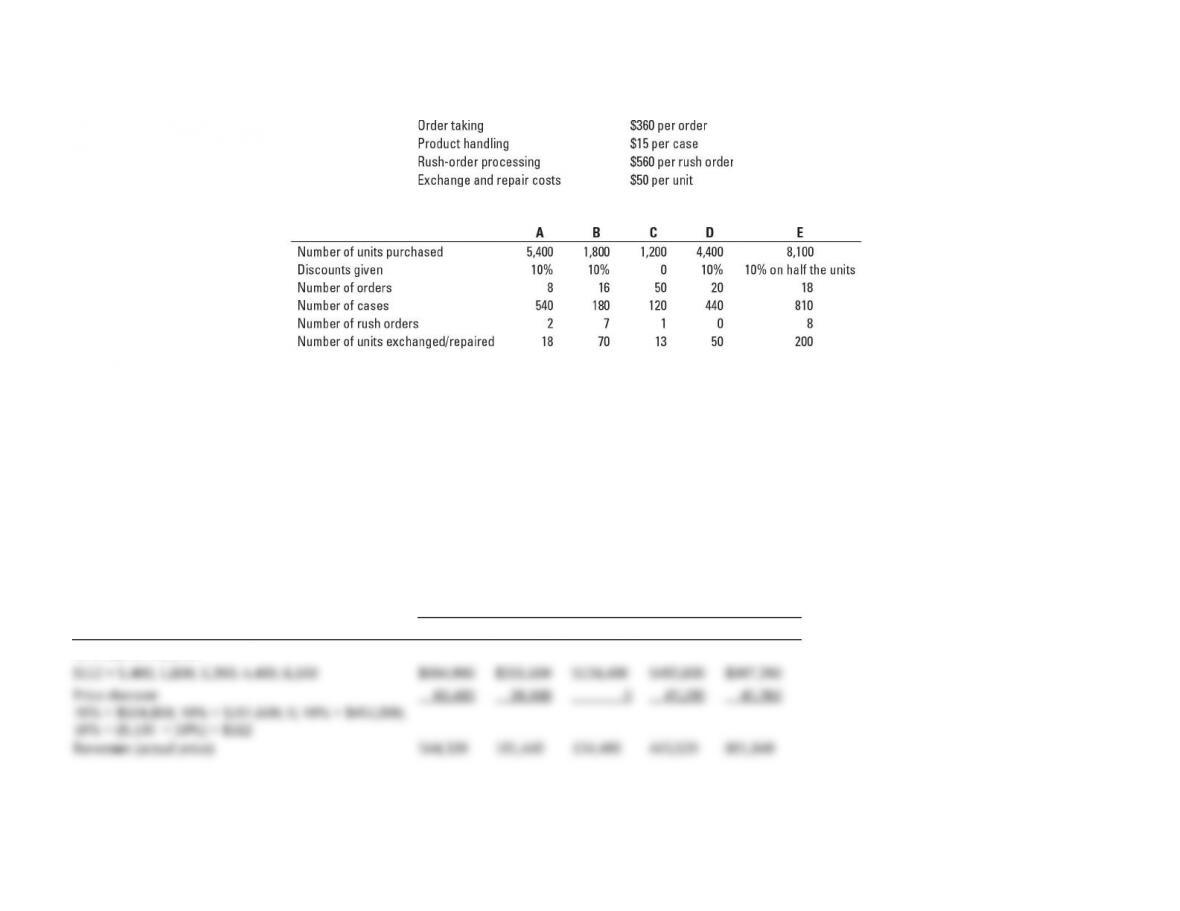
The full cost of manufacturing a unit of B2040 is $95. In addition, Mississippi incurs customer-level costs. Customer-level
cost-driver rates are:
Information about Mississippi’s five biggest customers follows:
All customers except E ordered units in the same order size. Customer E’s order quantity varied, so E got a discount part of the time but
not all the time.
Required:
1. Calculate the customer-level operating income for these five customers. Use the format in Exhibit 14-3. Prepare a
customer-profitability analysis by ranking the customers from most to least profitable, as in Exhibit 14-4.
2. Discuss the results of your customer-profitability analysis. Does Mississippi have unprofitable customers? Is there anything
Mississippi should do differently with its five customers?
SOLUTION
(30 min.) Customer profitability in a manufacturing firm.
1. Calculation of customer profitability by customer:
Customer
A B C D E
Revenues at list price
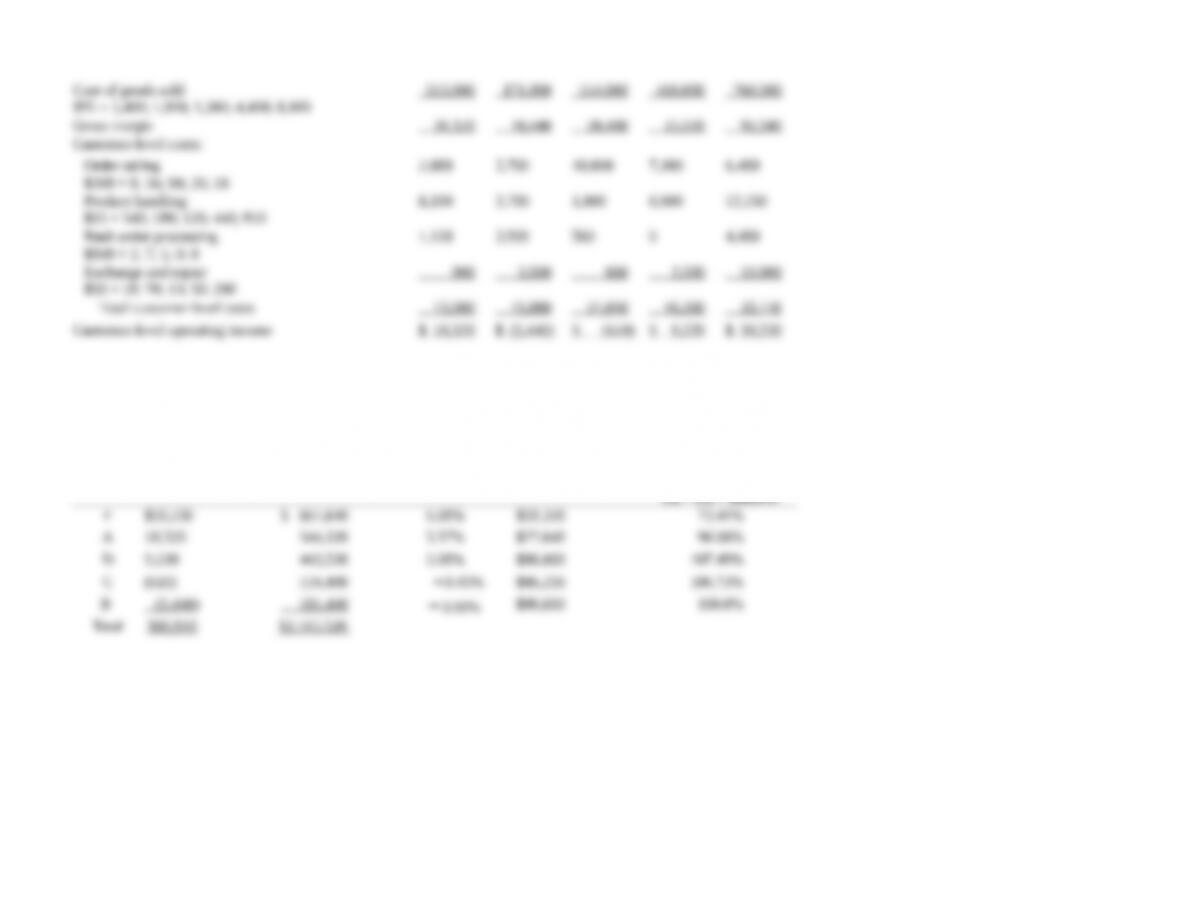
Customer ranking
Customer
Code
Customer-Level
Operating
Income
(1)
Customer
Revenue
(2)
Customer-Level
Operating
Income
Divided by Revenue
(3) = (1) ÷ (2)
Cumulative
Customer-Level
Operating Income
(4)
Cumulative
Customer-Level
Operating Income as
a % of Total
Customer-Level
Operating Income
(5) = (4) ÷ $80,810
2. Customer B and Customer C are Mississippi’s unprofitable customers. All other customers are profitable.
If Customer B were not being given price discounts, B would be profitable. The salesperson is giving discounts on orders, even
though the size of the order is small (the average order size is about 112 (1,800 ÷16) units). It is costing Mississippi money to
process many small orders as opposed to a few large orders. To turn Customer B into a profitable customer, Mississippi needs to
Customer B has many rush orders in proportion to total number of orders. Mississippi should work with Customer B to find a
Customer E also has many rush orders and large number of units exchanged/repaired that are costly to Mississippi. Mississippi
Customer C has a slightly negative operating income (close to breakeven) and a small (negative) operating income as a percentage
The exchange and repair rate for customers with rush orders is higher than for other customers. Mississippi should explore whether
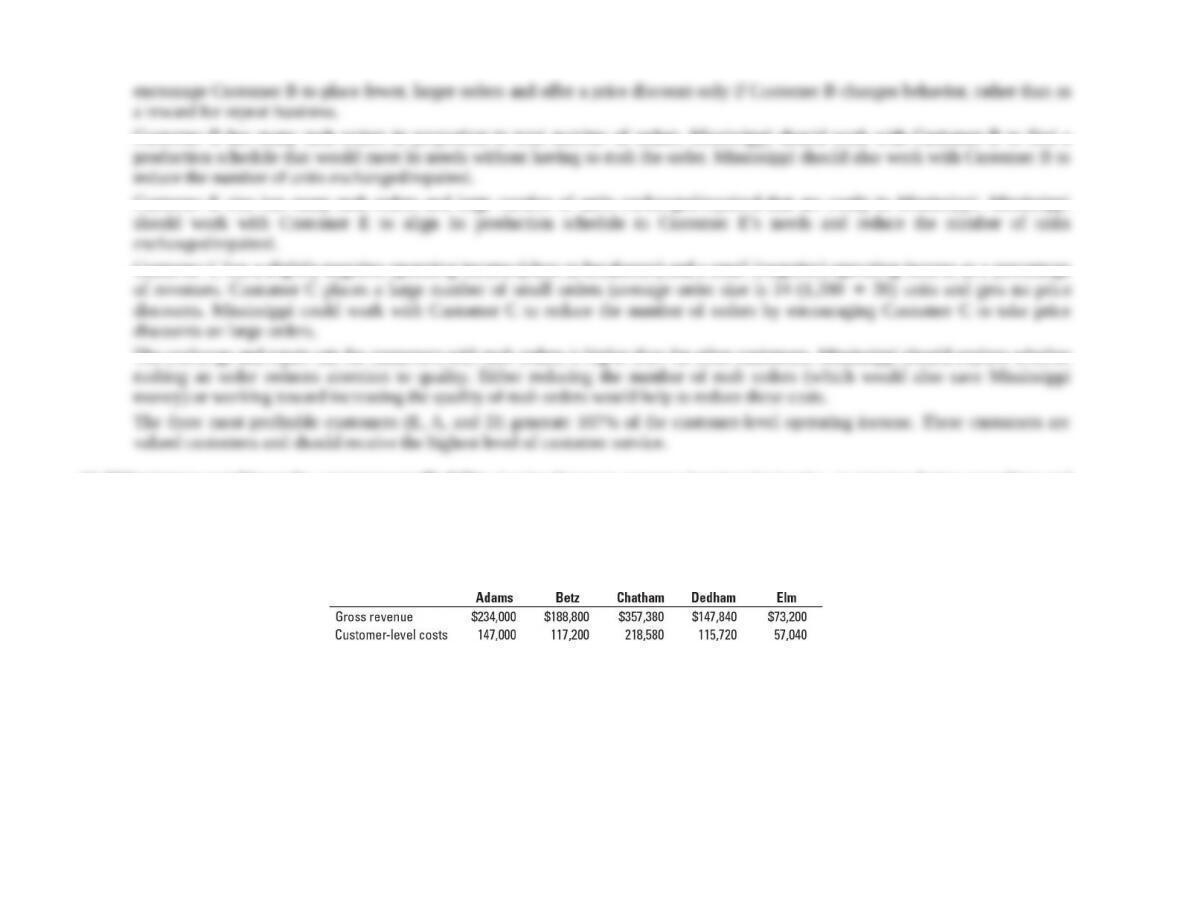
14-33Customer-cost hierarchy, customer profitability. Louise Newman operates Interiors by Louise, an interior design consulting and
window treatment fabrication business. Her business is made up of two different distribution channels, a consulting business in which
Louise serves two architecture firms (Adams and Betz) and a commercial window treatment business in which Louise designs and
constructs window treatments for three commercial clients (Chatham, Dedham, and Elm). Louise would like to evaluate the profitability
of her two architecture firm clients and three commercial window treatment clients, as well as evaluate the profitability of each of the two
channels and the business as a whole. Information about her most recent quarter follow:
Overhead costs total $340,400. Louise has determined that 25% of her overhead costs relate directly to her architectural business, 40%
relate directly to her window treatment business, and the remainder are corporate overhead costs.
On the revenues indicated above, Louise gave a 10% discount to Adams in order to lure it away from a competitor and gave a 5%
discount to Elm for advance payment in cash.
Required:
1. Prepare a customer-cost hierarchy report for Interiors by Louise, using the format in Exhibit 14-6.
2. Prepare a customer-profitability analysis for the five customers, using the format in Exhibit 14-4.
3. Comment on the results of the preceding reports. What recommendations would you give Louise?