SOLUTION
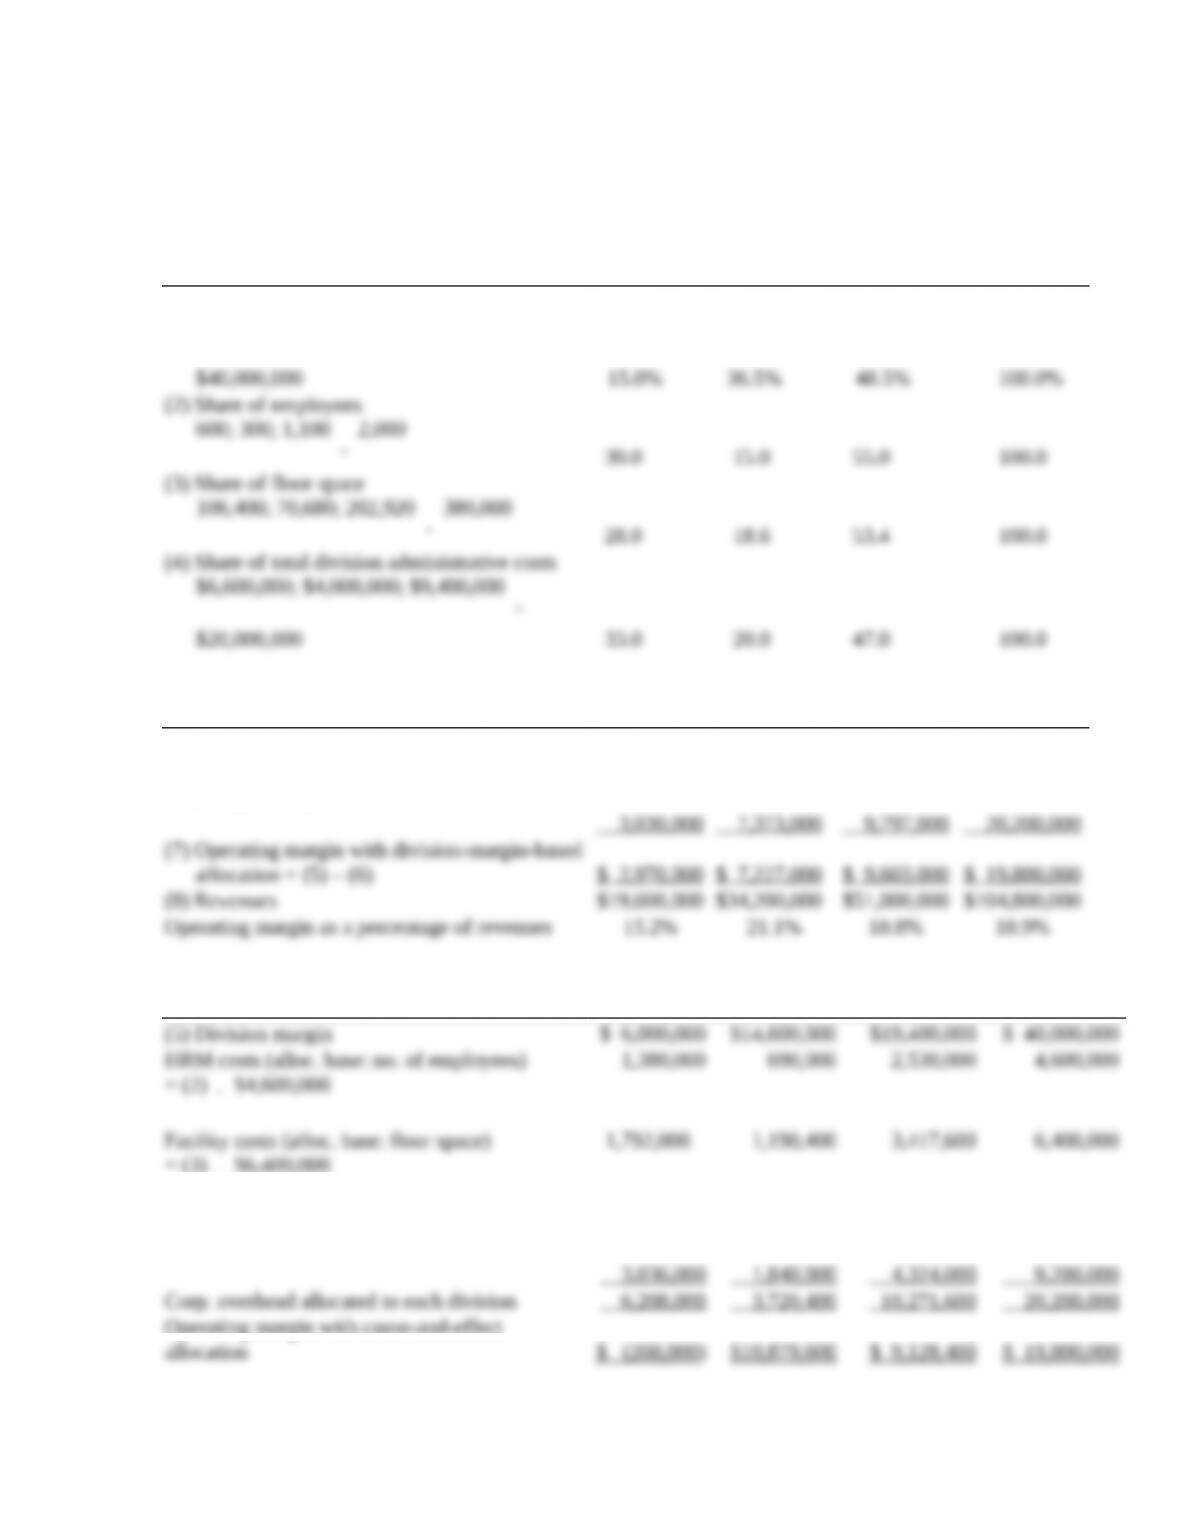
(25 min.) Cost allocation to divisions.
Percentages for various allocation bases (old and new):
Pulp Paper Fibers Total
(1) Division margin percentages
$6,000,000; $14,600,000; $19,400,000
¸
¸
1. Pulp Paper Fibers Total
(5) Division margin $ 6,000,000 $14,600,000 $19,400,000 $ 40,000,000
(6) Corporate overhead allocated on segment
margins = (1)
´
$20,200,000
2.
Pulp Paper Fibers Total
´
´
Corp. admin (alloc. base: div. admin costs)
= (4)
´
$9,200,000
Operating margin with cause-and-effect
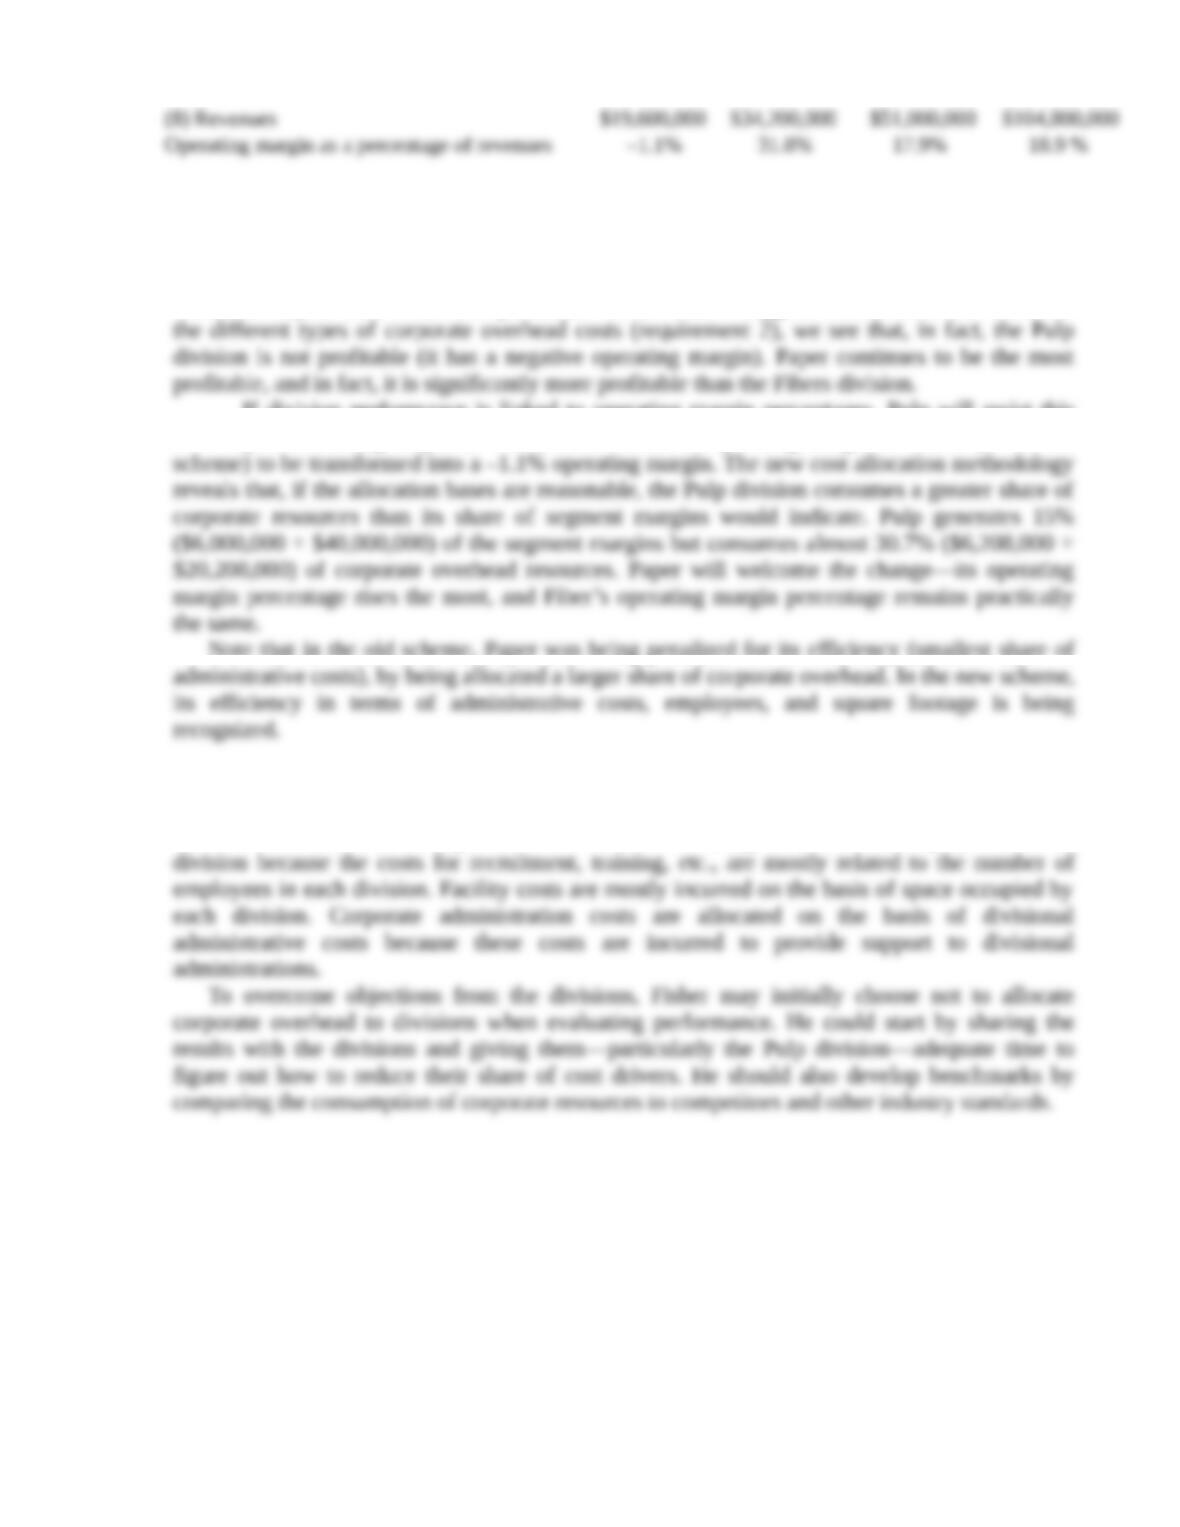
3. When corporate overhead is allocated to the divisions on the basis of division margins
(requirement 1), each division is profitable (has positive operating margin) and the Paper
division is the most profitable (has the highest operating margin percentage) by a slim margin,
while the Pulp division is the least profitable. When Fisher’s suggested bases are used to allocate
If division performance is linked to operating margin percentages, Pulp will resist this
new way of allocating corporate costs, which causes its operating margin of 15.2% (in the old
Note that in the old scheme, Paper was being penalized for its efficiency (smallest share of
4. The new approach is preferable because it is based on cause-and-effect relationships
between costs and their respective cost drivers in the long run.
Human resource management costs are allocated using the number of employees in each
14-25Variance analysis, multiple products. The Chicago Tigers play in the American Ice
Hockey League. The Tigers play in the Downtown Arena, which is owned and managed by the
City of Chicago. The arena has a capacity of 15,000 seats (5,500 lower-tier seats and 9,500
upper-tier seats). The arena charges the Tigers a per-ticket charge for use of its facility. All tickets
are sold by the Reservation Network, which charges the Tigers a reservation fee per ticket. The
Tigers’ budgeted contribution margin for each type of ticket in 2017 is computed as follows:
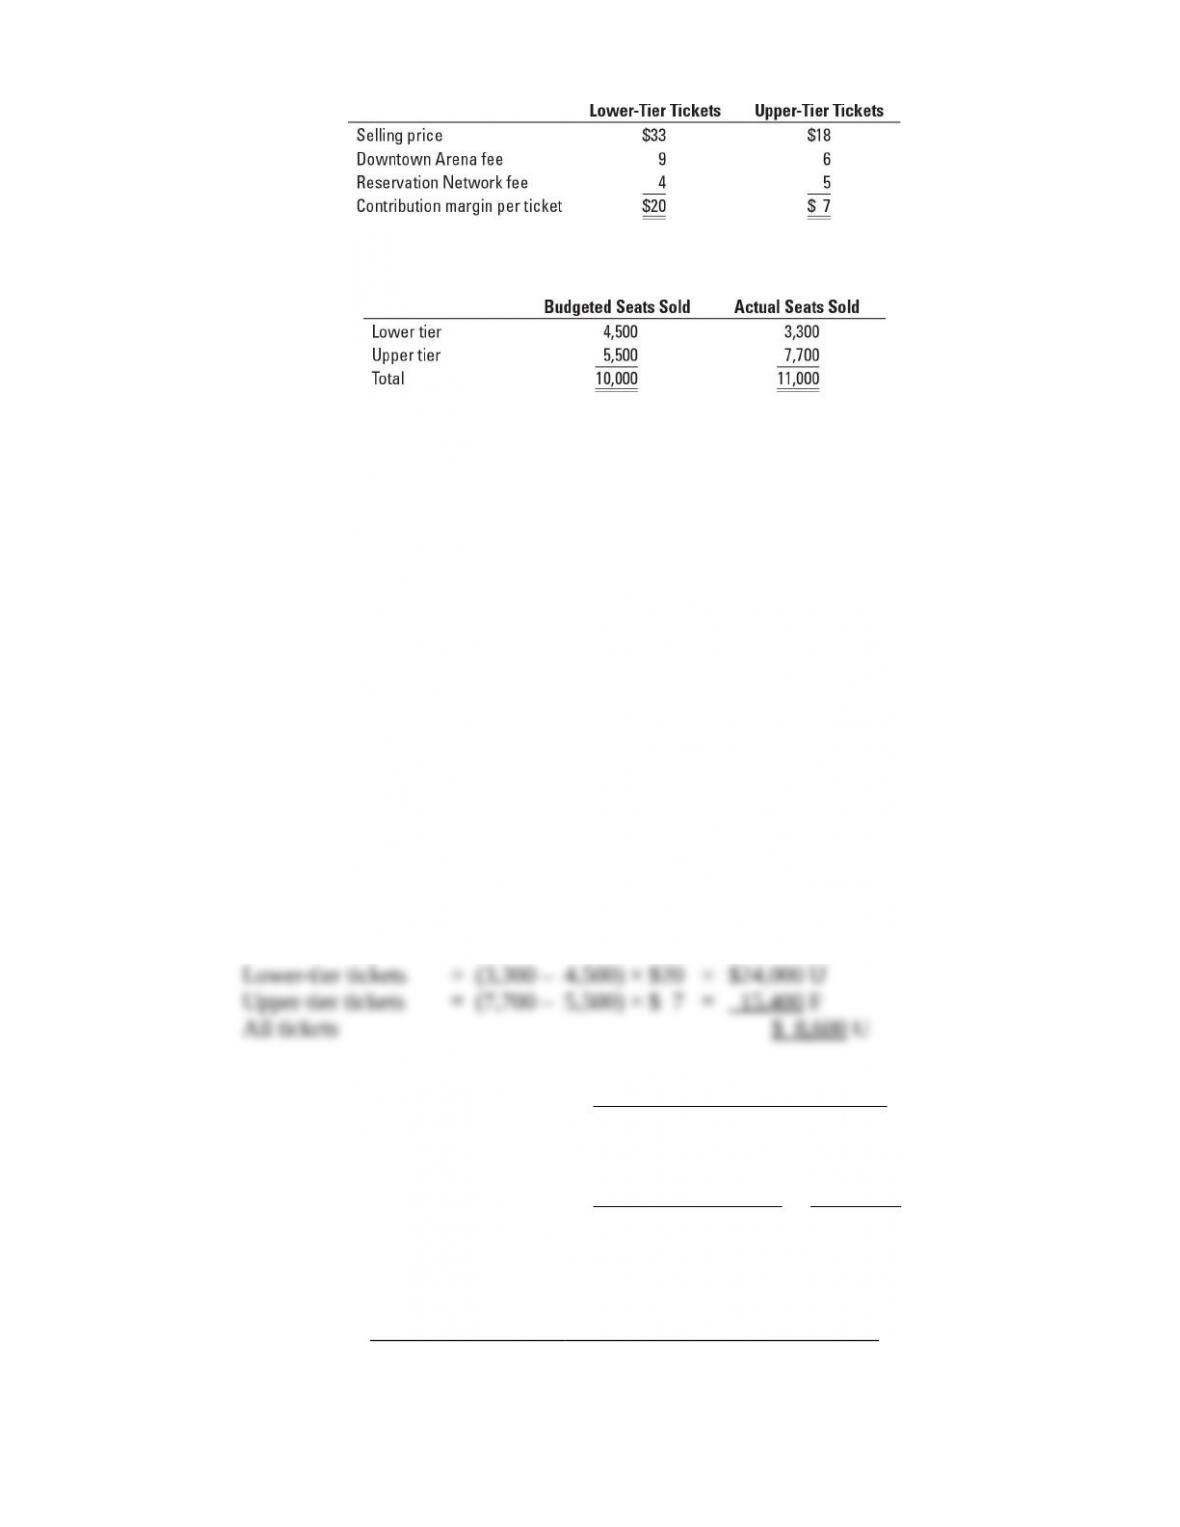
The budgeted and actual average attendance figures per game in the 2017 season are as follows:
There was no difference between the budgeted and actual contribution margin for lower-tier or
upper-tier seats.
The manager of the Tigers was delighted that actual attendance was 10% above budgeted
attendance per game, especially given the depressed state of the local economy in the past six
months.
Required:
1. Compute the sales-volume variance for each type of ticket and in total for the Chicago Tigers
in 2017. (Calculate all variances in terms of contribution margins.)
2. Compute the sales-quantity and sales-mix variances for each type of ticket and in total in
2017.
3. Present a summary of the variances in requirements 1 and 2. Comment on the results.
SOLUTION
(30–40 min.) Variance analysis, multiple products.
1. =
unitsin quantity
sales Actual
–
unitsin quantity
sales Budgeted
´
per ticketmargin
oncontributi Budgeted
2.
unitper margin on contributi
average Budgeted
=
(4,500 $20) (5,500 $7)
10,000
´ + ´
=
$90,000 $38,500
10,000
+
=
$128,500
10,000
= $12.85 per unit (seat sold)
Sales-mix percentages:
Budgeted Actual
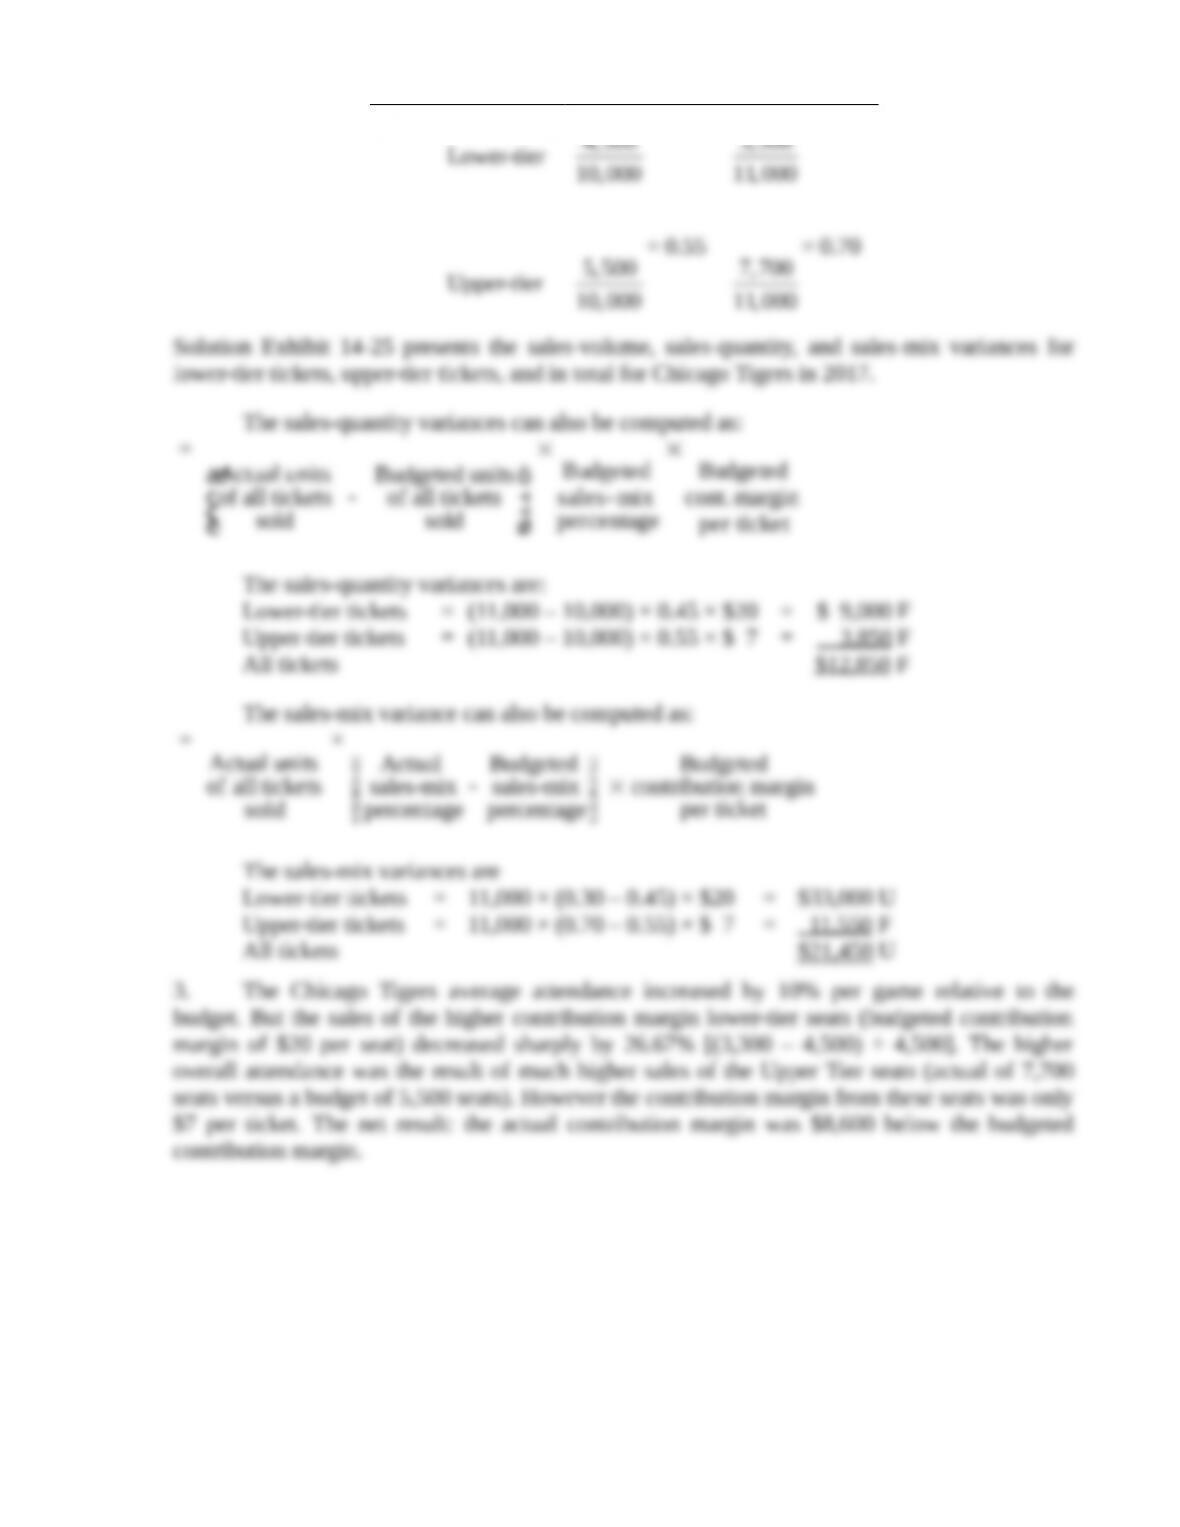
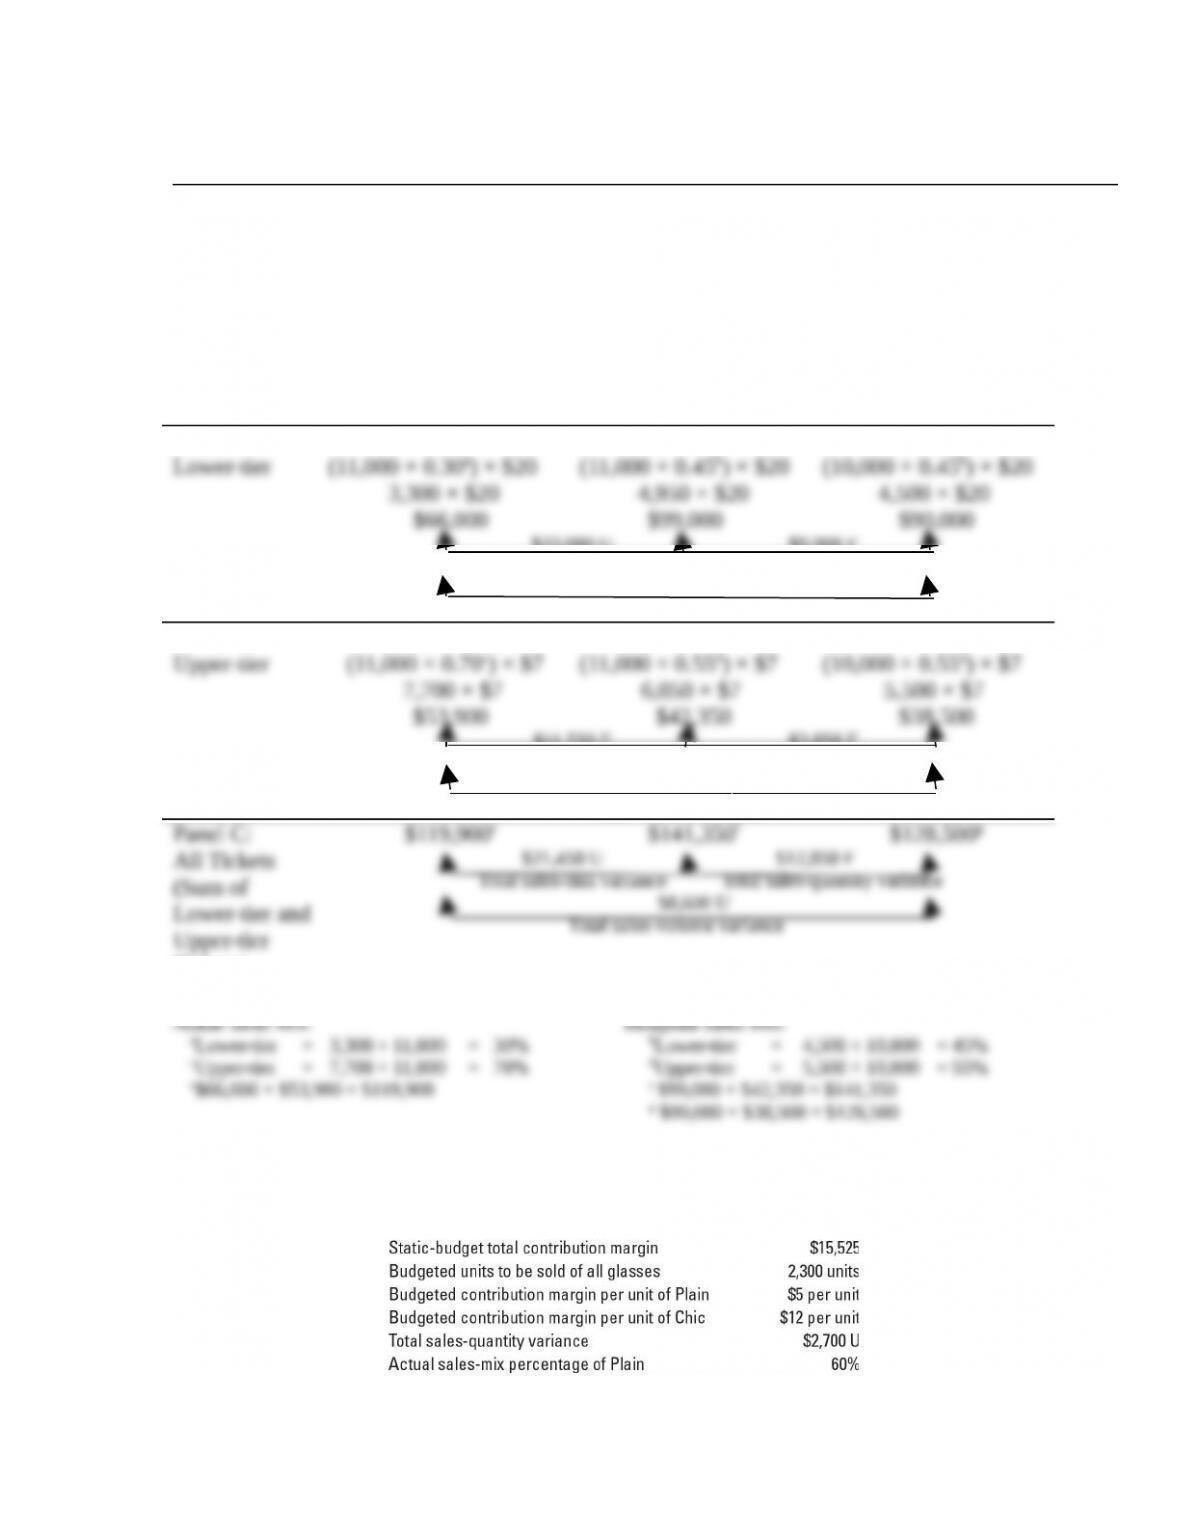
SOLUTION EXHIBIT 14-25
Columnar Presentation of Sales-Volume, Sales-Quantity and Sales-Mix Variances for Chicago Tigers
Flexible Budget:
Actual Units of
All Products Sold
× Actual Sales Mix
× Budgeted
Contribution
Margin per Unit
(1)
Actual Units of
All Products Sold
× Budgeted Sales Mix
× Budgeted
Contribution Margin
per Unit
(2)
Static Budget:
Budgeted Units of
All Products Sold
× Budgeted Sales Mix
× Budgeted
Contribution
Margin per Unit
(3)
Panel A:
$33,000 U $9,000 F
Sales-mix variance Sales-quantity variance
$24,000 U
Sales-volume variance
Panel B:
$11,550 F $3,850 F
Sales-mix variance Sales-quantity variance
$15,400 F
Sales-volume variance
Upper-tier
Tickets)
F = favorable effect on operating income; U = unfavorable effect on operating income.
Actual Sales Mix:
Budgeted Sales Mix:
14-26 Variance analysis, working backward. The Hiro Corporation sells two brands of wine
glasses: Plain and Chic. Hiro provides the following information for sales in the month of June
2017:
All variances are computed in contribution-margin terms.
Required:
1. Calculate the sales-quantity variances for each product for June 2017.
2. Calculate the individual-product and total sales-mix variances for June 2017. Calculate the
individual-product and total sales-volume variances for June 2017.
3. Briefly describe the conclusions you can draw from the variances.
SOLUTION
(30 min.) Variance analysis, working backward.
1. and 2. Solution Exhibit 14-26 presents the sales-volume, sales-quantity, and sales-mix
variances for the Plain and Chic wine glasses and in total for Hiro Corporation in June 2017. The
steps to fill in the numbers in Solution Exhibit 14-26 follow:
Step 1
Consider the static budget column (Column 3):
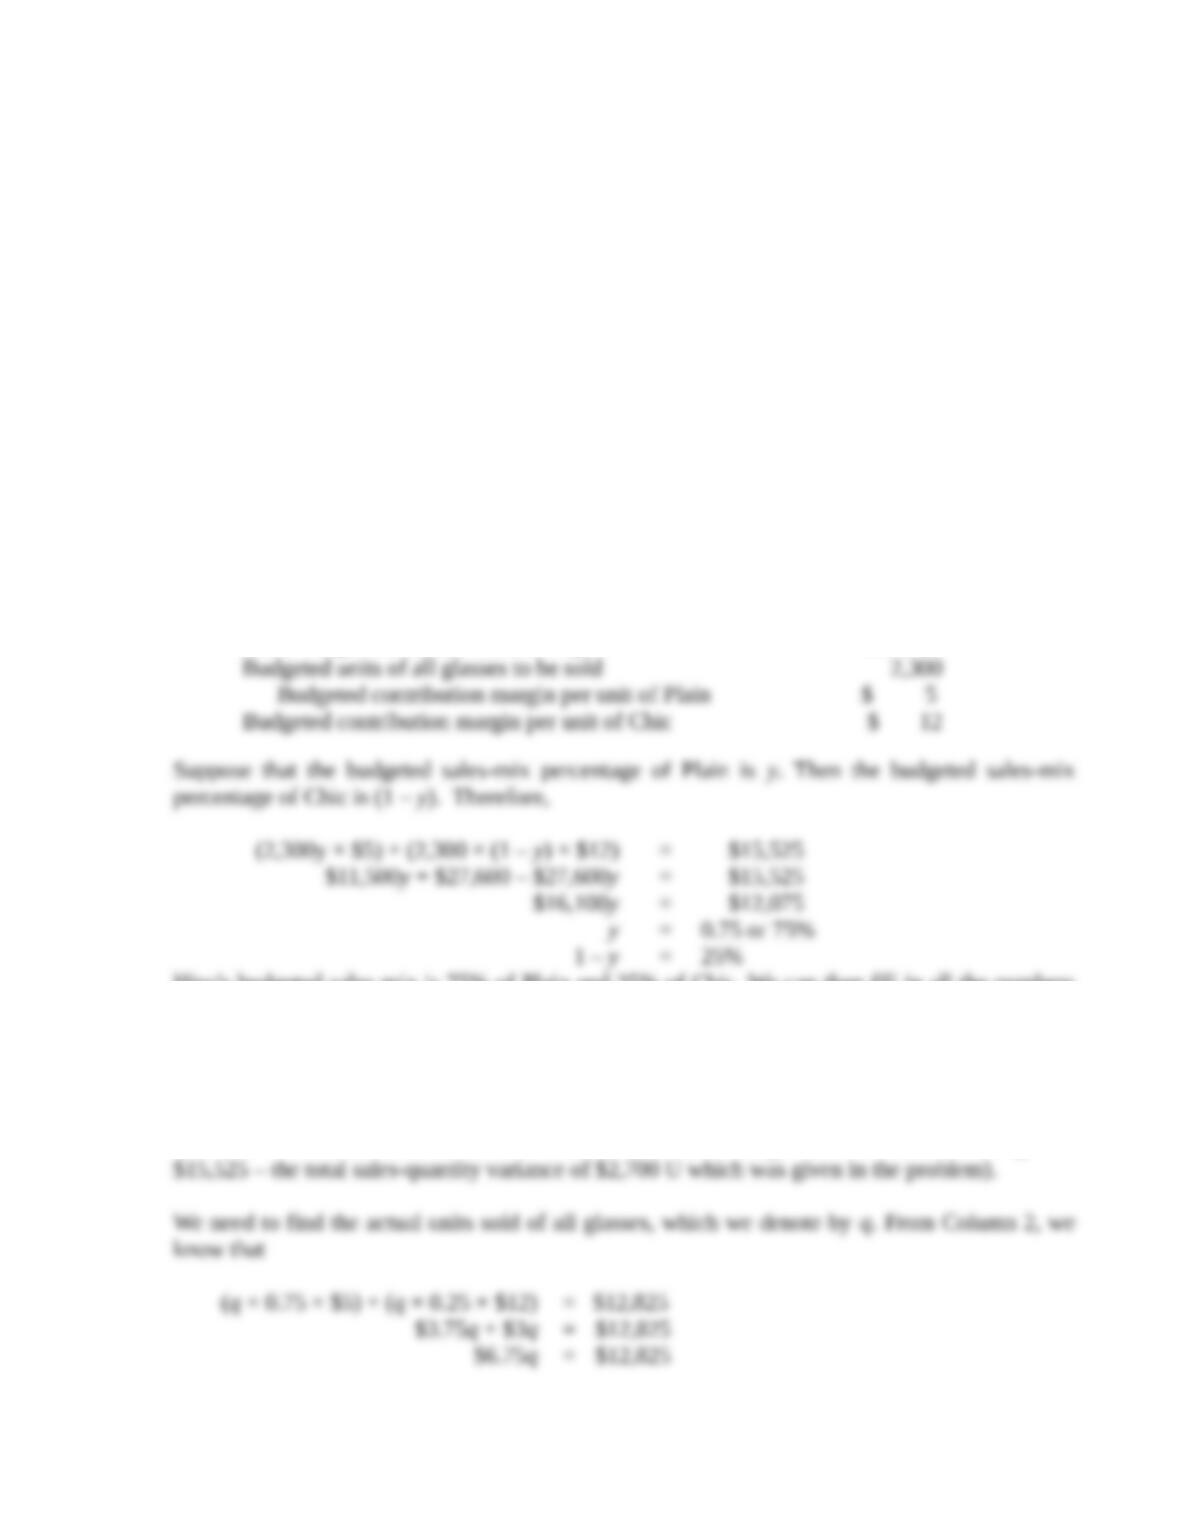
Static budget total contribution margin $15,525
Hiro’s budgeted sales mix is 75% of Plain and 25% of Chic. We can then fill in all the numbers
in Column 3.
Step 2
Next, consider Column 2 of Solution Exhibit 14-26.
The total of Column 2 in Panel C is $12,825 (the static budget total contribution margin of
Step 3
Next, consider Column 1 of Solution Exhibit 14-26. We know actual units sold of all glasses
(1,900 units), the actual sales-mix percentage (given in the problem information as Plain, 60%;
Chic, 40%), and the budgeted unit contribution margin of each product (Plain, $5; Chic, $12).
We can therefore determine all the numbers in Column 1.
Solution Exhibit 14-26 displays the following sales-quantity, sales-mix, and sales-volume
variances:
Sales-Volume Variance
Plain $2,925 U
Chic 2 ,220 F
All Glasses $ 705 U
Sales-Mix Variances Sales-Quantity Variances
Plain $1,425 U Plain $1,500 U
Chic 3 ,420 F Chic 1 ,200 U
All Glasses $1 ,995 F All Glasses $2 ,700 U
3. Hiro Corporation shows an unfavorable sales-quantity variance because it sold fewer
wine glasses in total than was budgeted. This unfavorable sales-quantity variance is partially
offset by a favorable sales-mix variance because the actual mix of wine glasses sold has shifted
in favor of the higher contribution margin Chic wine glasses. The problem illustrates how failure
to achieve the budgeted market penetration can have negative effects on operating income.
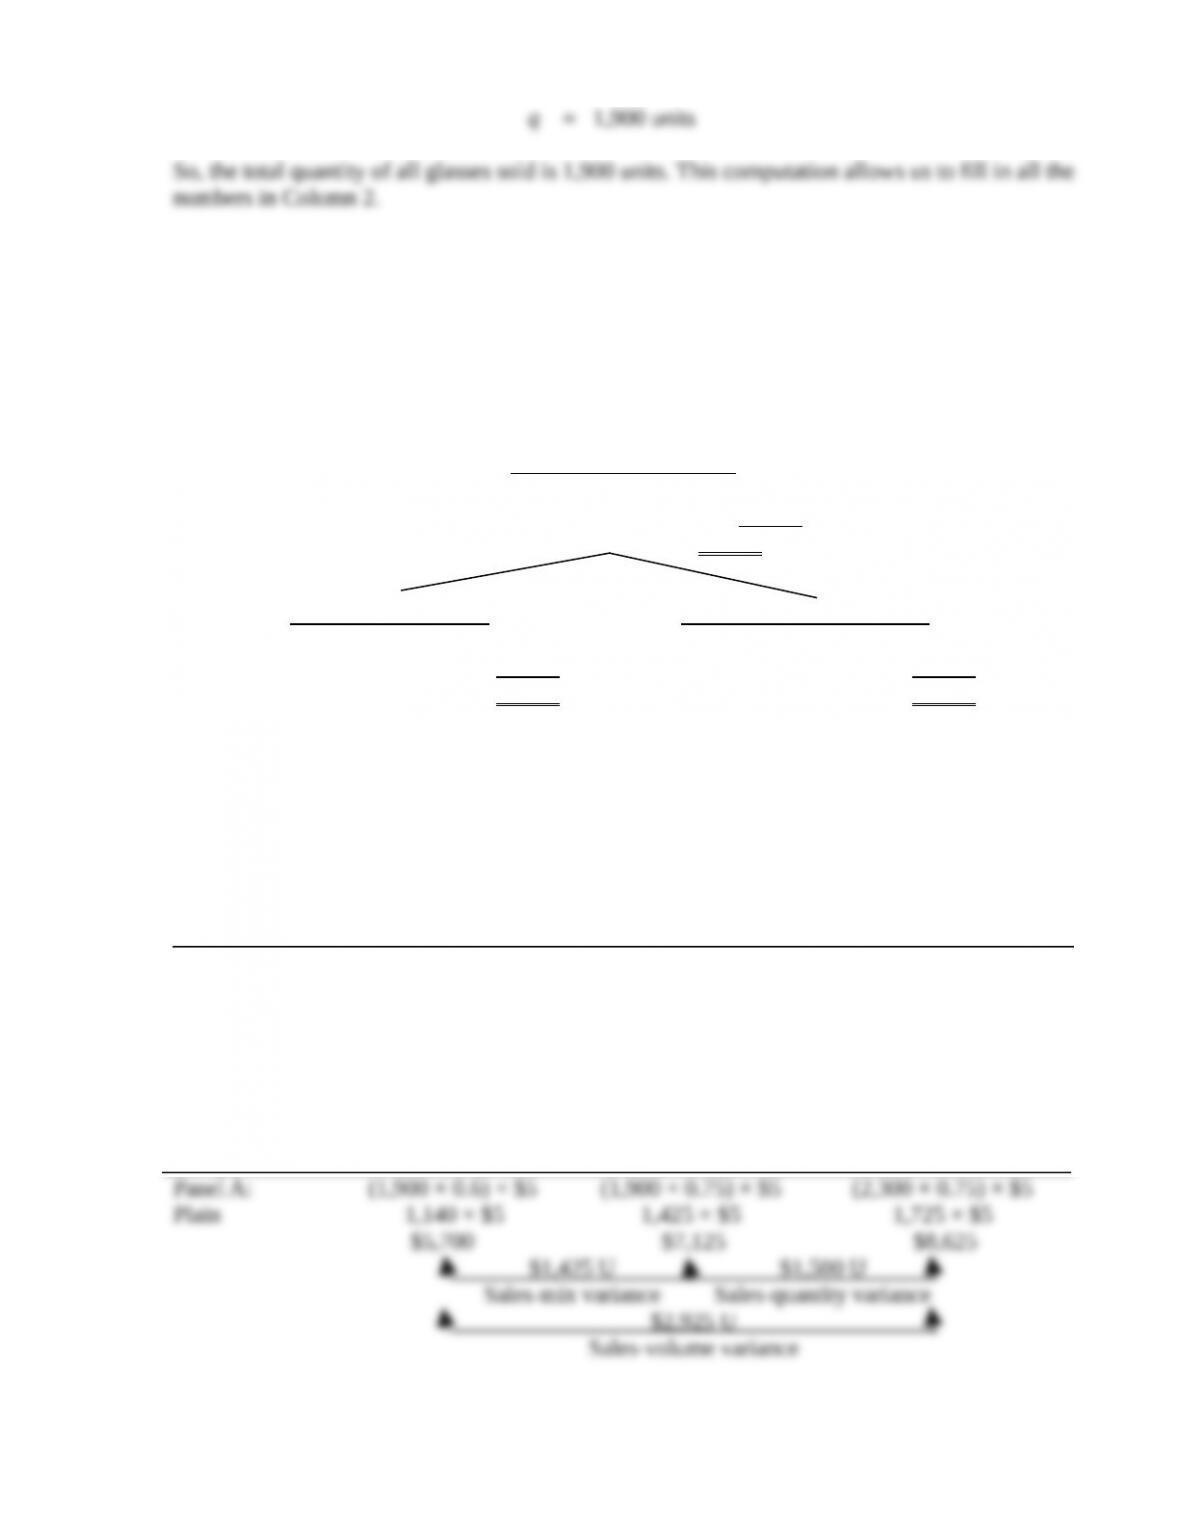
SOLUTION EXHIBIT 14-26
Columnar Presentation of Sales-Volume, Sales-Quantity and Sales-Mix Variances
for Hiro Corporation
Flexible Budget:
Actual Units
of All Glasses Sold
× Actual Sales Mix
× Budgeted
Contribution
Margin per Unit
Actual Units
of All Glasses Sold
× Budgeted Sales Mix
× Budgeted
Contribution
Margin per Unit
Static Budget:
Budgeted Units
of All Glasses Sold
× Budgeted Sales Mix
× Budgeted
Contribution
Margin per Unit
F = favorable effect on operating income; U = unfavorable effect on operating income.
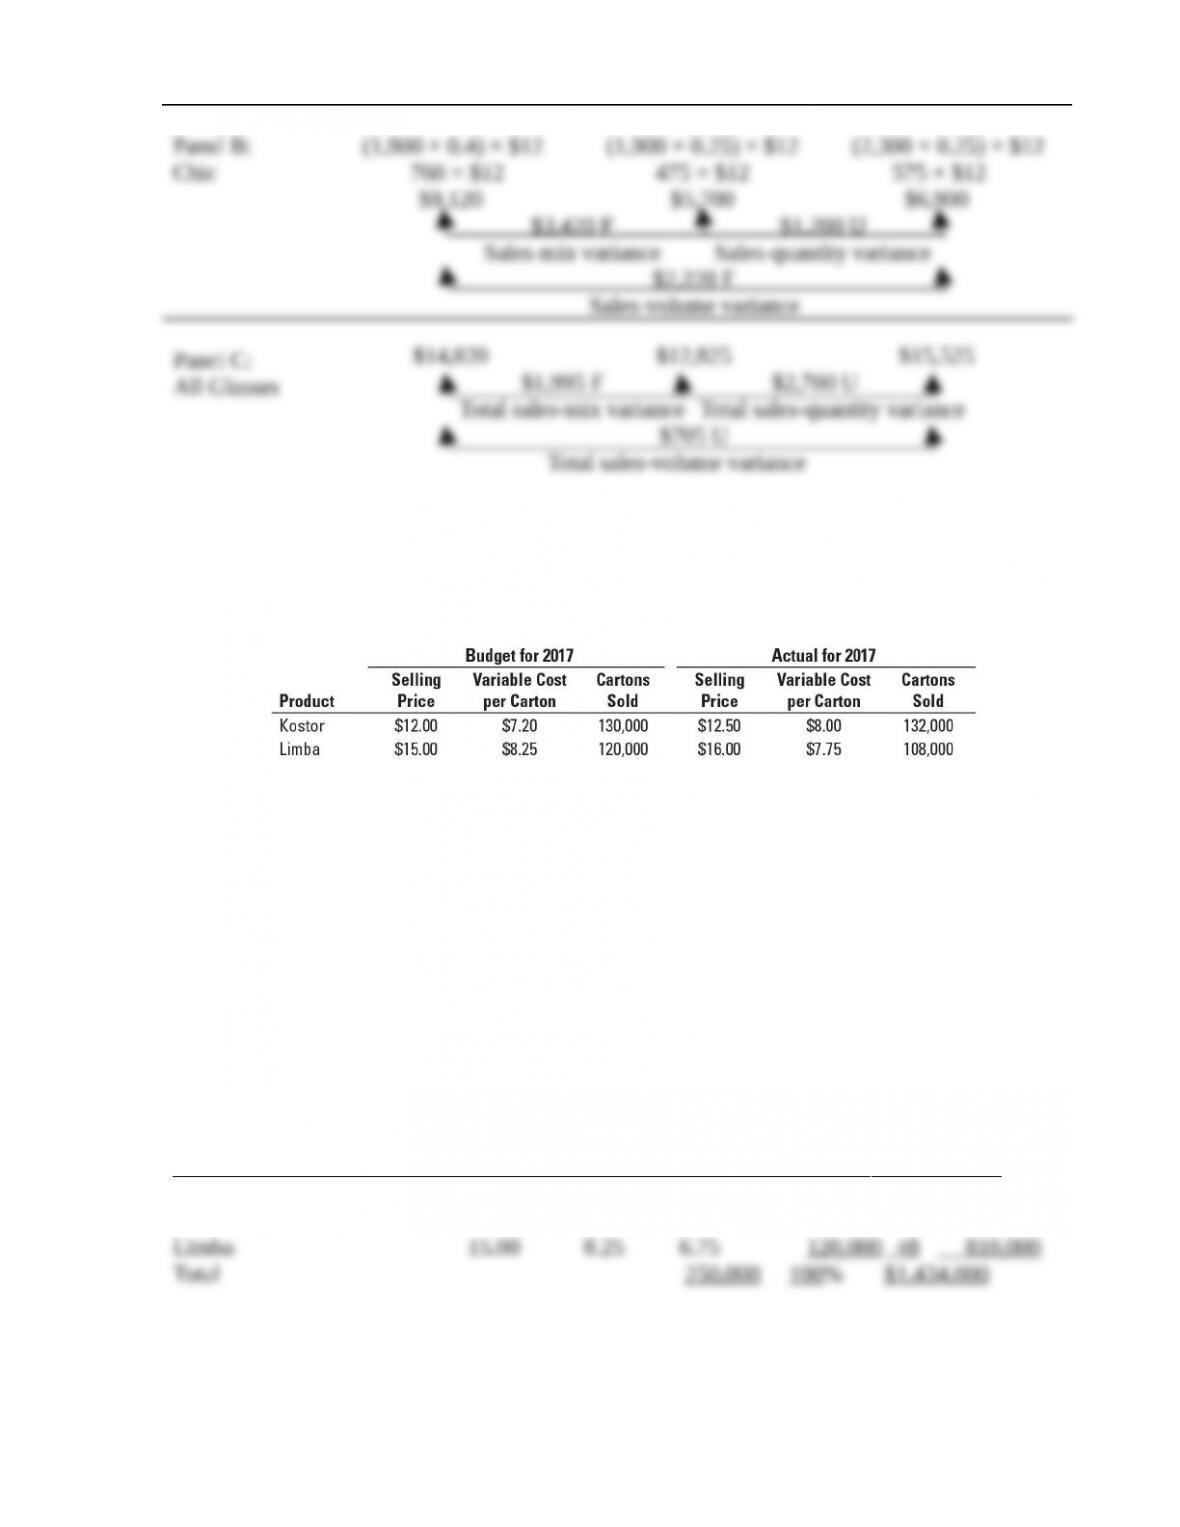
14-27Variance analysis, multiple products. Emcee Inc. manufactures and sells two fruit
drinks: Kostor and Limba. Budgeted and actual results for 2017 are as follows:
Required:
1. Compute the total sales-volume variance, the total sales-mix variance, and the total
sales-quantity variance. (Calculate all variances in terms of contribution margin.) Show
results for each product in your computations.
2. What inferences can you draw from the variances computed in requirement 1?
SOLUTION
(60 min.)Variance analysis, multiple products.
1. Budget for 2017
Variable Contrib.
Selling Cost Margin Units Sales Contribution
Price per Unit per Unit Sold Mix Margin
(1) (2) (3) = (1) – (2) (4) (5) (6) = (3) × (4)
Kostor $12.00 $7.20 $4.80 130,000 52% $
624,000
Actuals for 2017
Variable Contrib.
Selling Cost Margin Units Sales Contribution
Price per Unit per Unit Sold Mix Margin
(1) (2) (3) = (1) – (2) (4) (5) (6) = (3) × (4)
Kostor $12.50 $8.00 $4.50 132,000 55% $
594,000
Limba 16.00 7.75 8.25 108,000 45 891,000
Total 240,000 100% $1,485,000
Solution Exhibit 14-27 presents the sales-volume, sales-quantity, and sales-mix variances for
each product and in total for 2017.
Sales-volume
variance
=
Actual Budgeted
quantity of quantity of
units sold units sold
æ ö
ç ÷
– ´
ç ÷
è ø
Budgeted
contribution margin
per unit
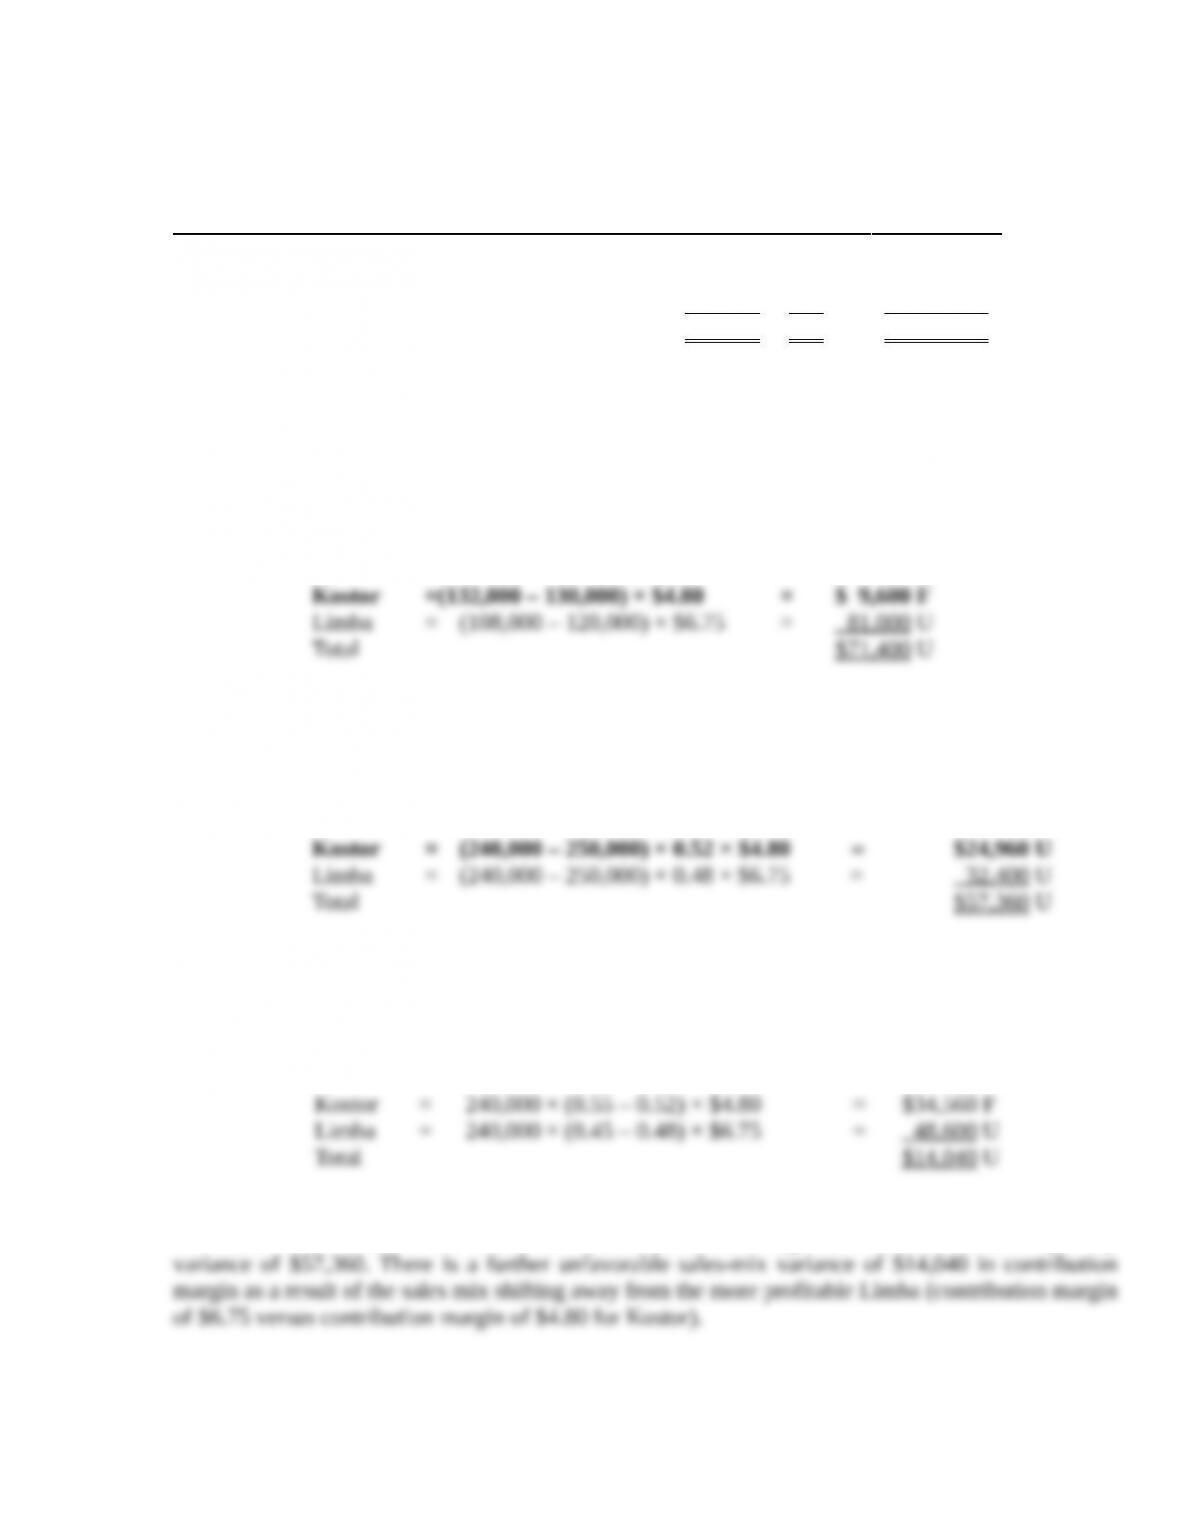
Kostor =(132,000 – 130,000) × $4.80 = $ 9,600 F
Limba = (108,000 – 120,000) × $6.75 = 81,000 U
Total $71,400 U
Sales-quantity
variance
Actual units Budgeted units
of all of all
products sold products sold
æ ö
ç ÷
= – ´
ç ÷
è ø
Budgeted
sales-mix
percentage
´
Budgeted
contribution margin
per unit
Kostor = (240,000 – 250,000) × 0.52 × $4.80 =$24,960 U
Limba = (240,000 – 250,000) × 0.48 × $6.75 = 32 ,400 U
Total $57 ,360 U
Sales-mix
variance
=
Actual units of
all products
sold
´
Actual
sales-mix
percentage
æ
ç
ç
è
–
Budgeted
sales-mix
percentage
ö
÷
÷
ø
´
Budgeted
contribution margin
per unit
Kostor = 240,000 × (0.55 – 0.52) × $4.80 = $34,560 F
Limba = 240,000 × (0.45 – 0.48) × $6.75 = 48,600 U
Total $14,040 U
2. The breakdown of the unfavorable sales-volume variance of $71,400 shows that the biggest
contributor is the 10,000 unit overall decrease in sales resulting in an unfavorable sales-quantity
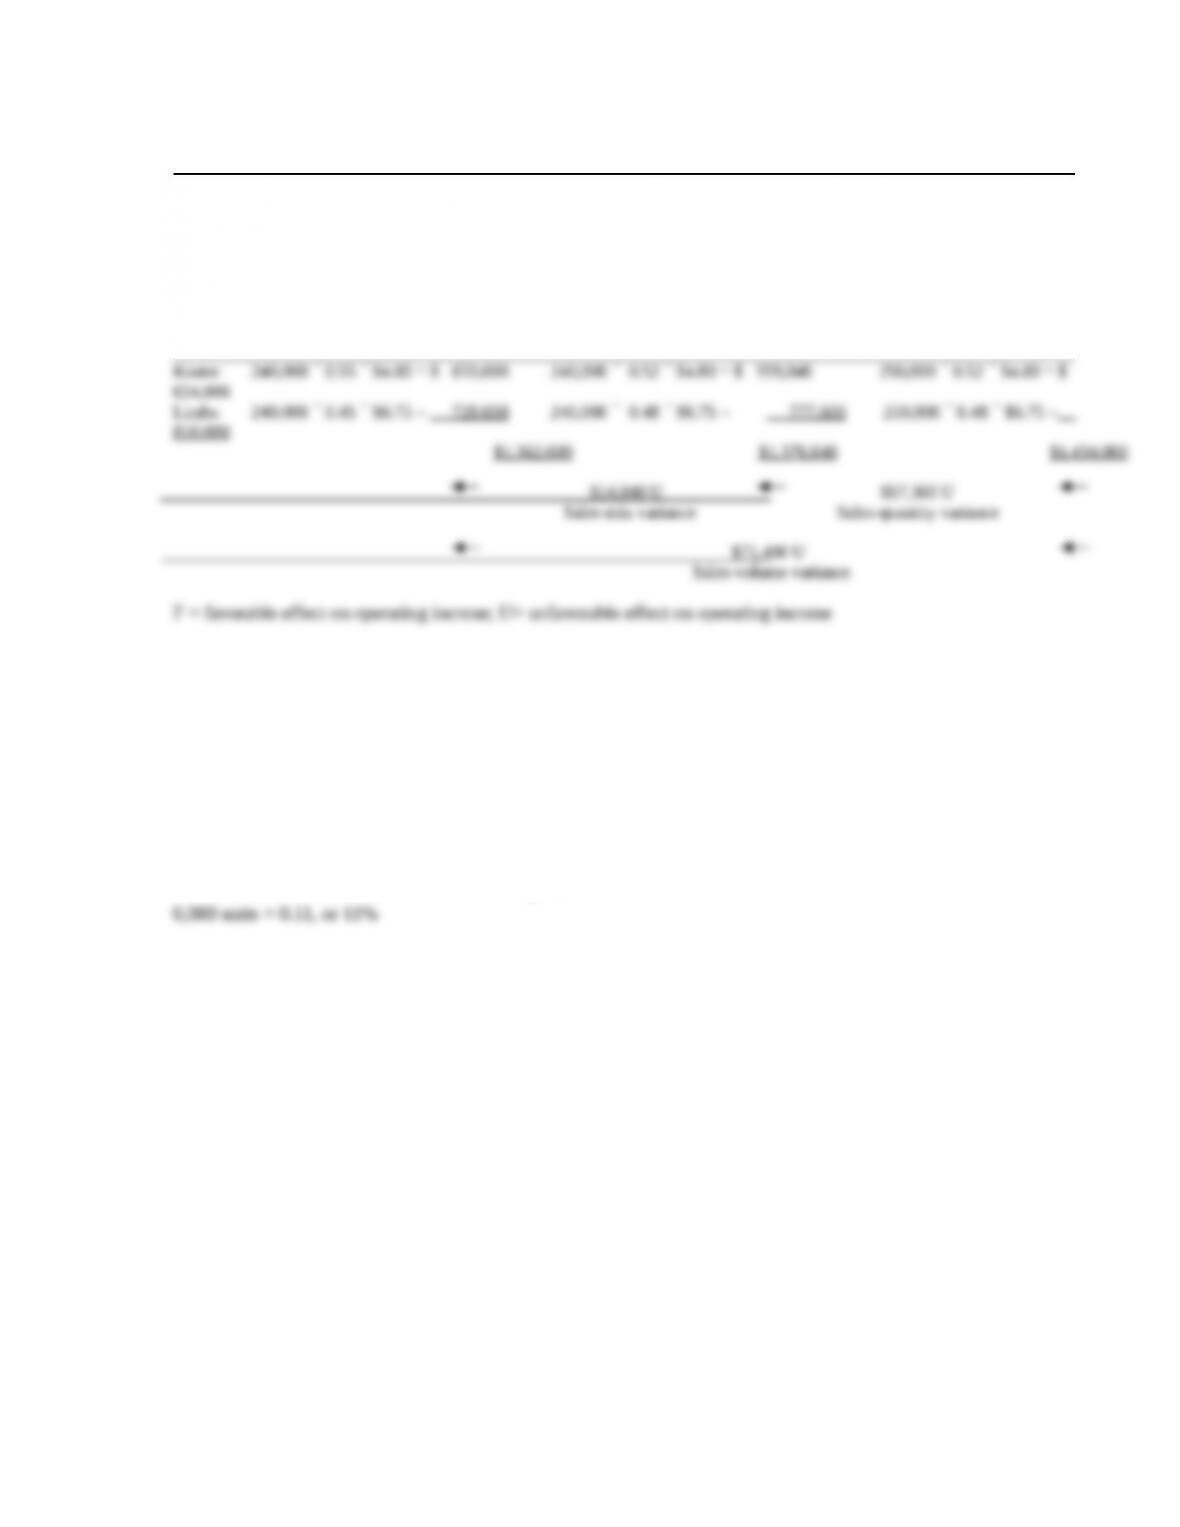
SOLUTION EXHIBIT 14-27
Sales-Mix and Sales-Quantity Variance Analysis of Emcee Inc. for 2017
Flexible Budget: Static Budget:
Actual Units of Actual Units of Budgeted Units of
All Products Sold All Products Sold All Products Sold
´ Actual Sales Mix ´ Budgeted Sales Mix ´ Budgeted Sales Mix
´ Budgeted Contribution ´ Budgeted Contribution ´ Budgeted Contribution
Margin Per Unit Margin Per Unit Margin Per Unit
624,000
810,000
14-28Market-share and market-size variances (continuation of 14-27). Emcee Inc. prepared
the budget for 2017 assuming a 20% market share based on total sales in the Midwest region of
the United States. The total fruit drinks market was estimated to reach sales of 1.25 million
cartons in the region. However, actual total sales volume in the western region was 1.5 million
cartons.
Required:
Calculate the market-share and market-size variances for Emcee Inc. in 2017. (Calculate all
variances in terms of contribution margin.) Comment on the results.