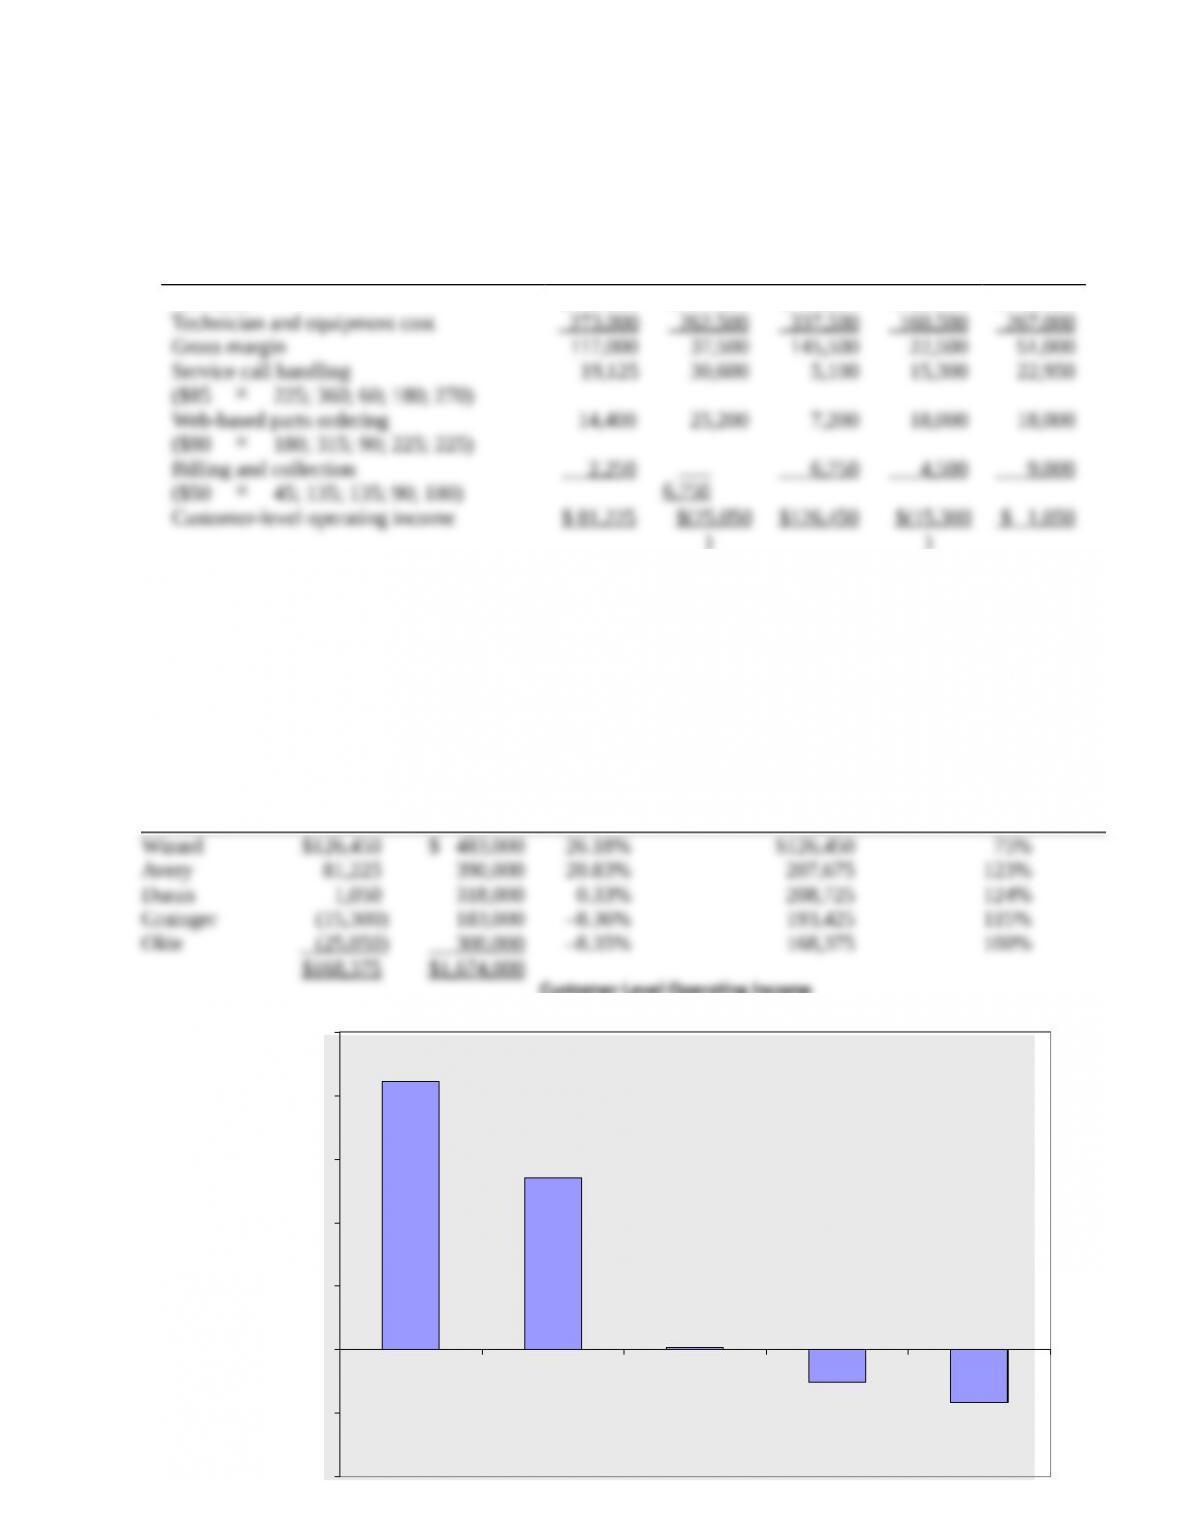
Customer-Level Operating Income
$126,45
0
$81,225
$1,050
$(15,300)
$(25,050)
-$60,00
0
-$30,00
0
$
0
$30,00
0
$60,00
0
$90,00
0
$120,00
0
$150,00
0
Customers
Custo
mer-Le
vel
Opera
ting
Incom
e
Grainger
Avery
Okie
Duran
Wizard
SOLUTION
(20−30 min.) Customer profitability, service company.
1.
Avery Okie Wizard Grainger Duran
Revenues $390,000 $300,000 $483,000 $183,000 $318,000
)
)
2. Customers Ranked on Customer-Level Operating Income
Cumulative
Customer-Level
Operating Income
Customer-Level Customer-Level Cumulative as a % of Total
Operating Customer Operating Income Customer-Level Customer-Level
Customer Income Revenue as a % of Revenue Operating Income Operating Income
Code (1) (2)
(3) = (1)
¸
(2)
(4)
(5) = (4)
¸
$168,375
The table and graph above present the summary results.
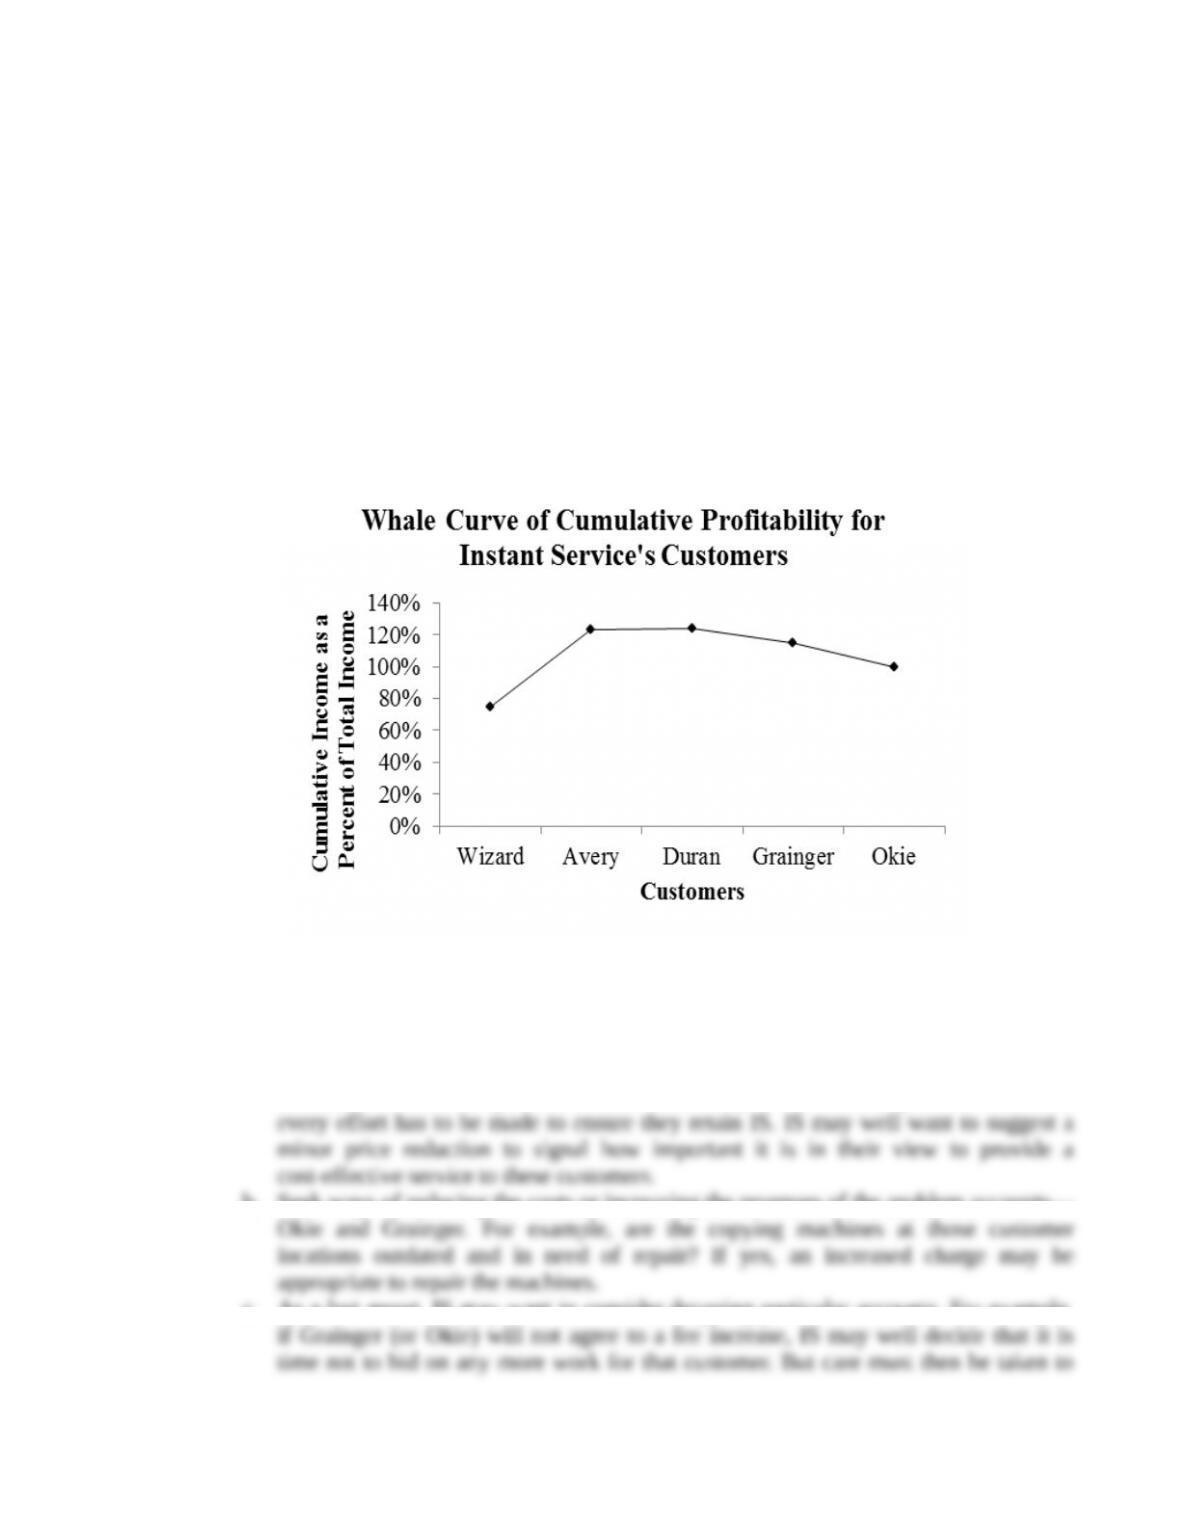
The following is the whale curve of cumulative profitability for Instant Service’s customers.
Wizard, the most profitable customer, provides 75% of total operating income. The three best
customers provide 124% of IS’s operating income, and the other two, by incurring losses for IS,
erode the extra 24% of operating income down to IS’s operating income.
3. The options that IS should consider include:
a. Increase the attention paid to Wizard and Avery. These are “key customers,” and
b. Seek ways of reducing the costs or increasing the revenues of the problem accounts—
c. As a last resort, IS may want to consider dropping particular accounts. For example,
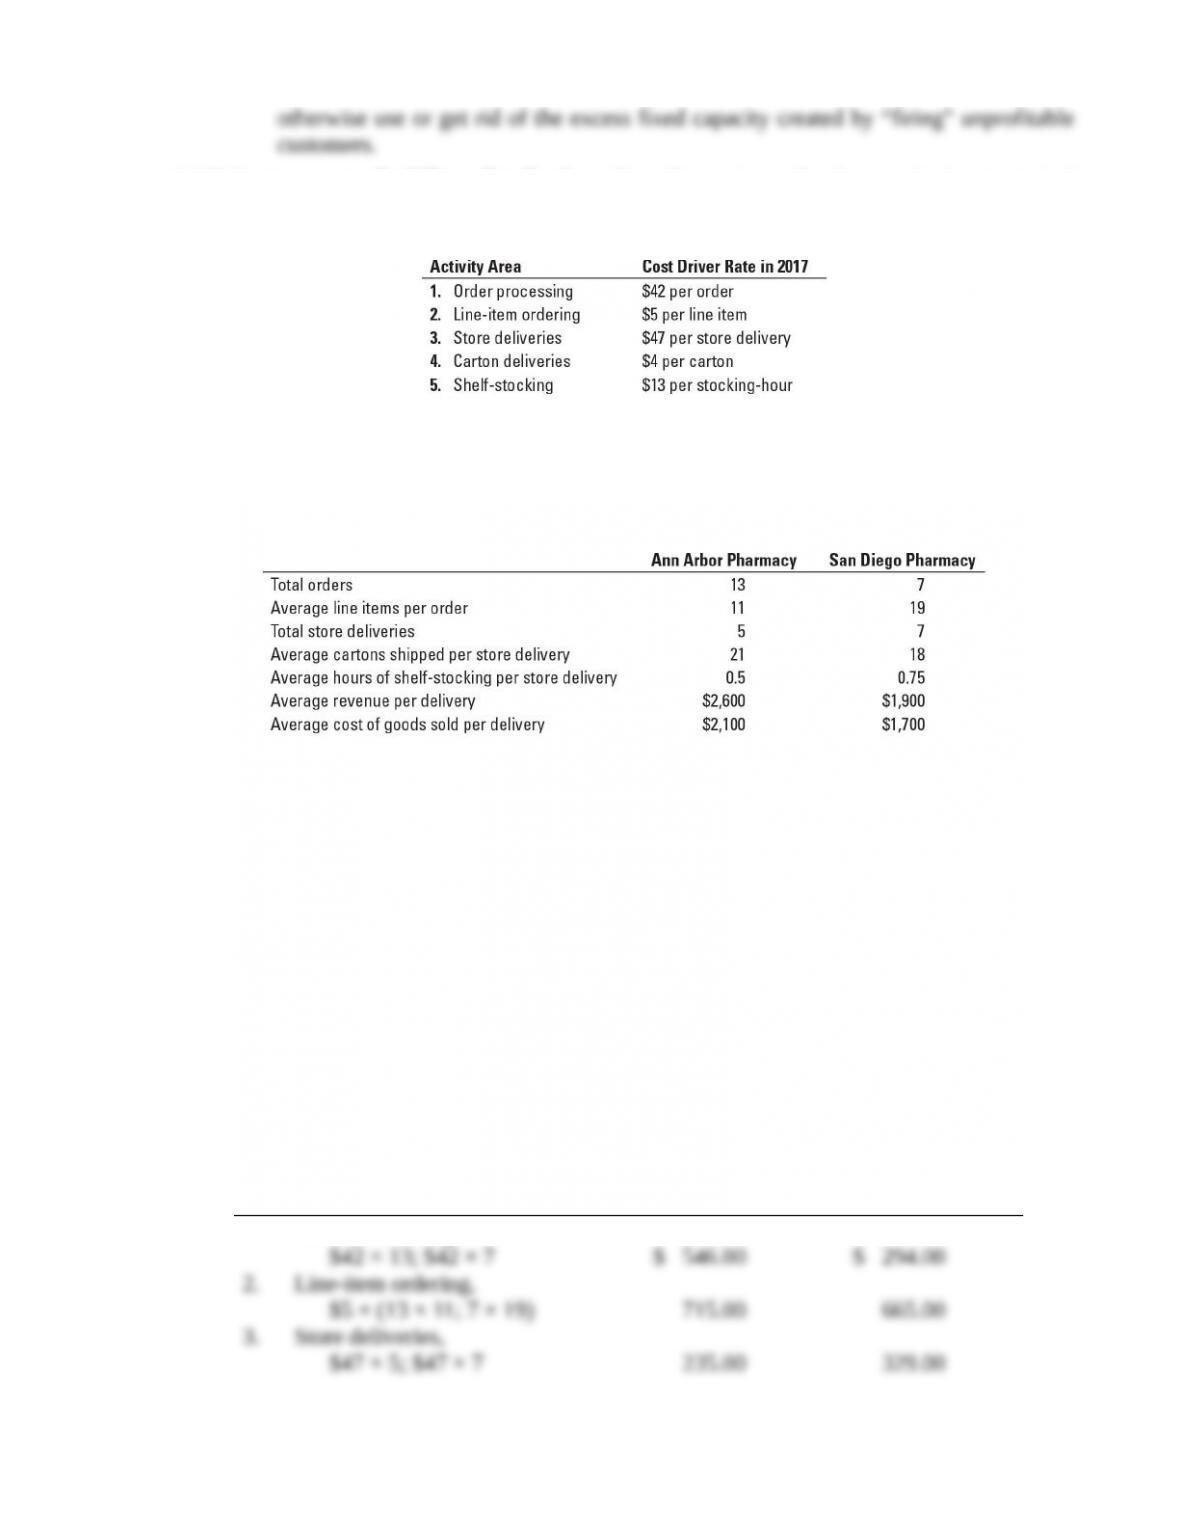
14-21Customer profitability, distribution. Best Drugs is a distributor of pharmaceutical
products. Its ABC system has five activities:
Rick Flair, the controller of Best Drugs, wants to use this ABC system to examine individual
customer profitability within each distribution market. He focuses first on the Ma and Pa
single-store distribution market. Using only two customers helps highlight the insights available
with the ABC approach. Data pertaining to these two customers in August 2017 are as follows:
Required:
1. Use the ABC information to compute the operating income of each customer in August 2017.
Comment on the results and what, if anything, Flair should do.
2. Flair ranks the individual customers in the Ma and Pa single-store distribution market on the
basis of monthly operating income. The cumulative operating income of the top 20% of
customers is $58,120. Best Drugs reports operating losses of $23,670 for the bottom 40% of
its customers. Make four recommendations that you think Best Drugs should consider in light
of this new customer-profitability information.
SOLUTION
(20–25 min.) Customer profitability, distribution.
1. The activity-based costing for each customer is:
Ann Arbor
Pharmacy
San Diego
Pharmacy
1. Order processing,
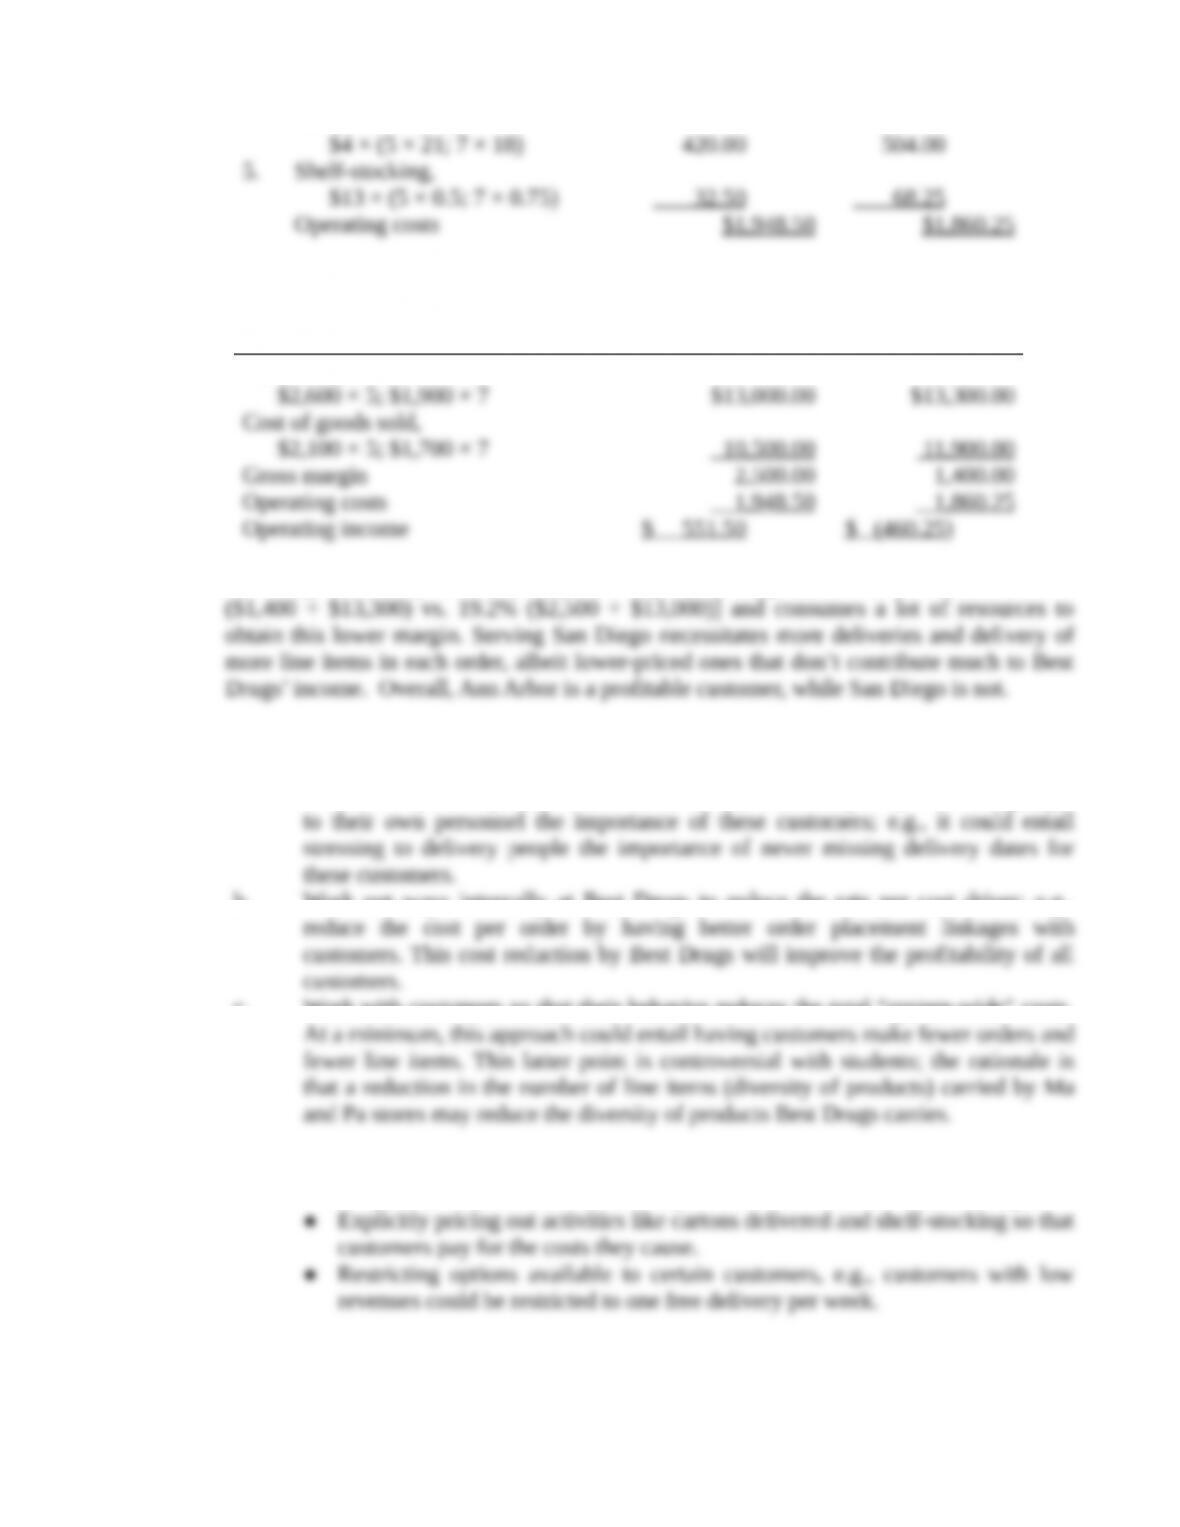
4. Carton deliveries,
The operating income of each customer is:
Ann Arbor
Pharmacy
San Diego
Pharmacy
Revenues,
San Diego Pharmacy has a lower gross margin percentage than does Ann Arbor [10.5%
2. Ways Best Drugs could use this information include:
a. Pay increased attention to the top 20% of the customers. This could entail asking
them for ways to improve service. Alternatively, Best Drugs may want to highlight
b. Work out ways internally at Best Drugs to reduce the rate per cost driver; e.g.,
c. Work with customers so that their behavior reduces the total “system-wide” costs.
There are several options here:
●Simple verbal persuasion by showing customers cost drivers at Best Drugs.
An even more extreme example is working with customers so that deliveries are
easier to make and shelf-stocking can be done faster.
d. Offer salespeople bonuses based on the operating income of each customer rather
than the gross margin of each customer.
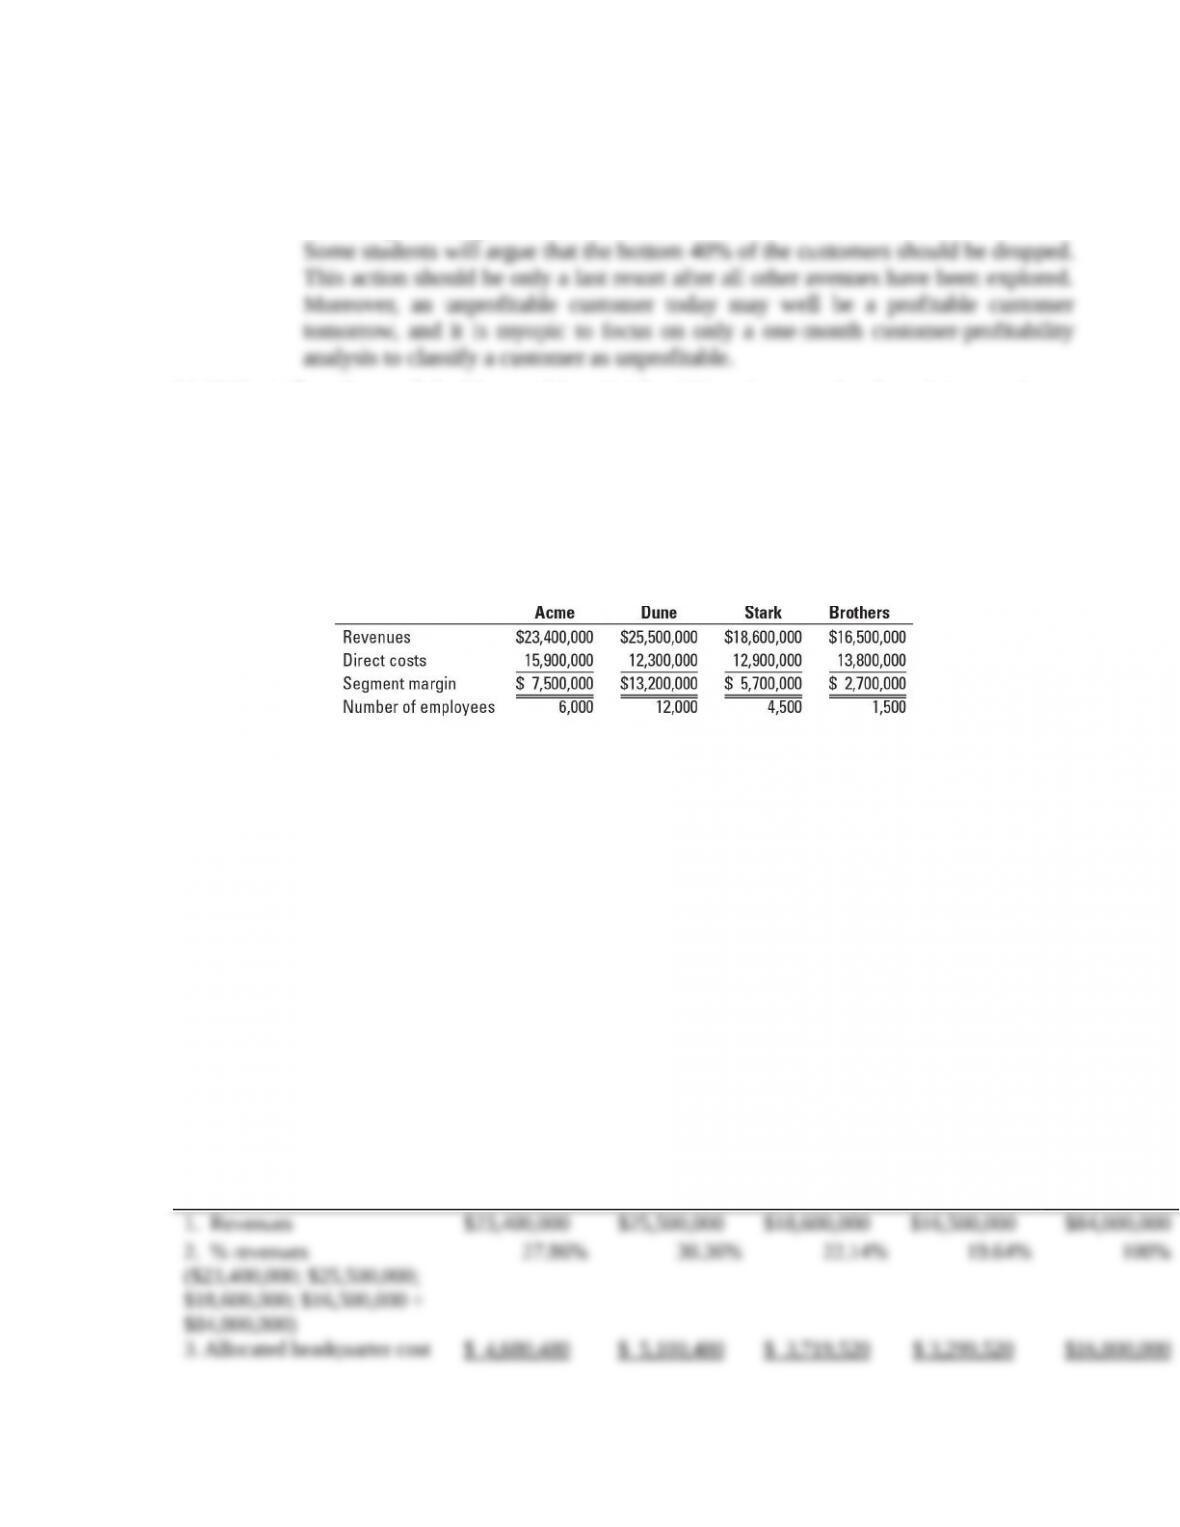
14-22Cost allocation and decision making. Reidland Manufacturing has four divisions: Acme,
Dune, Stark, and Brothers. Corporate headquarters is in Minnesota. Reidland corporate
headquarters incurs costs of $16,800,000 per period, which is an indirect cost of the divisions.
Corporate headquarters currently allocates this cost to the divisions based on the revenues of
each division. The CEO has asked each division manager to suggest an allocation base for the
indirect headquarters costs from among revenues, segment margin, direct costs, and number of
employees. The following is relevant information about each division:
Required:
1. Allocate the indirect headquarters costs of Reidland Manufacturing to each of the four
divisions using revenues, direct costs, segment margin, and number of employees as the
allocation bases. Calculate operating margins for each division after allocating headquarters
costs.
2. Which allocation base do you think the manager of the Brothers division would prefer?
Explain.
3. What factors would you consider in deciding which allocation base Reidland should use?
4. Suppose the Reidland CEO decides to use direct costs as the allocation base. Should the
Brothers division be closed? Why or why not?
SOLUTION
(15 min.) Cost allocation and decision making.
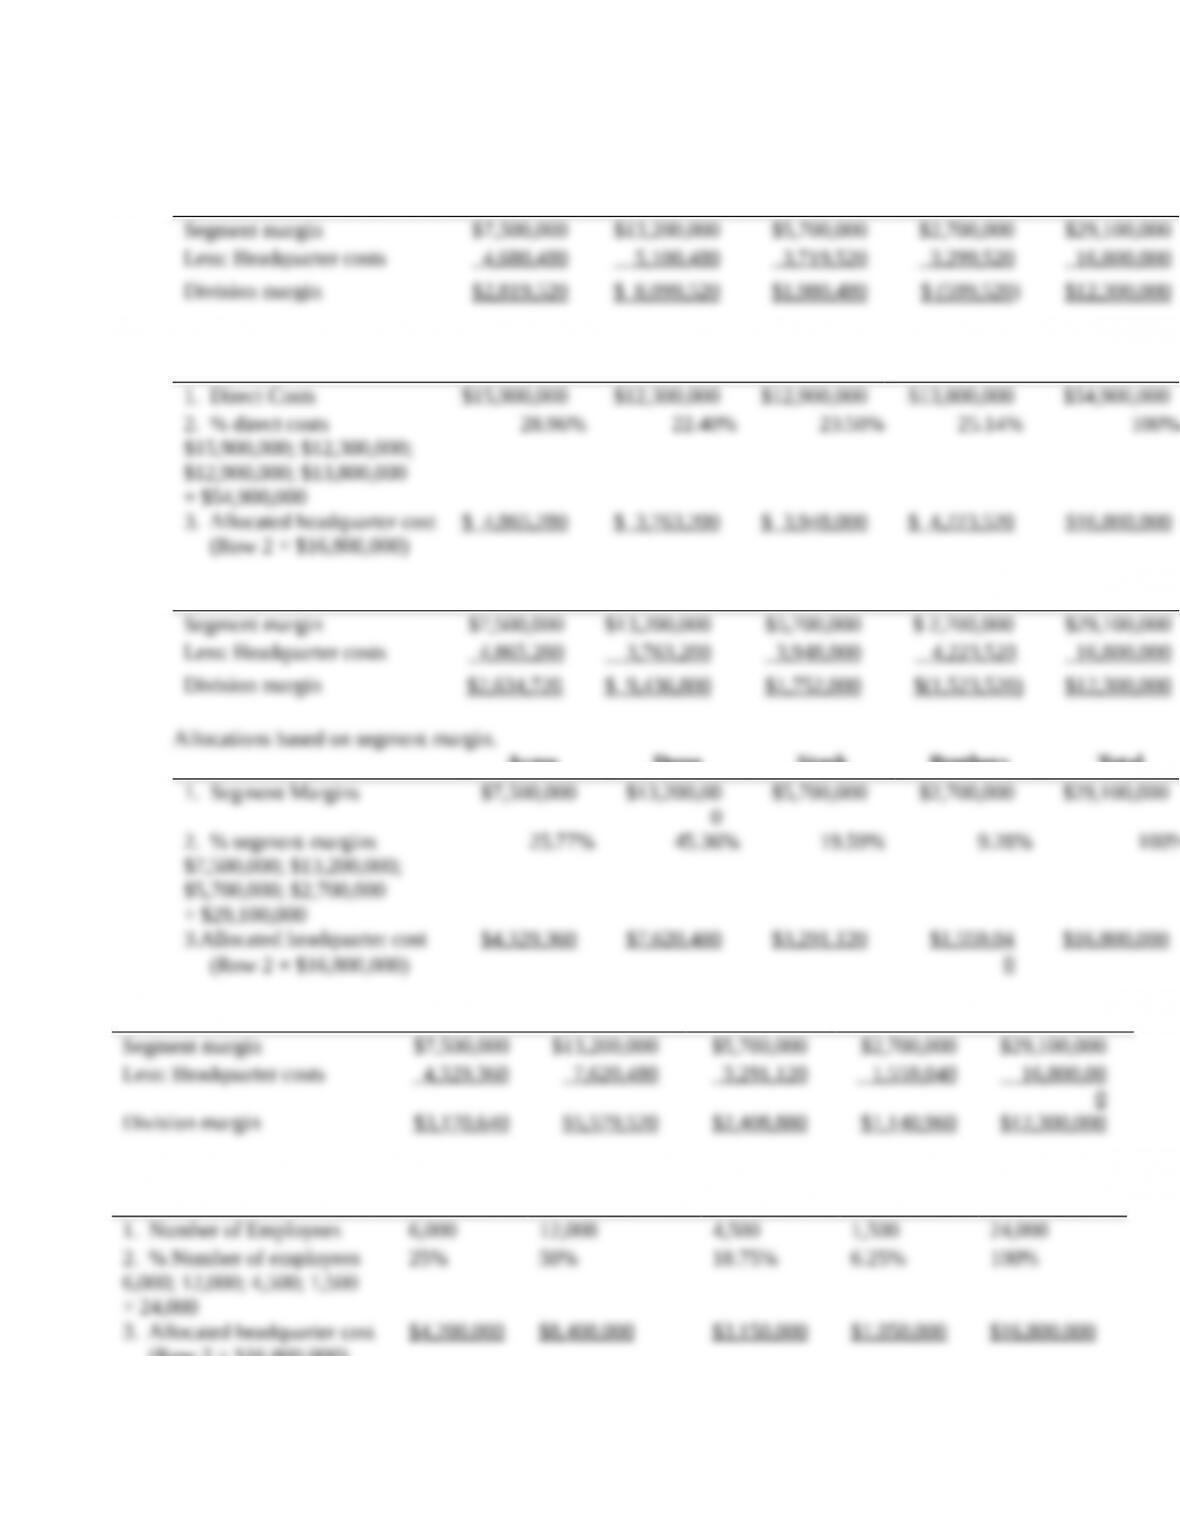
1. Allocations based on revenues.
Acme Dune Stark Brothers Total
(Row 2 × $16,800,000)
Acme Dune Stark Brothers Total
Allocations based on direct costs.
Acme Dune Stark Brothers Total
(Row 2 × $16,800,000)
Acme Dune Stark Brothers Total
Acme Dune Stark Brothers Total
(Row 2 × $16,800,000)
0
Acme Dune Stark Brothers Total
Allocations based on number of employees.
Acme Dune Stark Brothers Total
(Row 2 × $16,800,000)
Acme Dune Stark Brothers Total
0
2. The Brothers Division manager will prefer to use the number of employees as the
allocation base because it results in the highest operating margin for the division.
3. The Acme Division and the Stark Division receive roughly the same percentage allocation
of headquarter costs regardless of the allocation base used (Acme range = 25%–29%; Stark
Another alternative is to use segment margin as the allocation base on the grounds that
this best captures the ability of different divisions to bear corporate overhead costs.
4. If Reidland elects to use direct costs as the allocation base, the Brothers Division will
appear to have a $1,523,520 operating loss. Even so, the Brothers Division generates a
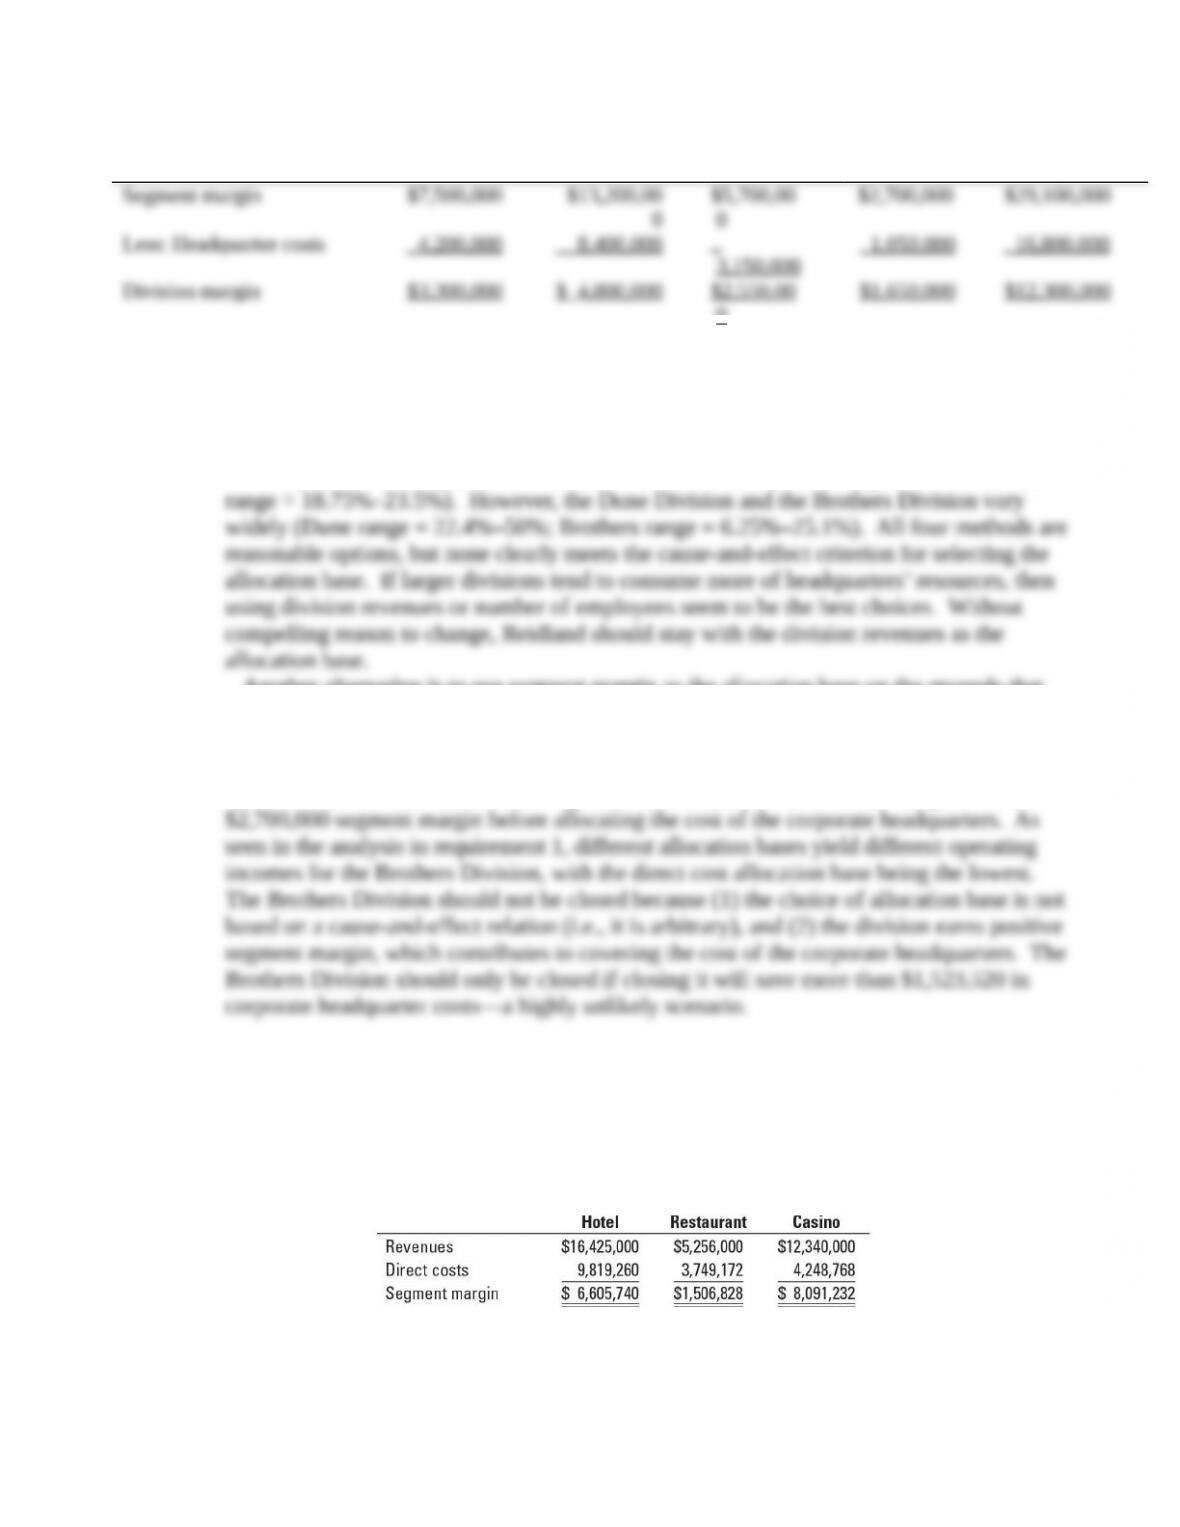
14-23Cost allocation to divisions. Rembrandt Hotel & Casino is situated on beautiful Lake
Tahoe in Nevada. The complex includes a 300-room hotel, a casino, and a restaurant. As
Rembrandt’s new controller, your manager asks you to recommend the basis the hotel should use
for allocating fixed overhead costs to the three divisions in 2017. You are presented with the
following income statement information for 2016:
You are also given the following data on the three divisions:
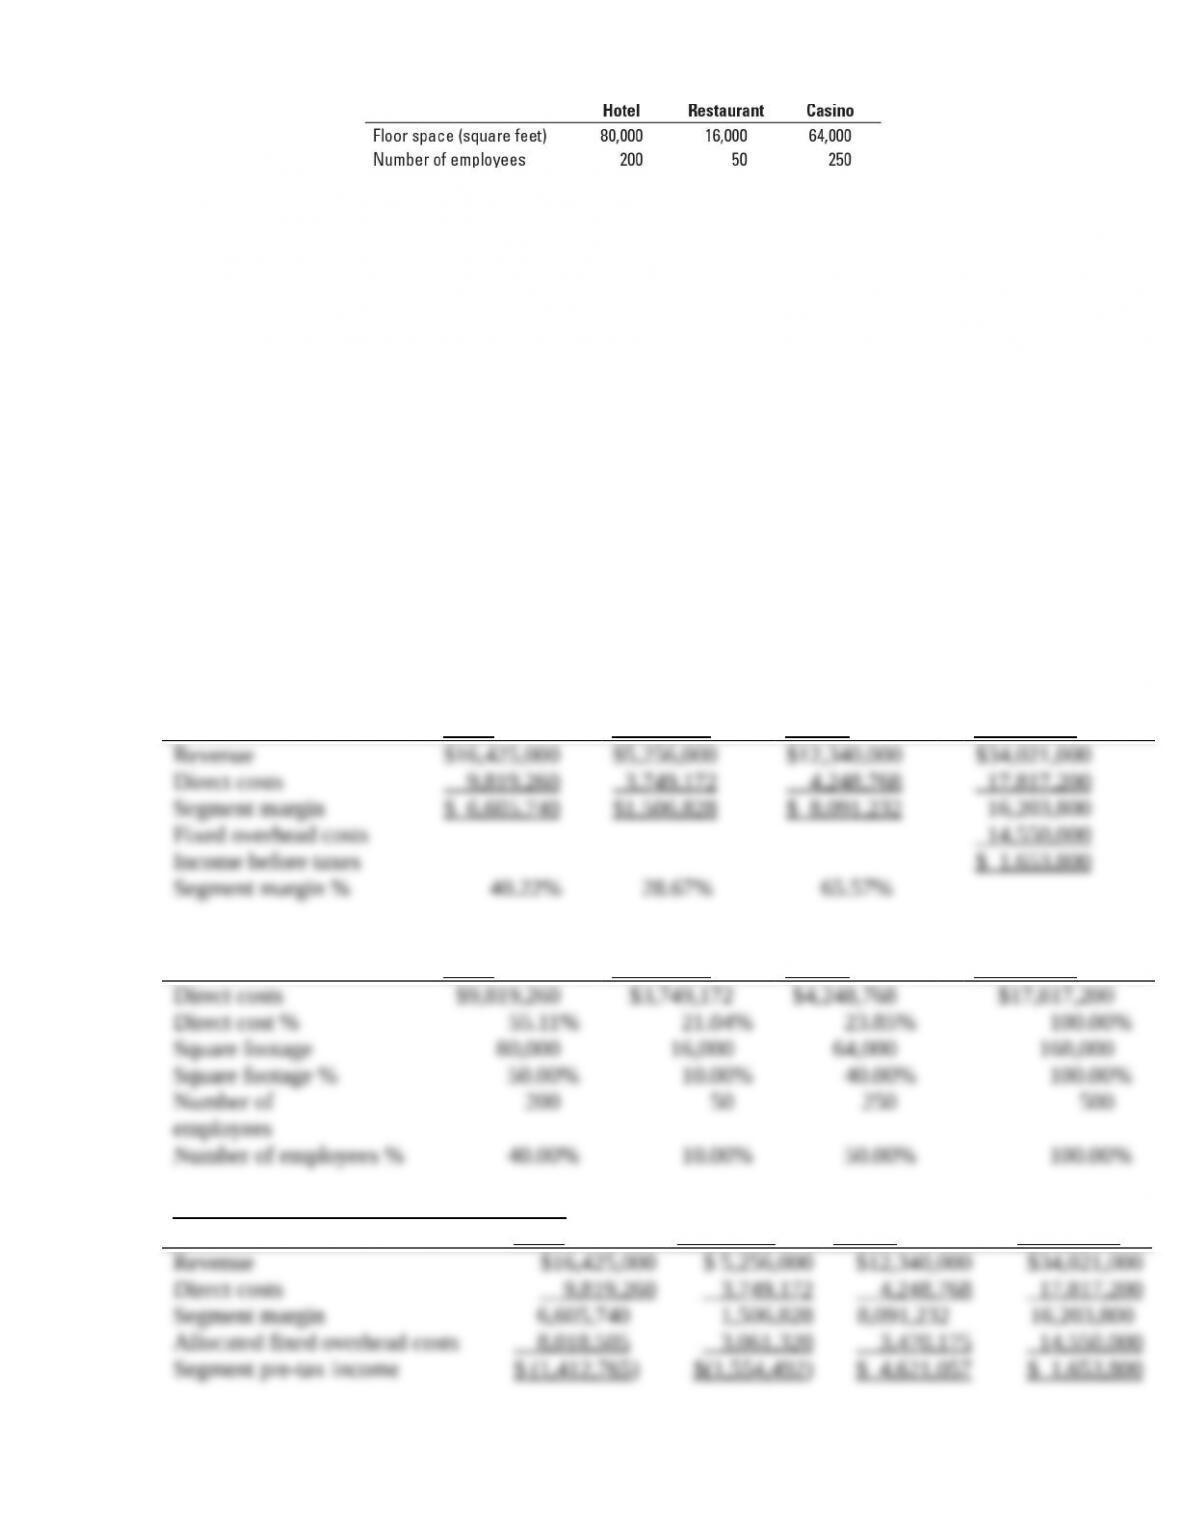
You are told that you may choose to allocate indirect costs based on one of the following: direct
costs, floor space, or the number of employees. Total fixed overhead costs for 2016 were
$14,550,000.
Required:
1. Calculate division margins in percentage terms prior to allocating fixed overhead costs.
2. Allocate indirect costs to the three divisions using each of the three allocation bases
suggested. For each allocation base, calculate division operating margins after allocations, in
dollars and as a percentage of revenues.
3. Discuss the results. How would you decide how to allocate indirect costs to the divisions?
Why?
4. Would you recommend closing any of the three divisions (and possibly reallocating resources
to other divisions) as a result of your analysis? If so, which division would you close and
why?
SOLUTION
(30 min.) Cost allocation to divisions.
1.
Hotel Restaurant Casino Rembrandt
2.
Hotel Restaurant Casino Rembrandt
A: Cost allocation based on direct costs:
Hotel Restaurant Casino Rembrandt
B: Cost allocation based on floor space:
Hotel Restaurant Casino Rembrandt
C: Cost allocation based on number of employees
Hotel Restaurant Casino Rembrandt
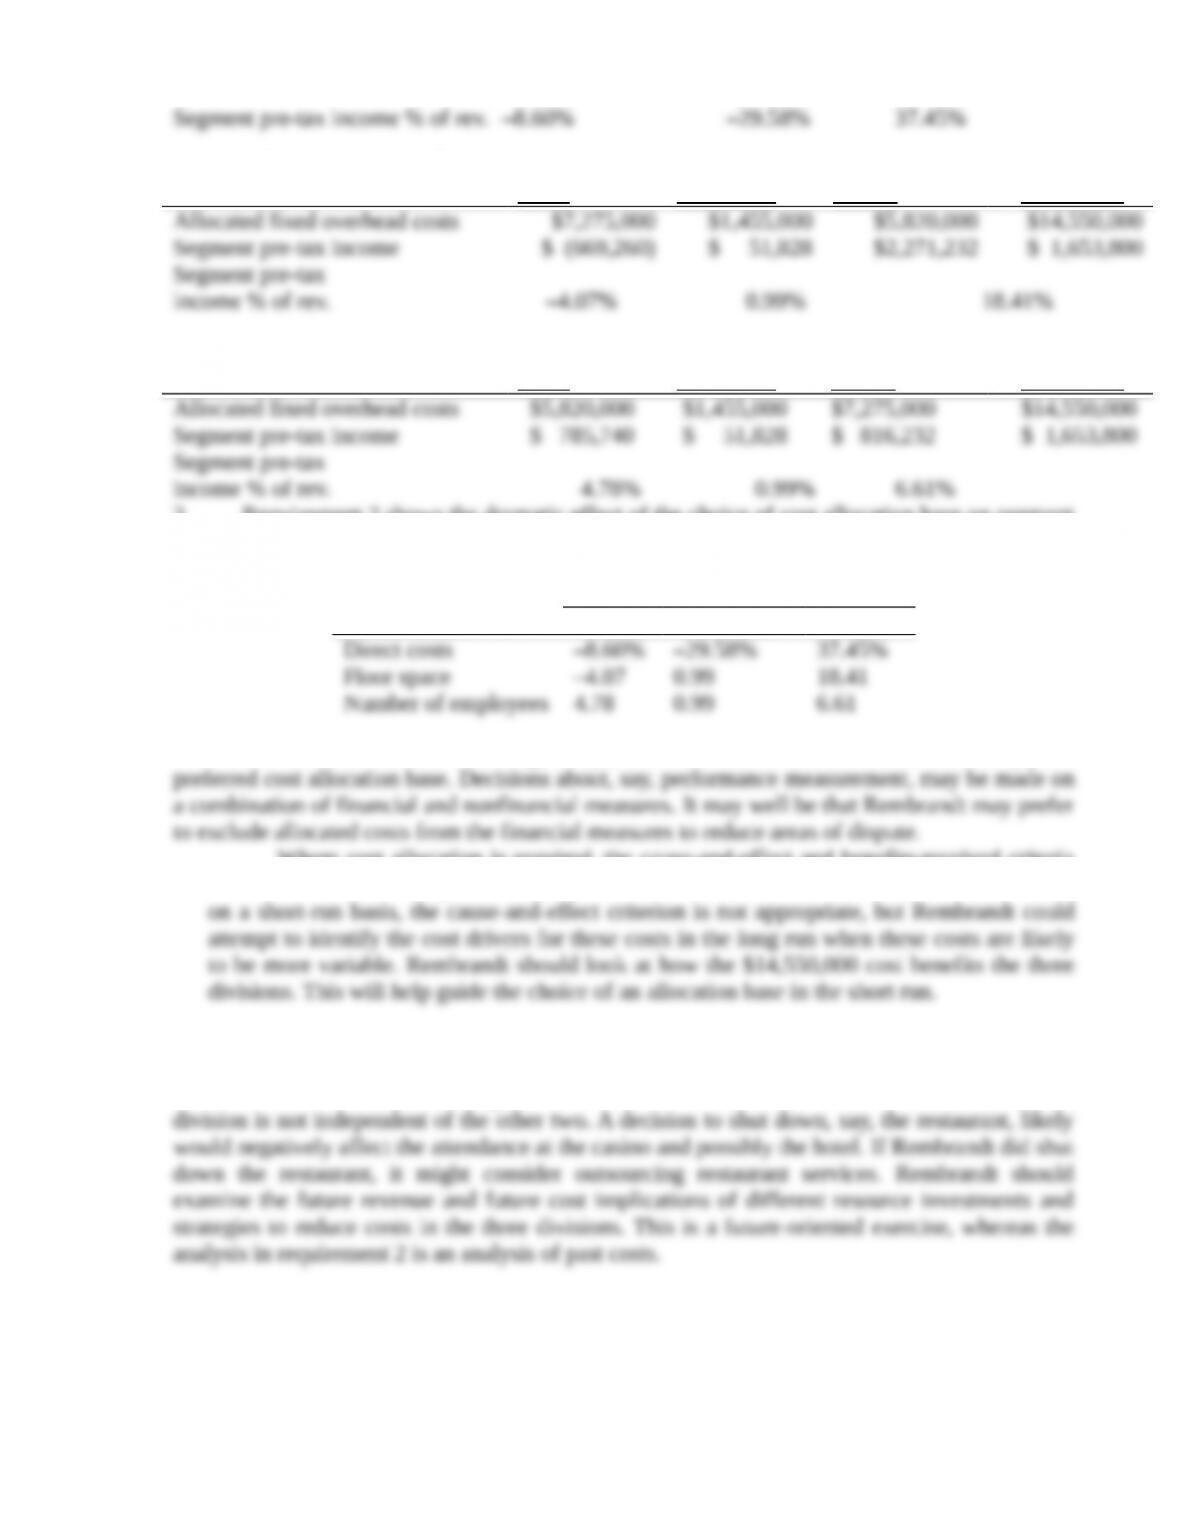
3. Requirement 2 shows the dramatic effect of the choice of cost allocation base on segment
pre-tax income as a percentage of revenues:
Pre-tax Income Percentage
Allocation Base Hotel Restaurant Casino
The decision context should guide (a) whether costs should be allocated and (b) the
Where cost allocation is required, the cause-and-effect and benefits-received criteria
are recommended in Chapter 14. The $14,550,000 is a fixed overhead cost. This means that
4. The analysis in requirement 2 should not guide the decision on whether to shut down any
of the divisions. The overhead costs are fixed costs in the short run. It is not clear how these
costs would be affected in the long run if Rembrandt shut down one of the divisions. Also, each
14-24Cost allocation to divisions. Bergen Corporation has three divisions: pulp, paper, and
fibers. Bergen’s new controller, David Fisher, is reviewing the allocation of fixed
corporate-overhead costs to the three divisions. He is presented with the following information
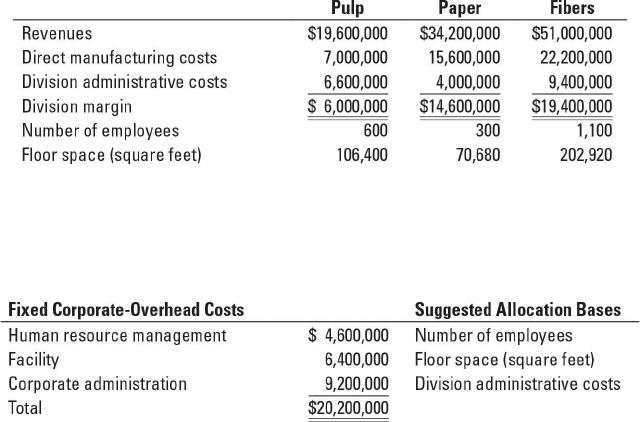
for each division for 2017:
Until now, Bergen Corporation has allocated fixed corporate-overhead costs to the divisions on
the basis of division margins. Fisher asks for a list of costs that comprise fixed corporate
overhead and suggests the following new allocation bases:
Required:
1. Allocate 2017 fixed corporate-overhead costs to the three divisions using division margin as
the allocation base. What is each division’s operating margin percentage (division margin
minus allocated fixed corporate-overhead costs as a percentage of revenues)?
2. Allocate 2017 fixed costs using the allocation bases suggested by Fisher. What is each
division’s operating margin percentage under the new allocation scheme?
3. Compare and discuss the results of requirements 1 and 2. If division performance incentives
are based on operating margin percentage, which division would be most receptive to the
new allocation scheme? Which division would be the least receptive? Why?
4. Which allocation scheme should Bergen Corporation use? Why? How might Fisher
overcome any objections that may arise from the divisions?