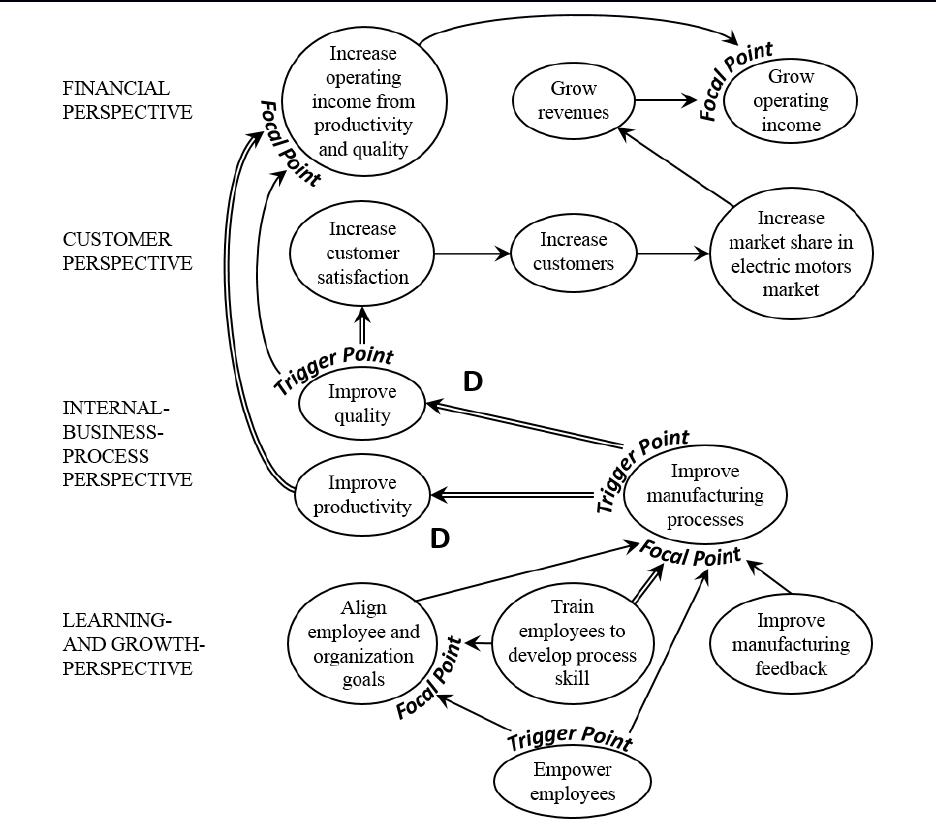
SOLUTION EXHIBIT 12-33B
Strategy Map for Scott Company
In the learning and growth perspective, Scott measures the percentage of employees trained in
quality management and the percentage of manufacturing processes with real-time feedback.
These objectives improve manufacturing processes, which has strong ties to improving
productivity and quality in the internal-business process perspective. Moreover, improving
quality and productivity are distinctive objectives. Improvements in these measures increase
customer satisfaction (as a strong tie) and market shares, which in turn increase revenues and
operating income. To see if the increases in operating income are coming from productivity
improvements, Scott measures the changes in operating income specifically attributable to
productivity and quality improvements. The strategy map suggests that Scott has a very good
implementation plan to successfully implement its strategies.
12-&
4. To achieve its goals, Scott could include the following measures under each perspective of the
balanced scorecard related to its strategy map:
Financial Perspective Operating income from productivity and quality improvement
Customer Perspective Market share
Internal-Business-Proces
Percentage of defective products sold
Learning-and-Growth
Perspective
Employee-satisfaction ratings
Percentage of employees trained in quality management
12-34 Strategic analysis of operating income (continuation of 12-33). Refer to Problem
12-33. As a result of the actions taken, quality has significantly improved in 2017 while rework
and unit costs of the Orlicon have decreased. Scott has reduced manufacturing capacity because
capacity is no longer needed to support rework. Scott has also lowered the Orlicon’s selling price
to gain market share and unit sales have increased. Information about the current period (2017)
and last period (2016) follows.
Conversion costs in each year depend on production capacity defined in terms of kits that can be
processed, not the actual kits started. Selling and customer-service costs depend on the number
of customers that Scott can support, not the actual number of customers it serves. Scott has 140
customers in 2016 and 160 customers in 2017.
Required:
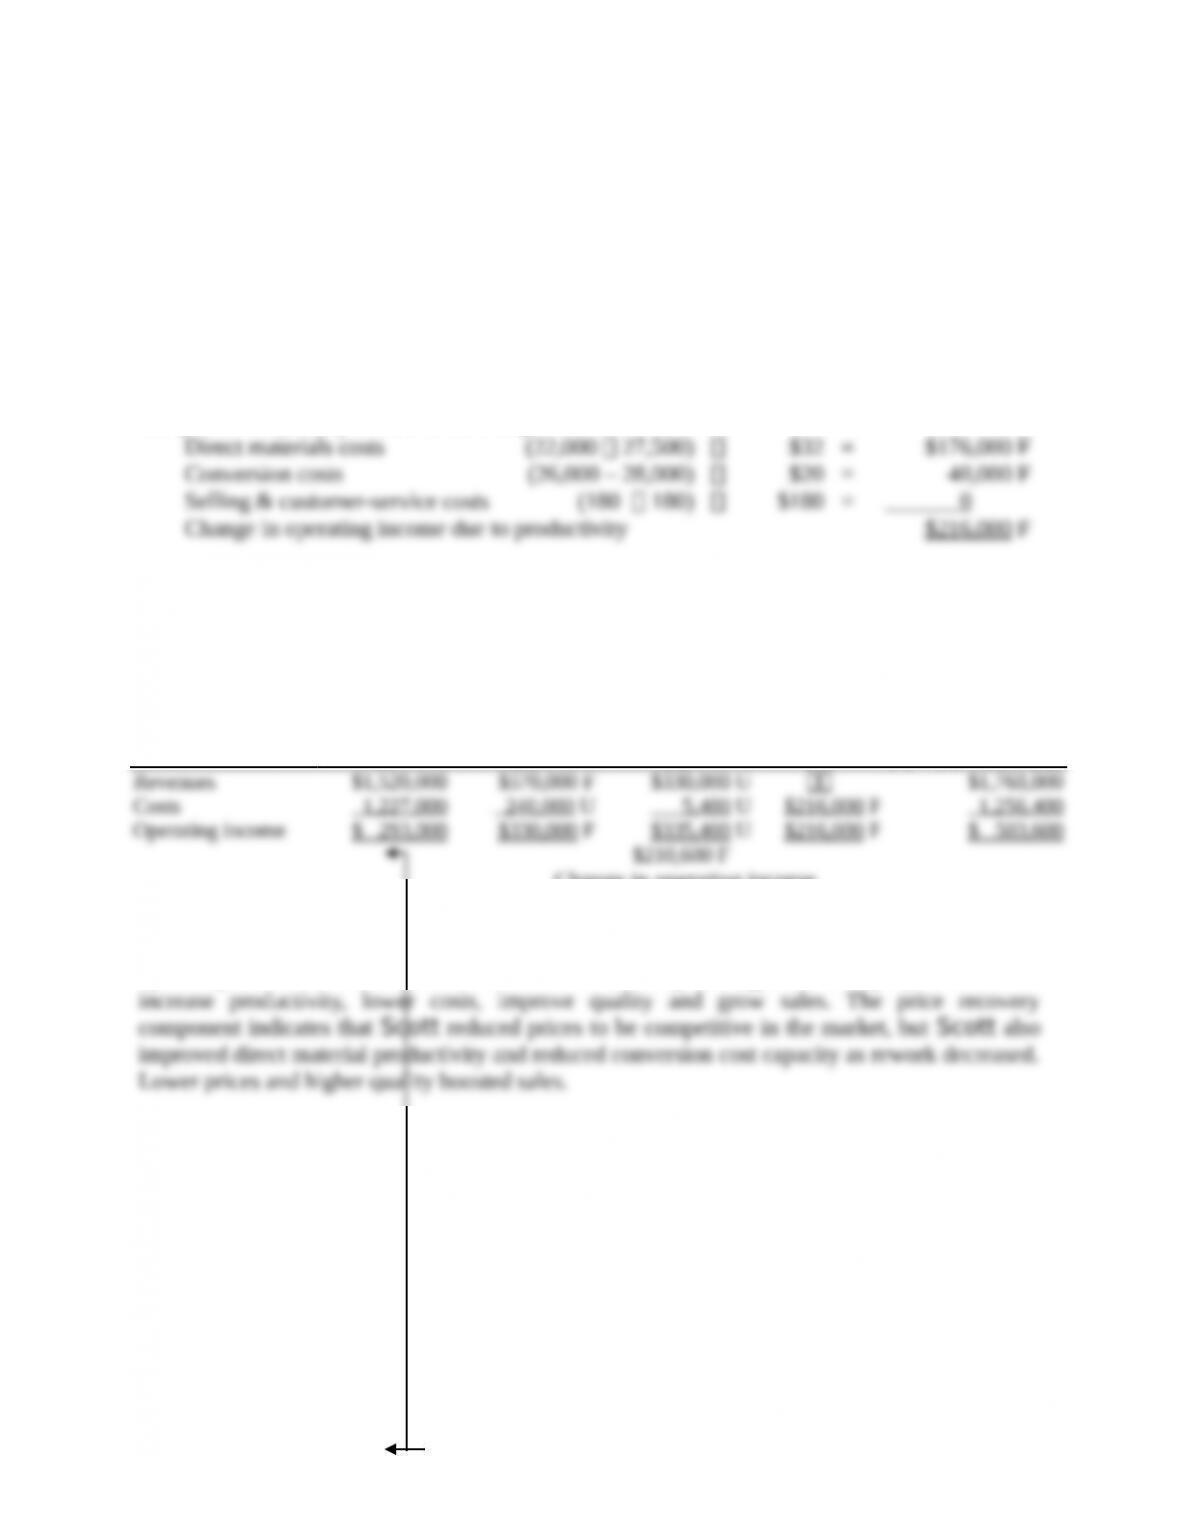
1. Calculate operating income of Scott Company for 2016 and 2017.
2. Calculate the growth, price-recovery, and productivity components that explain the change in
12-&
operating income from 2016 to 2017.
3. Comment on your answer in requirement 2. What do these components indicate?
SOLUTION
(25–30 min.) Strategic analysis of operating income (continuation of 12-33).
1. Operating income for each year is as follows:
2016 2017
Revenue ($95 16,000; $80 22,000) $1 ,520,000
$1,760,000
Costs
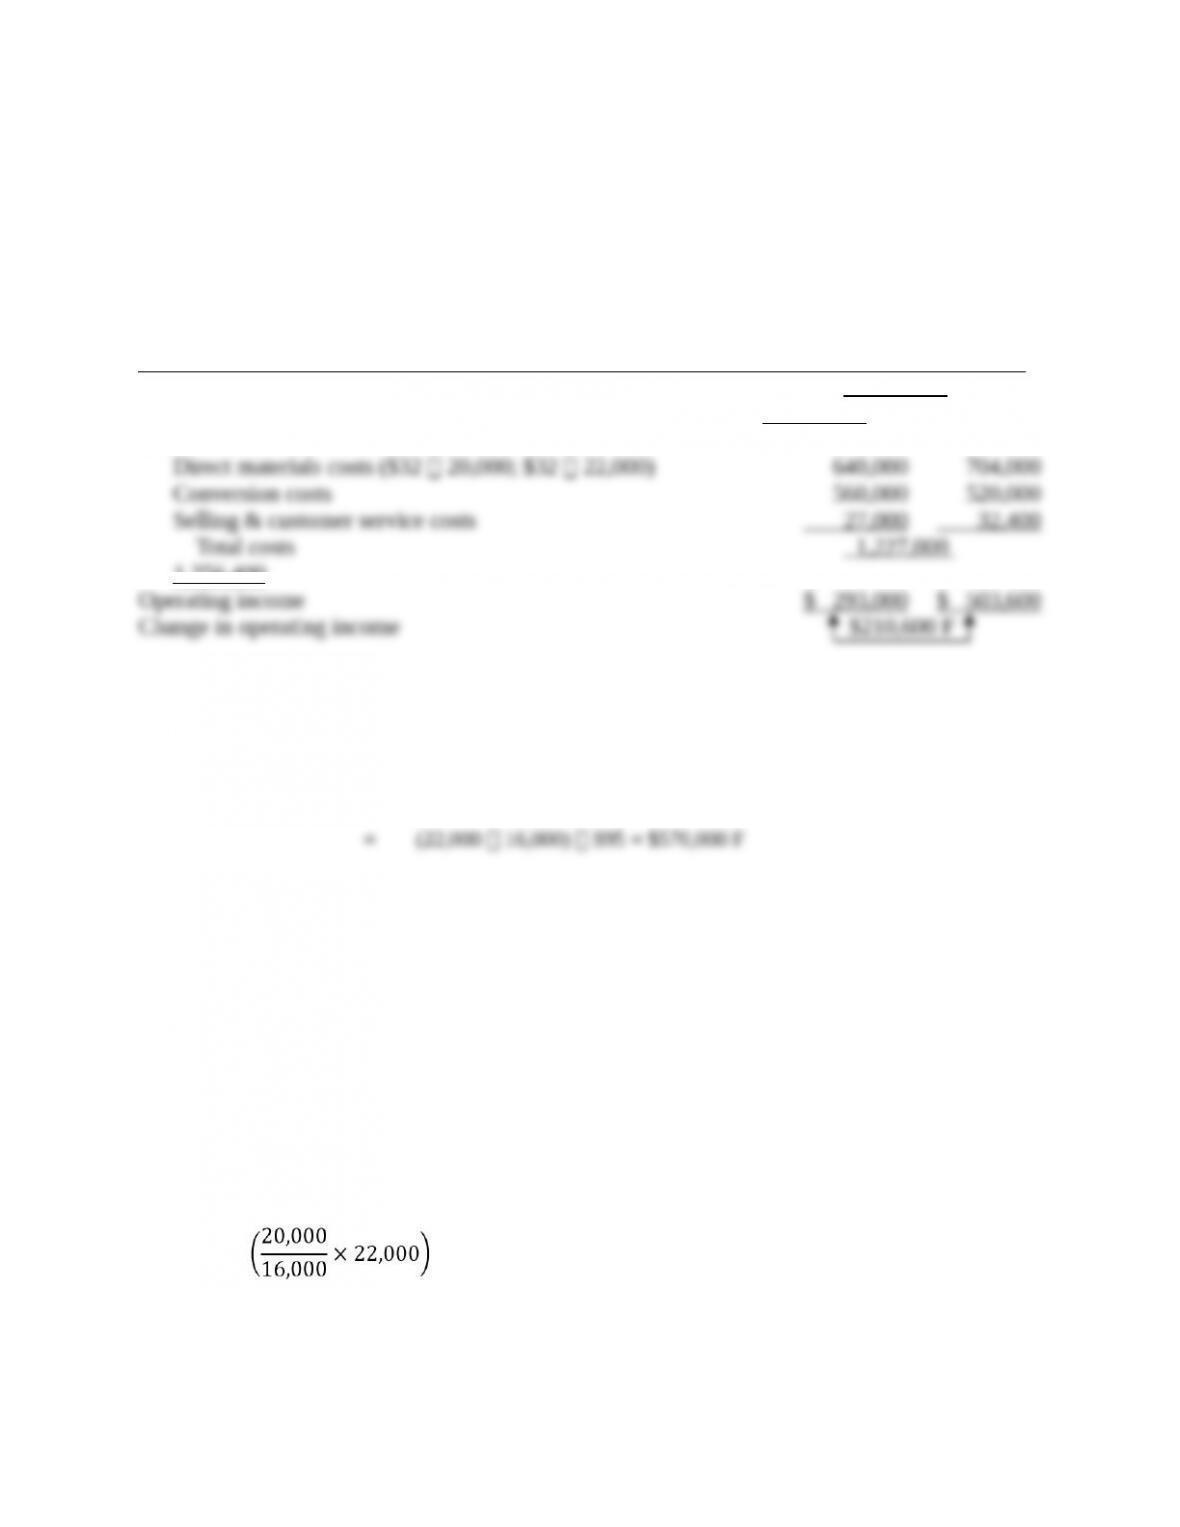
1,256,400
2. The Growth Component
Revenue effect
of growth
=
Actual units of Actual units of Selling
output sold output sold price
in 2017 in 2016 in 2016
– ´
æ ö
ç ÷
ç ÷
è ø
Cost effect of
growth for
variable costs
=
Units of Actual units
input required of inputs
to produce used to
2017 output produce
in 2016 2016 ouput
–
æ ö
ç ÷
ç ÷
ç ÷
è ø
´
Input
price
in 2017
Cost effect of
growth for
fixed costs
=
Actual units of capacity in Actual
2016 because adequate units of
capacity exists to produce capacity
2017 output in 2016 in 2016
–
æ ö
ç ÷
ç ÷
è ø
×
Price per unit
of capacity
in 2016
Direct materials that would be required in 2017 to produce 22,000 units instead of the 16,000
units produced in 2016, assuming the 2016 input-output relationship continued into 2017, equal
27,500 kits
10,000 11,000
8,000
æ ö
´
ç ÷
è ø
. That is, the number of kits to produce 22,000 units is
20,000 kits 16,000 units = 1.25 kits per unit 22,000 units = 27,500 kits. Conversion
costs and selling and customer-service capacity will not change because adequate capacity exists
in 2016 to support year 2017 output and customers.
12-&
The cost effects of growth component are:
Cost effect of growth $240 ,000 U
In summary, the net increase in operating income as a result of the growth component equals:
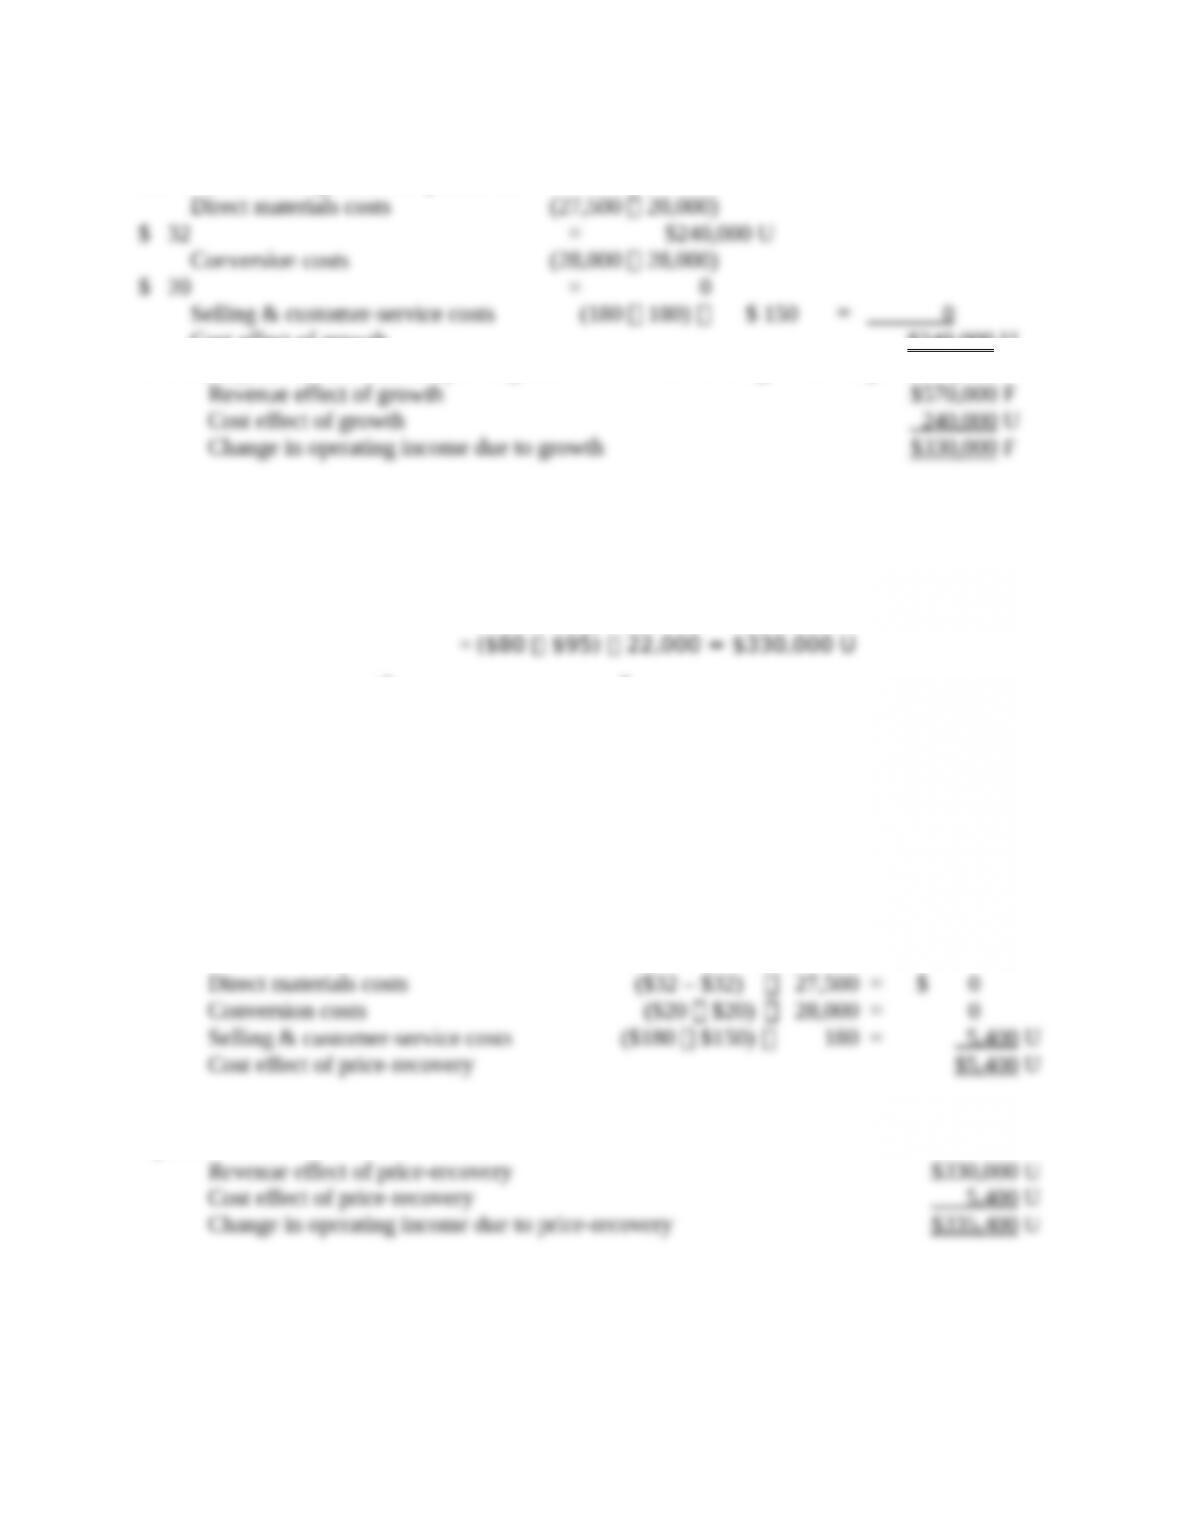
The Price-Recovery Component
Revenue effect of
price-recovery
()
Actual units
Selling price Selling price
= of output
in 2017 in 2016 sold in 2017
– ´
Cost effect of
price-recovery for
variable costs
=
Input Input
price in price in
2017 2016
–
æ ö
ç ÷
è ø
×
Units of input
required to
produce 2017
output in 2016
Cost effect of
price-recovery for
fixed costs
=
Price per Price per
unit of unit of
capacity capacity
in 2017 in 2016
–
æ ö
ç ÷
ç ÷
è ø
×
Actual units of capacity in
2016 because adequate
capacity exists to produce
2017 output in 2016
In summary, the net increase in operating income as a result of the price-recovery component
equals:
The Productivity Component
12-&
Cost effect of
productivity for
variable costs
=
Actual units of Units of input
input used required to
to produce produce 2017
2017 output ouput in 2016
–
æ ö
ç ÷
ç ÷
è ø
´
Input
price
in 2017
Cost effect of
productivity for
fixed costs
=
Actual Actual units of capacity in
units of 2016 because adequate
capacity capacity exists to produce
in 2017 2017 output in 2016
–
æ ö
ç ÷
ç ÷
è ø
´
Price per
unit of
capacity
in 2017
The productivity component of cost changes are
The change in operating income between 2016 and 2017 can be analyzed as follows:
Income
Statement
Amounts
in 2016
(1)
Revenue and
Cost Effects
of Growth
Component
in 2017
(2)
Revenue and
Cost Effects of
Price-Recovery
Component
in 2017
(3)
Cost Effect
of
Productivity
Component
in 2017
(4)
Income
Statement
Amounts
in 2017
(5) =
(1) + (2) + (3) + (4)
Change in operating income
3. The analysis of operating income indicates that a significant amount of the increase in
operating income resulted from Scott’s cost leadership strategy. The company was able to
12-35 Analysis of growth, price-recovery, and productivity components (continuation of
12-34). Suppose that during 2017, the market for DVD players grew 10%. All increases in market
share (that is, sales increases greater than 10%) and decreases in the selling price of the Orlicon
are the result of Scott’s strategic actions.
Required:
Calculate how much of the change in operating income from 2016 to 2017 is due to the
industry-market-size factor, product differentiation, and cost leadership. How does this relate to
12-&
Scott’s strategy and its success in implementation? Explain.
SOLUTION
(20 min.) Analysis of growth, price-recovery, and productivity
components (continuation of 12-34 and 12-35).
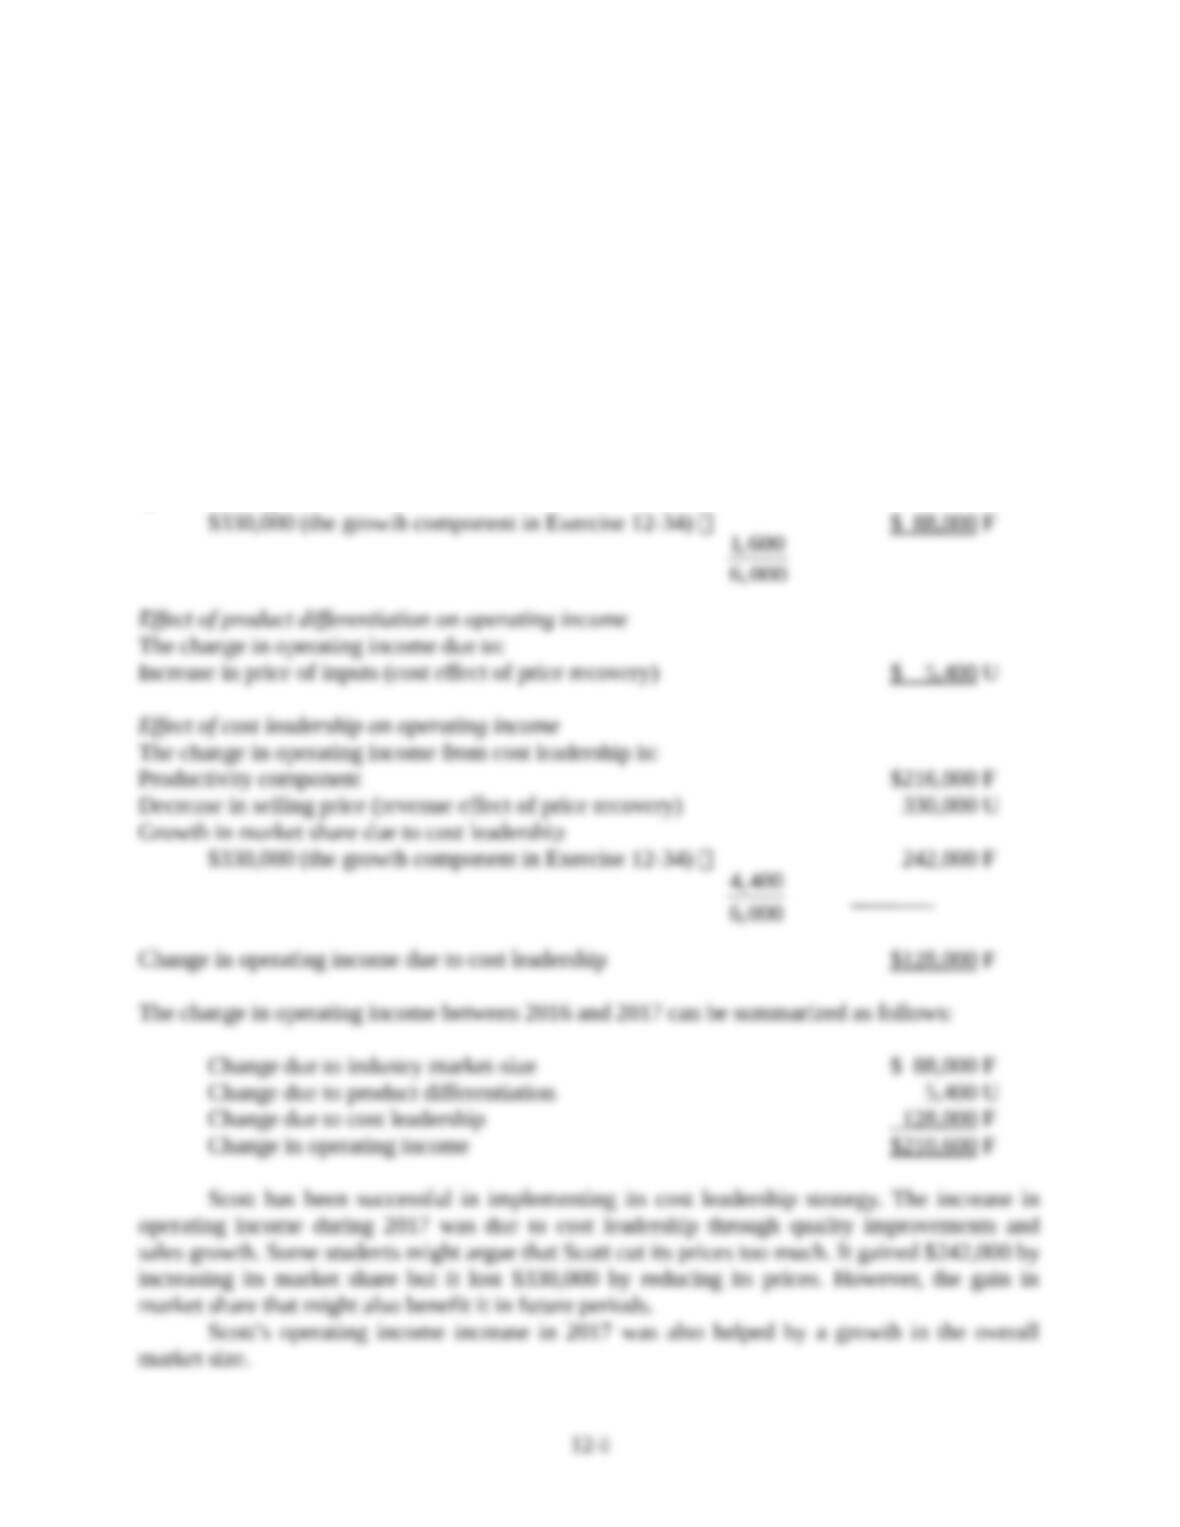
Effect of the industry-market-size factor on operating income
Of the 6,000-unit increase in sales from 16,000 to 22,000 units, 10% or 1,600 (10% 16,000)
units are due to growth in market size, and 4,400 (6,000 1,600) units are due to an increase in
market share.
The change in Scott’s operating income from the industry-market size factor rather than from
specific strategic actions is:
$330,000 (the growth component in Exercise 12-34)
1,600
6,000
$ 88 ,000 F
Effect of product differentiation on operating income
The change in operating income due to:
Increase in price of inputs (cost effect of price recovery) $ 5 ,400 U
Effect of cost leadership on operating income
The change in operating income from cost leadership is:
The change in operating income between 2016 and 2017 can be summarized as follows:
Scott has been successful in implementing its cost leadership strategy. The increase in
operating income during 2017 was due to cost leadership through quality improvements and
Scott’s operating income increase in 2017 was also helped by a growth in the overall
market size.
12-&
12-36 Identifying and managing unused capacity (continuation of 12-34). Refer to the
information for Scott Company in Problem 12-34.
Required:
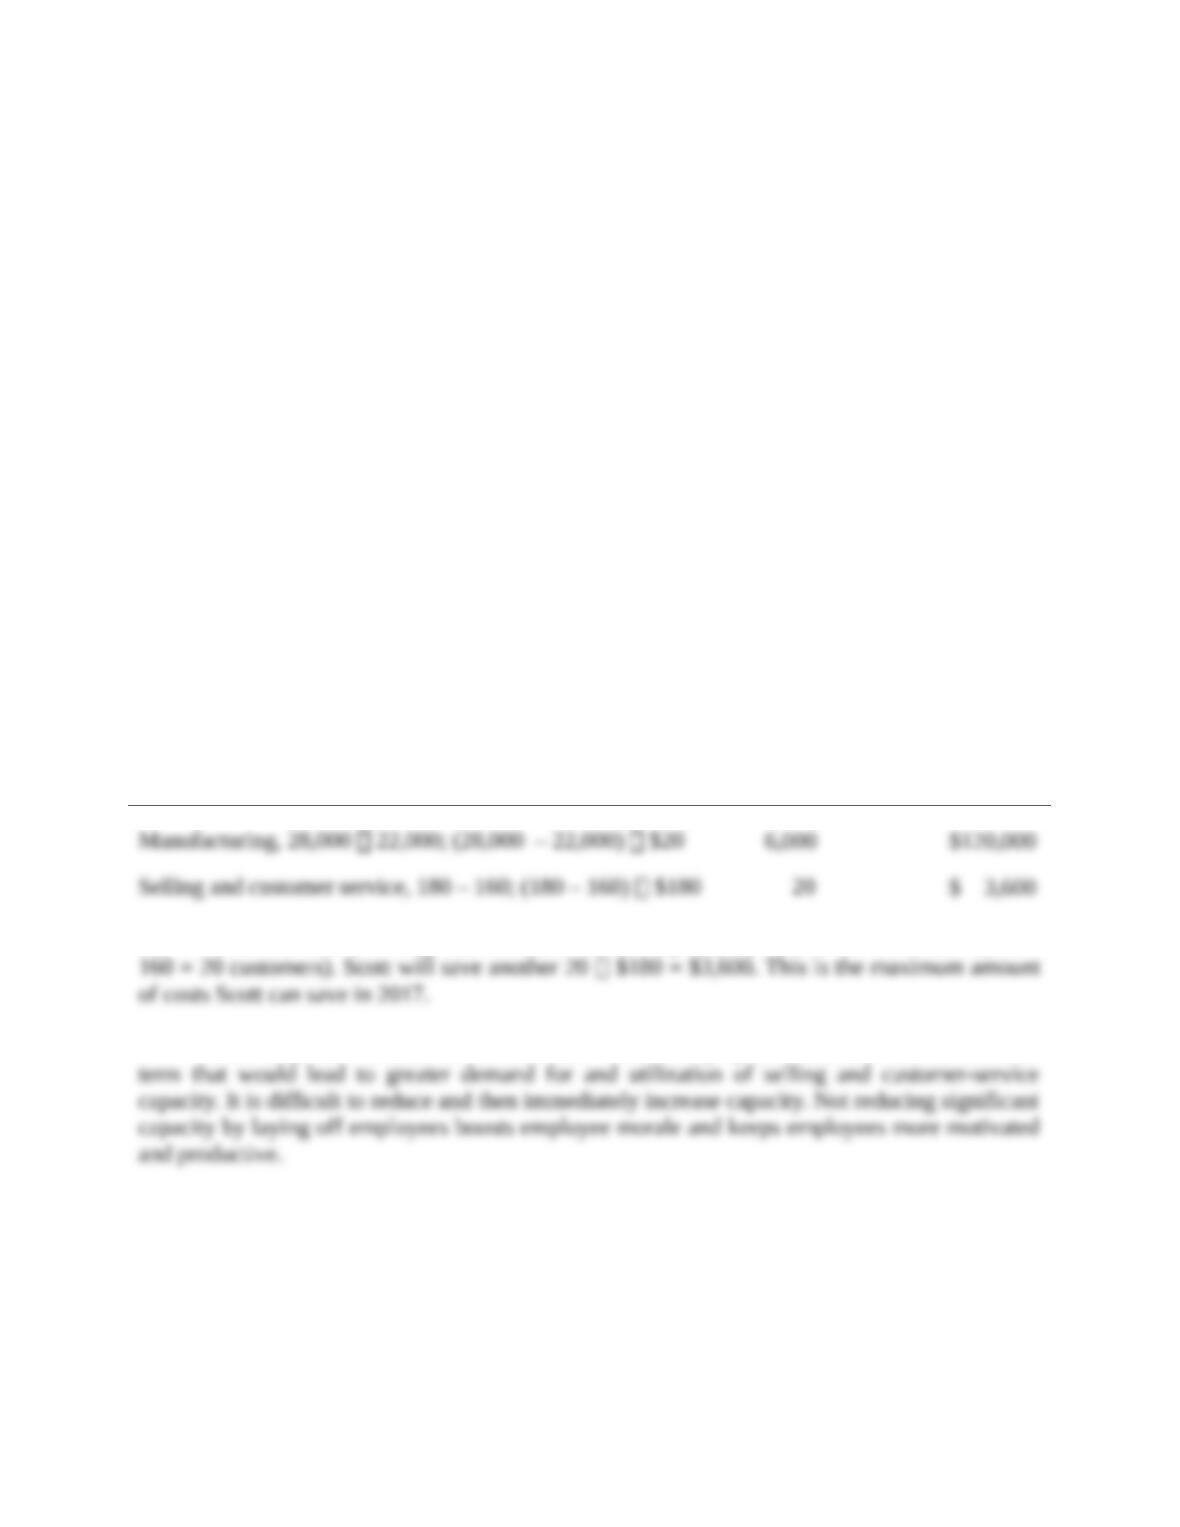
1. Calculate the amount and cost of (a) unused manufacturing capacity and (b) unused selling
and customer-service capacity at the beginning of 2017 based on actual production and actual
number of customers served in 2017.
2. Suppose Scott can add or reduce its selling and customer-service capacity in increments of 10
customers. What is the maximum amount of costs that Scott could save in 2017 by
downsizing selling and customer-service capacity?
3. Scott, in fact, does not eliminate any of its unused selling and customer-service capacity.
Why might Scott not downsize?
SOLUTION
(20 min.) Identifying and managing unused capacity (continuation of 12-34).
1. The amount and cost of unused capacity at the beginning of year 2017 when Scott makes
its capacity decisions for the year based on year 2017 production follows:
Amount of Cost of
Unused Unused
Capacity Capacity
2. Scott can reduce selling and customer-service capacity by another 20 customers (180 –
3. Scott may have chosen not to downsize because it projects sales increases in the near
12-37 Balanced scorecard. Following is a random-order listing of perspectives, strategic
objectives, and performance measures for the balanced scorecard.
12-&
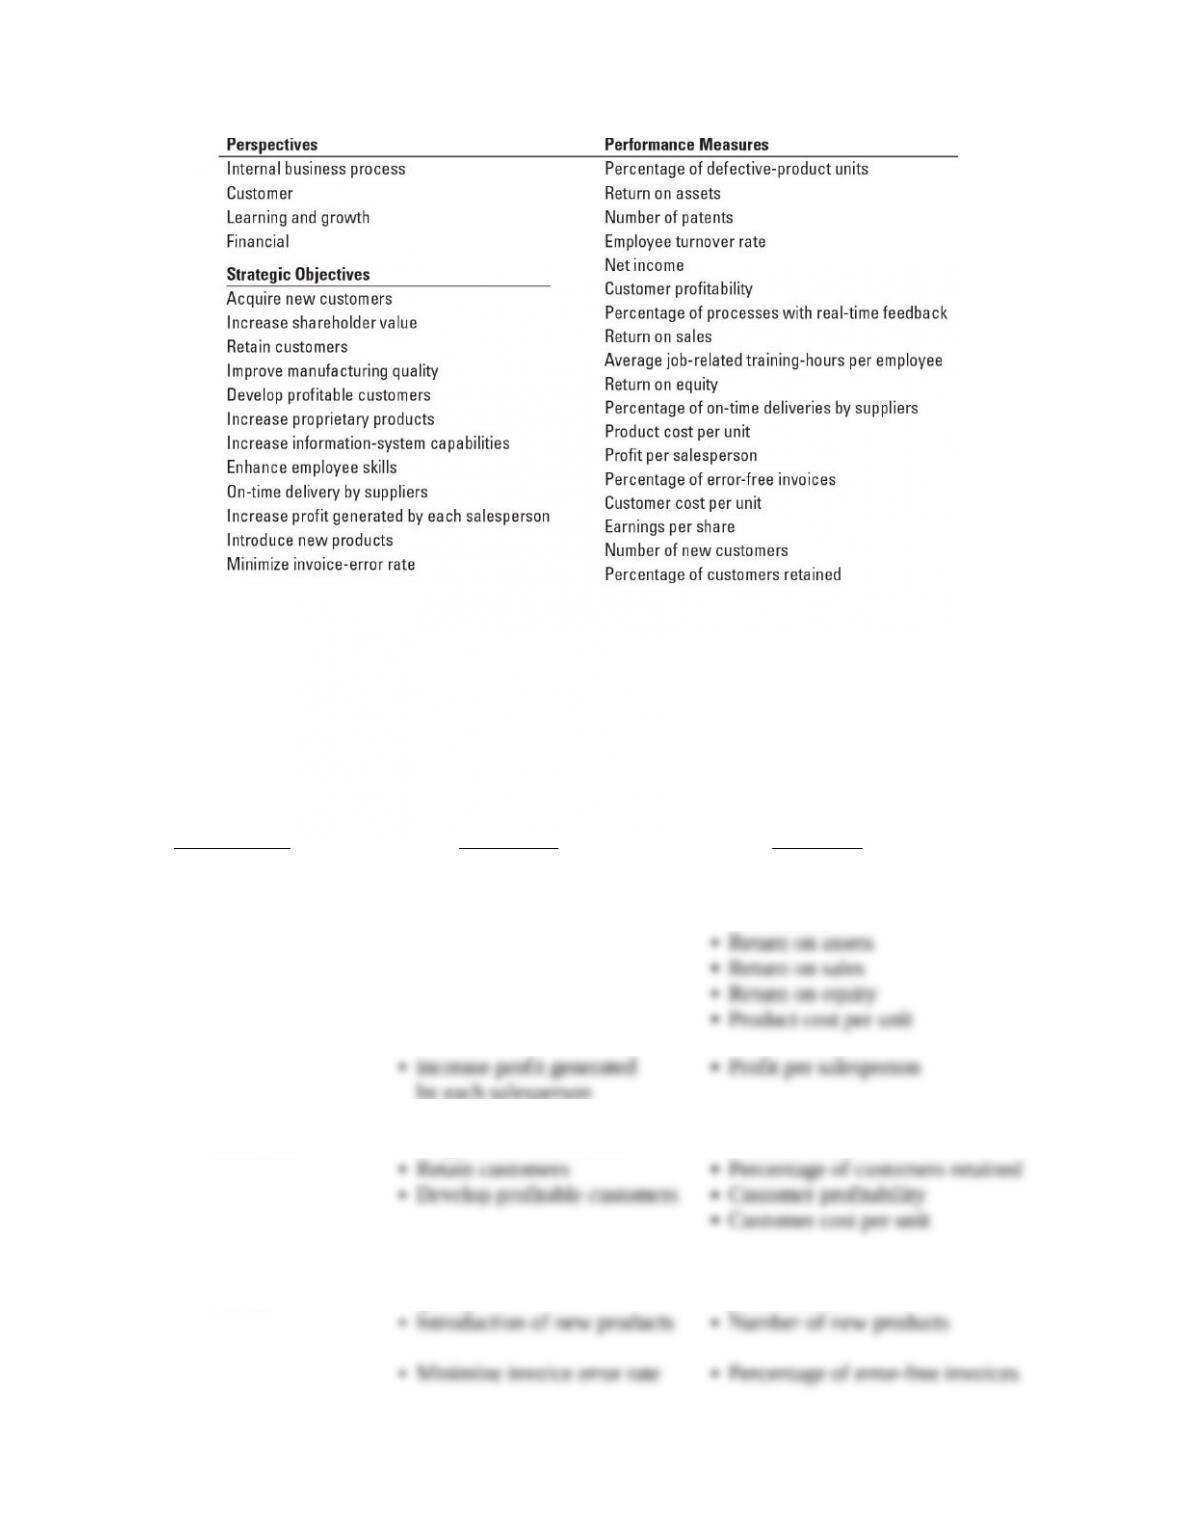
Required:
For each perspective, select those strategic objectives from the list that best relate to it. For each
strategic objective, select the most appropriate performance measure(s) from the list.
SOLUTION
(20–30 min.) Balanced scorecard.
Strategic Performance
Perspectives Objectives Measures
▪ Financial ▪ Increase shareholder value ▪ Earnings per share
▪ Net income
by each salesperson
▪ Customer ▪ Acquire new customers ▪ Number of new customers
▪ Internal Business ▪ Improve manufacturing ▪ Percentage of defective
Process quality product units
12-&
▪ Learning and ▪ Increase information system ▪ Percentage of processes with
Growth capabilities real-time feedback
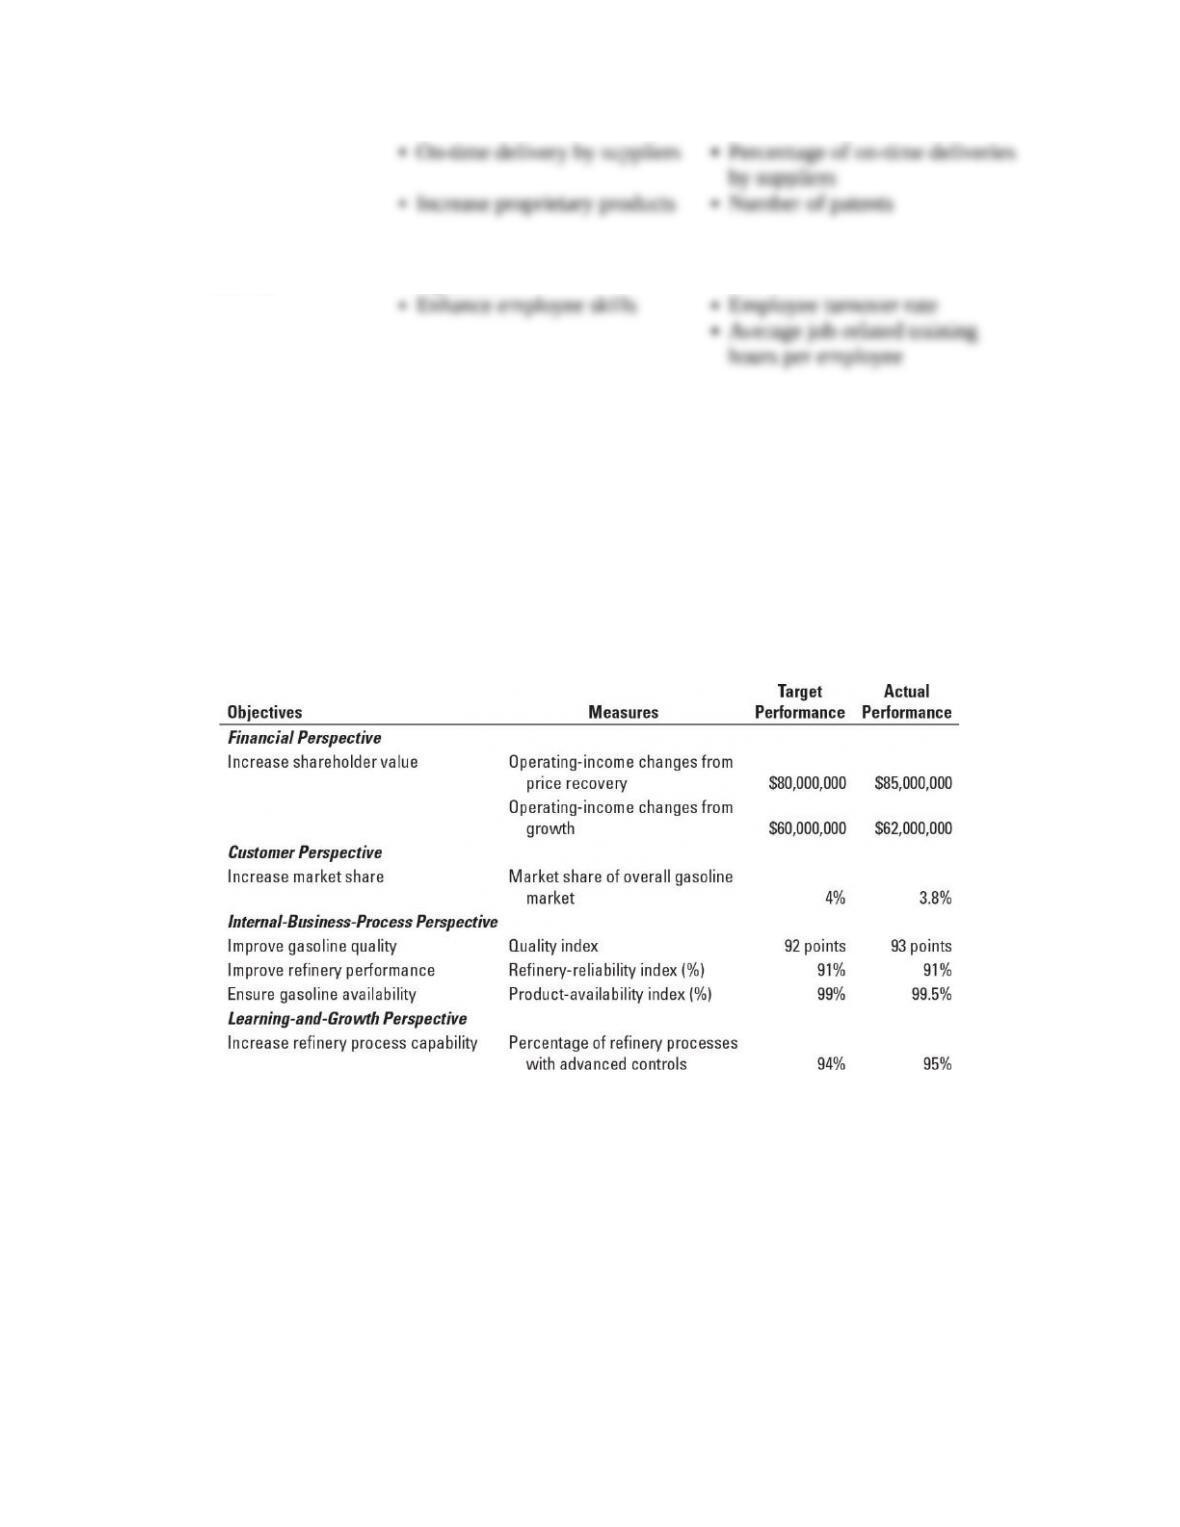
12-38 Balanced scorecard. (R. Kaplan, adapted) Petrocal, Inc., refines gasoline and sells it
through its own Petrocal gas stations. On the basis of market research, Petrocal determines that
60% of the overall gasoline market consists of “service-oriented customers,” medium- to
high-income individuals who are willing to pay a higher price for gas if the gas stations can
provide excellent customer service, such as a clean facility, a convenience store, friendly
employees, a quick turnaround, the ability to pay by credit card, and high-octane premium
gasoline. The remaining 40% of the overall market are “price shoppers” who look to buy the
cheapest gasoline available. Petrocal’s strategy is to focus on the 60% of service-oriented
customers. Petrocal’s balanced scorecard for 2017 follows. For brevity, the initiatives taken under
each objective are omitted.
Required:
1. Was Petrocal successful in implementing its strategy in 2017? Explain your answer.
2. Would you have included some measure of employee satisfaction and employee training in
the learning-and-growth perspective? Are these objectives critical to Petrocal for
implementing its strategy? Why or why not? Explain briefly.
3. Explain how Petrocal did not achieve its target market share in the total gasoline market but
still exceeded its financial targets. Is “market share of overall gasoline market” the correct
measure of market share? Explain briefly.
4. Is there a cause-and-effect linkage between improvements in the measures in the
internal-business-process perspective and the measure in the customer perspective? That is,
would you add other measures to the internal-business-process perspective or the customer
12-&
perspective? Why or why not? Explain briefly.
5. Do you agree with Petrocal’s decision not to include measures of changes in operating
income from productivity improvements under the financial perspective of the balanced
scorecard? Explain briefly.
SOLUTION
(20 min.) Balanced scorecard.
1. Petrocal’s strategy is to focus on “service-oriented customers” who are willing to pay a
Does the scorecard represent Petrocal’s strategy? By and large it does. The focus of the
scorecard is on measures of process improvement, quality, market share, and financial success
Having concluded that the scorecard has been reasonably well designed, how has Petrocal
performed relative to its strategy in 2017? It appears from the scorecard that Petrocal was
2. Yes, Petrocal should include some measure of employee satisfaction and employee
training in the learning and growth perspective. Petrocal’s differentiation strategy and ability to
charge a premium price is based on customer service. The key to good, fast, and friendly
3. Petrocal’s strategy is to focus on the 60% of gasoline consumers who are
service-oriented, not on the 40% price-shopper segment. To evaluate if it has been successful in
12-&
4. Although there is a cause-and-effect link between internal business process measures and
customer measures on the current scorecard, Petrocal should add more measures to tighten this
linkage. In particular, the current scorecard measures focus exclusively on refinery operations
5. Petrocal is correct in not measuring changes in operating income from productivity
improvements on its scorecard under the financial perspective. Petrocal’s strategy is to grow by
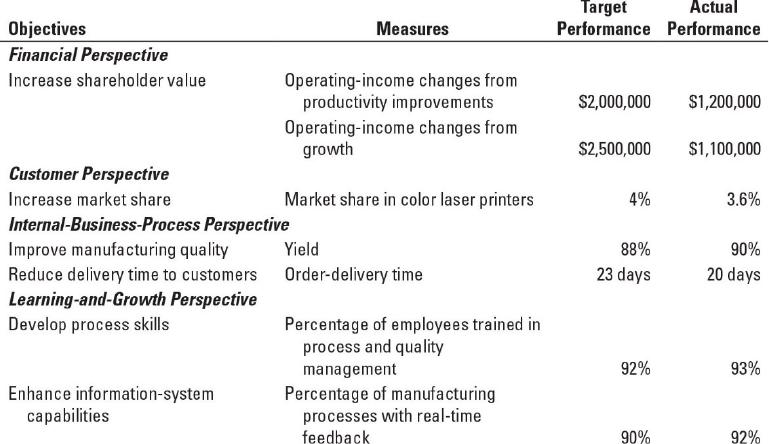
12-39 Balanced scorecard. Vic Corporation manufactures various types of color laser printers
in a highly automated facility with high fixed costs. The market for laser printers is competitive.
The various color laser printers on the market are comparable in terms of features and price. Vic
believes that satisfying customers with products of high quality at low costs is important to
achieving its target profitability. For 2017, Vic plans to achieve higher quality and lower costs by
improving yields and reducing defects in its manufacturing operations. Vic will train workers and
encourage and empower them to take the necessary actions. Currently, a significant amount of
Vic’s capacity is used to produce products that are defective and cannot be sold. Vic expects that
higher yields will reduce the capacity that Vic needs to manufacture products. Vic does not
anticipate that improving manufacturing will automatically lead to lower costs because many
costs are fixed costs. To reduce fixed costs per unit, Vic could lay off employees and sell
equipment, or it could use the capacity to produce and sell more of its current products or
improved models of its current products.
Vic’s balanced scorecard (initiatives omitted) for the just-completed fiscal year 2017 follows.
12-&
Required:
1. Was Vic successful in implementing its strategy in 2017? Explain.
2. Is Vic’s balanced scorecard useful in helping the company understand why it did not reach its
target market share in 2017? If it is, explain why. If it is not, explain what other measures you
might want to add under the customer perspective and why.
3. Would you have included some measure of employee satisfaction in the learning-and-growth
perspective and new-product development in the internal-business-process perspective? That
is, do you think employee satisfaction and development of new products are critical for Vic
to implement its strategy? Why or why not? Explain briefly.
4. What problems, if any, do you see in Vic improving quality and significantly downsizing to
eliminate unused capacity?
12-&