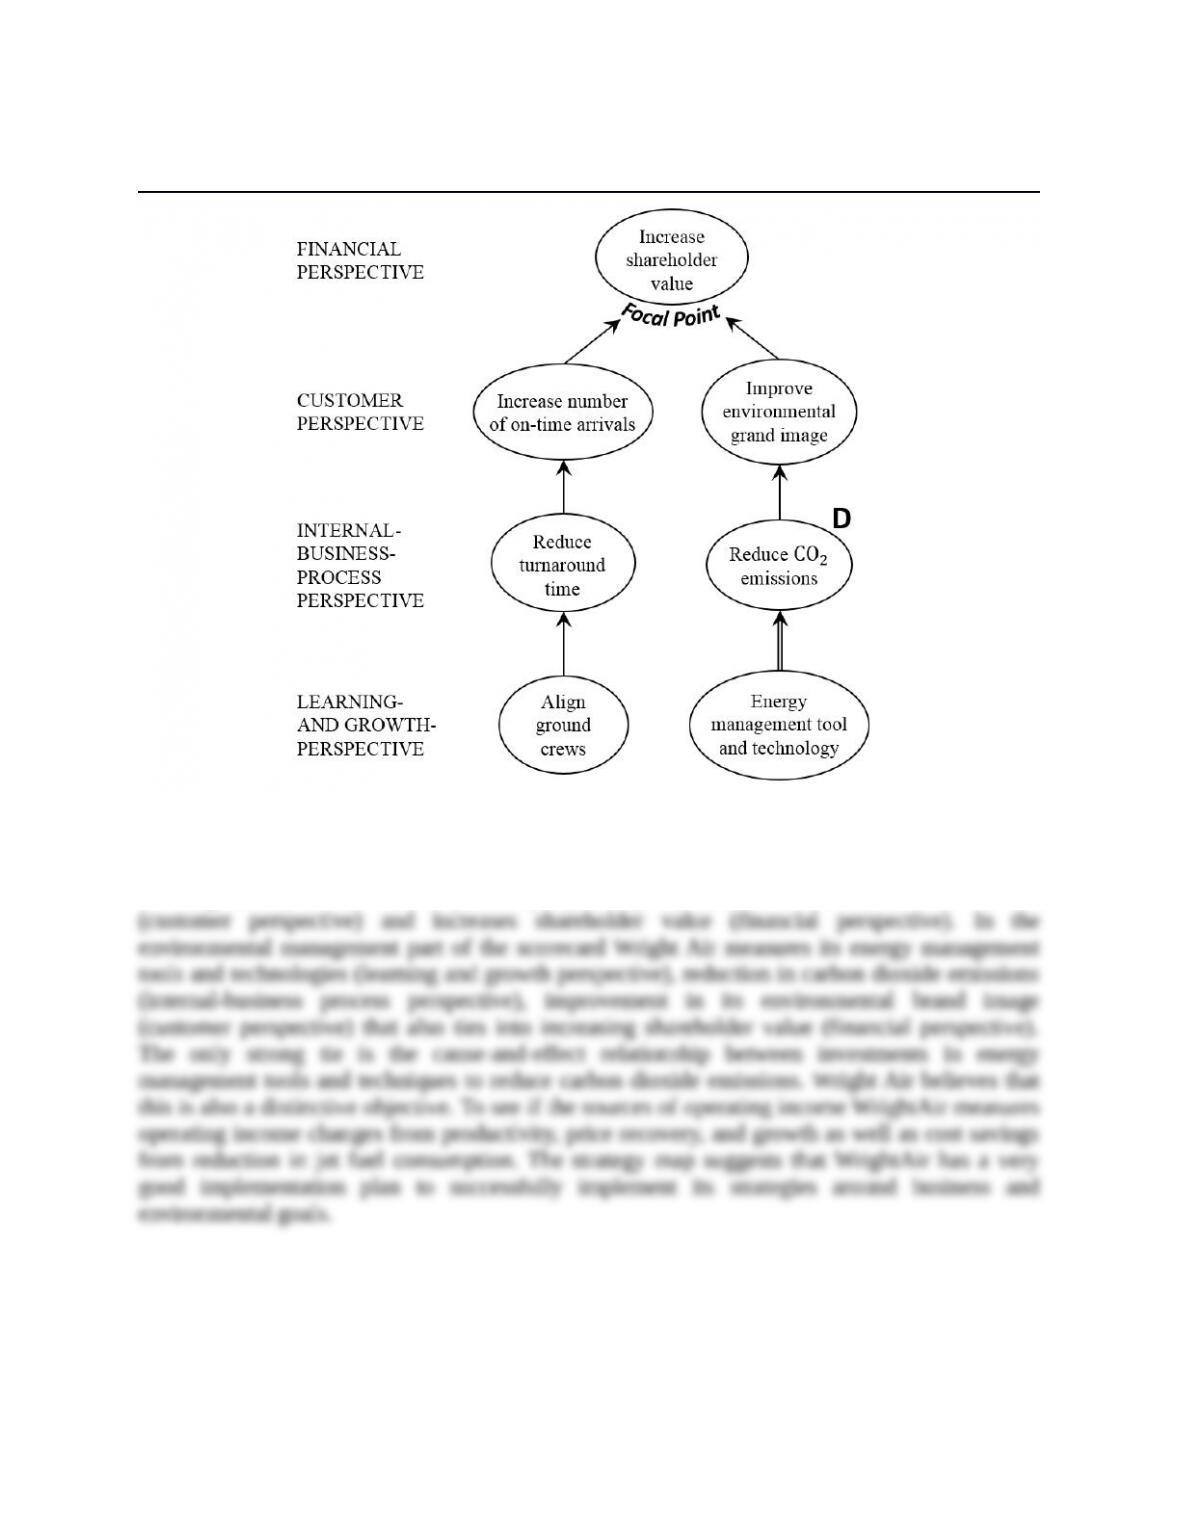
SOLUTION EXHIBIT 12-42A
Strategy Map for WrightAir
On the business side of the balanced scorecard, WrightAir measures the motivation of
ground crew (learning and growth perspective) that helps to reduce turnaround time of the planes
on the ground (internal business process perspective), increases the number of on-time arrivals
3. Normally, the price recovery component indicates that a company has been successful in
differentiating its product or service to command a price premium so that the prices of outputs
rise faster than the prices of inputs. For WrightAir, the price recovery component measures the
12-+
4. I would not have included customer-service measures in WrightAir’s customer
perspective because it is not part of WrightAir’s strategy. WrightAir does not compete with other
5. Yes, WrightAir should include some measure of employee satisfaction and employee
training in the learning and growth perspective. WrightAir’s low-cost strategy is based on
efficiency. The key to good, fast, and friendly customer service is well trained and satisfied
6. WrightAir included social and environmental performance measures in its balanced
scorecard because it believes strong environmental and social performance gives it a competitive
advantage by (1) attracting and inspiring outstanding employees, (2) enhancing its reputation
Following the concept of shared value, Smooth Air includes social and environmental
measures (together with business goals and measures) in its balanced scorecard to evaluate how
well it is doing toward achieving its social and environmental goals. The balanced scorecard
indicates that WrightAir’s social and environmental initiatives are by and large succeeding.
12-+
Not all companies believe in implementing sustainability goals, but those that do find the
12-43 Partial-productivity measurement. Gable Company manufactures wallets from fabric.
In 2016, Gable made 2,160,000 wallets using 1,600,000 yards of fabric. In 2016, Gable has
capacity to make 2,448,000 wallets and incurs a cost of $8,568,000 for this capacity. In 2017,
Gable plans to make 2,203,200 wallets, make fabric use more efficient, and reduce capacity.
Suppose that in 2017 Gable makes 2,203,200 wallets, uses 1,440,000 yards of fabric, and
reduces capacity to 2,295,000 wallets at a cost of $7,803,000.
Required:
1. Calculate the partial-productivity ratios for materials and conversion (capacity costs) for
2017, and compare them to a benchmark for 2016 calculated based on 2017 output.
2. How can Gable Company use the information from the partial-productivity calculations?
SOLUTION
(20 min.) Partial productivity measurement.
1. Gable Company’s partial productivity ratios in 2017 are as follows:
Direct materials
partial productivity
=
Quantity of output produced in 2017
Yards of direct materials used in 2017
=
2, 203, 200
1, 440, 000
=
1.53 wallets
per yard
Conversion costs
partial productivity
=
Quantity of output produced in 2017
Units of manuf. capacity in 2017
=
2, 203, 200
2, 295, 000
=
0.96 wallets
per unit of
capacity
To compare partial productivities in 2017 with partial productivities in 2016, we first calculate
the inputs that would have been used in 2016 to produce year 2017’s 2,203,200 units of output
assuming the year 2016 relationship between inputs and outputs.
Alternatively, we can calculate direct materials that would have been used in year 2016 to produce
year 2017’s 2,203,200 output as
12-+
Partial productivity calculations for 2016 based on year 2017 output (to make the partial
productivities comparable across the two years):
Direct materials
partial productivity
=
Quantity of output produced in 2017
Yards of direct materials that would
have been used in 2016 to produce
year 2017 output
=
2, 203, 200
1, 632, 000
=
1.35 wallets
per yard
Conversion costs
partial productivity
=
Quantity of output produced in 2017
Units of manufacturing capacity
that would have been used in
2016 to produce year 2017 output
=
2, 203, 200
2, 448, 000
=
0.9 wallets per
unit of capacity
The calculations indicate that Gable improved the partial productivity of direct materials and
conversion costs between 2016 and 2017 via efficiency improvements and by reducing unused
manufacturing capacity.
2. Gable Company management can use the partial productivity measures to set targets for
the next year. Partial productivity measures can easily be compared over multiple periods. For
example, they may specify bonus payments if partial productivity of direct materials increases to
12-44 Total factor productivity (continuation of 12-43). Refer to the data for Problem 12-43.
Assume the fabric costs $4.00 per yard in 2017 and $4.10 per yard in 2016.
Required:
1. Compute Gable Company’s total factor productivity (TFP) for 2017.
2. Compare TFP for 2017 with a benchmark TFP for 2016 inputs based on 2017 prices and
output.
3. What additional information does TFP provide that partial-productivity measures do not?
12-+
SOLUTION
(25 min.) Total factor productivity (continuation of 12-43).
1.
Total factor
productivity
for 2017 using
2017 prices
=
Quantity of output produced in 2017
Costs of inputs used in 2017 based on 2017 prices
=
2,203,200
(1,440,000 $4.00) + (7,803, 000)´
=
2, 203, 200 2,203,200
$5, 760,000 $7,803,000 $13,563,000
=
+
2. By itself, the 2017 TFP of 0.16244 units per dollar of input is not particularly helpful. We
need something to compare the 2017 TFP against. We use, as a benchmark, TFP calculated using
Cost of capacity in 2017 $7,803,000
2017 price of capacity = $3.40 per unit of capacity
Capacity in 2017 2,295,000 units
= =
Benchmark
TFP
=
Quantity of output produced in 2017
Costs of inputs that would have been used in 2016
to produce 2017 output at year 2017 input prices
=
2,203,200
(1,632,000 $4.00) + (2,448,000 $3.40)´ ´
=
2,203,200
$6,528,000 + $8,323,200
=
2,203,200
$14,851,200
=0.1483516 units of output per dollar of input
12-+
Using 2017 prices, total factor productivity increased 9.5% [(0.16244 0.14835)
0.14835] from 2016 to 2017.
3. Total factor productivity increased because Gable produced more output per dollar of
input in 2017 relative to 2016, measured in both years using 2017 prices. The change in partial
Partial productivities cannot be combined to indicate the overall effect on cost as a result
of these individual improvements. The TFP measure allows managers to evaluate the change in
Try It 12-1 Solution
The following is Nile’s strategy map. The strong ties are indicated by bolder arrows, for example,
attracting and retaining quality employees and employee training, improving delivery time,
product offerings and customer service. Attracting and retaining quality employees and employee
training are also trigger points for improving delivery time, product offerings and customer
service. Achieving these internal business process objectives leads to higher customer
satisfaction which in turn increases market share, operating income growth and shareholder
value. The three internal business process perspectives are what make Nile distinctive. If Nile
can be better than its competitors in these perspectives, it has an excellent chance of achieving
consistent superior performance.
SOLUTION EXHIBIT TRY IT 12-1
Strategy Map for Nile Company
12-+
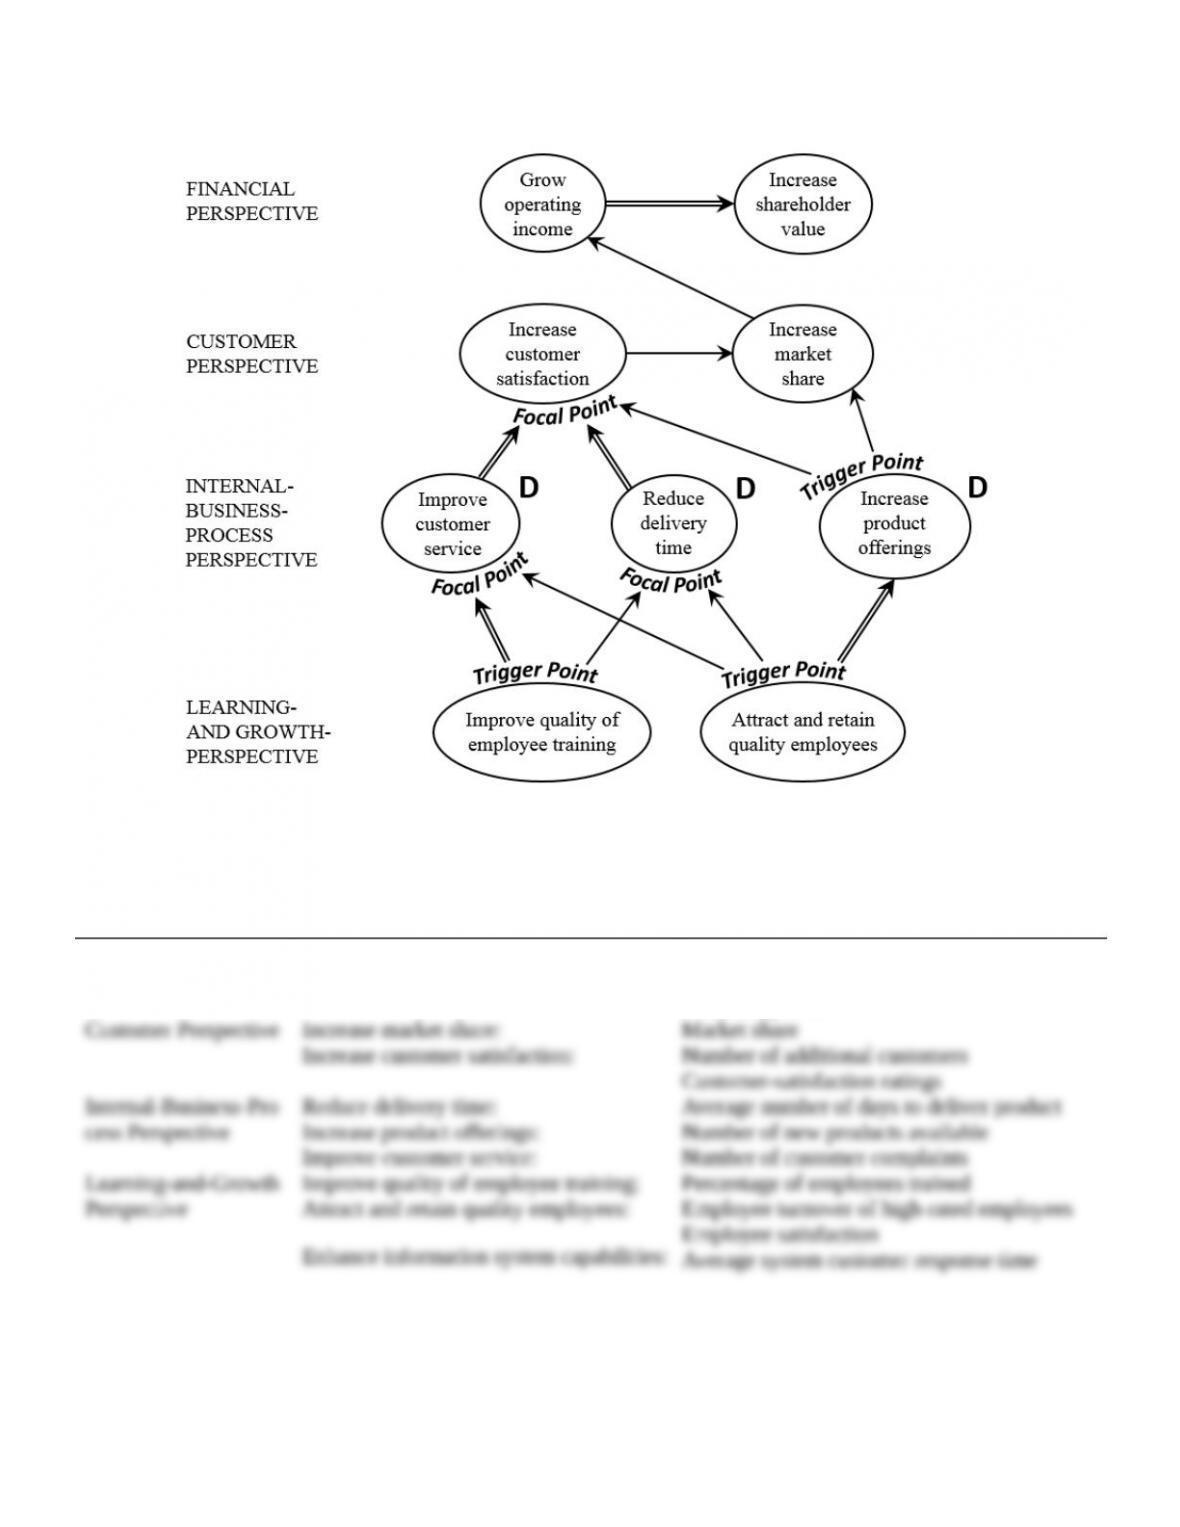
2. To achieve its goals, Nile includes the following measures under each perspective of the
balanced scorecard related to its strategy map:
Try It 12-2 Solution
1. Operating income for each year is as follows:
12-+
Strategic Objective Balanced Scorecard Measure
Financial Perspective Increase operating income:
Increase shareholder value:
Operating income from product differentiation
Operating income from growth
Revenue growth
2016 2017
Revenues ($3,200 400; $3,100 500) $1 ,280,000 $1 ,550,000
Costs
Engineering labor costs
The Growth Component
Revenue effect
of growth
=
Actual units Actual units of Selling
of output sold output sold price
in 2017 in 2016 in 2016
– ´
æ ö
ç ÷
ç ÷
è ø
Cost effect of
growth for
variable costs
=
Units of Actual units
input required of inputs
to produce used to
2017 output produce
in 2016 2016 ouput
–
æ ö
ç ÷
ç ÷
ç ÷
è ø
´
Input
price
in 2016
Cost effect of
growth for
fixed costs
=
Actual units of capacity in Actual
2016 because adequate units of
capacity exists to produce capacity
2017 output in 2016 in 2016
–
æ ö
ç ÷
ç ÷
è ø
×
Price per unit
of capacity
in 2016
Engineering labor-hours that would be required in 2017 to complete 500 jobs instead of the
24,000 labor-hours
500 400 jobs
jobs
æ ö
´
ç ÷
è ø
change since adequate capacity exists in 2016 to support year 2017 jobs.
The cost effects of growth component are
12-+
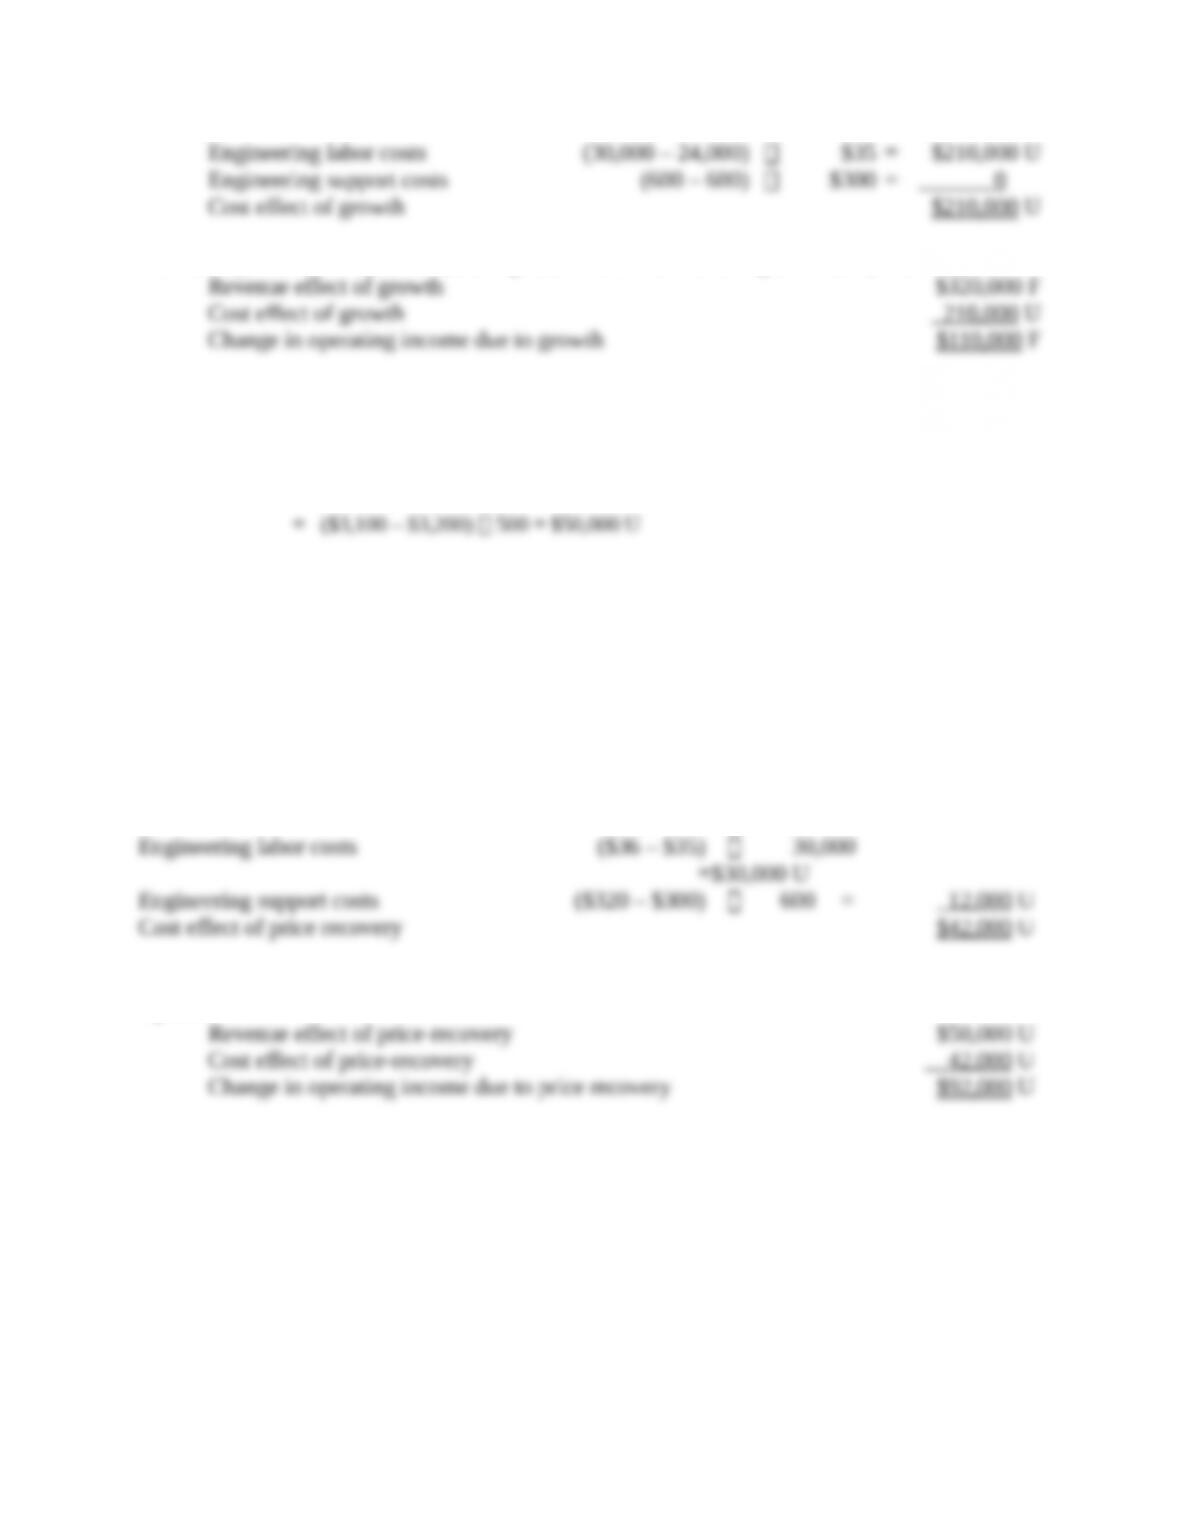
In summary, the net increase in operating income as a result of the growth component equals:
The Price-Recovery Component
Revenue effect of
price-recovery
()
Actual units
Selling price Selling price
= of output
in 2017 in 2016 sold in 2017
– ´
Cost effect of
price-recovery for
variable costs
=
Input Input
price in price in
2017 2016
–
æ ö
ç ÷
è ø
×
Units of input
required to
produce 2017
output in 2016
Cost effect of
price-recovery for
fixed costs
=
Price per Price per
unit of unit of
capacity capacity
in 2017 in 2016
–
æ ö
ç ÷
ç ÷
è ø
×
Actual units of capacity in
2016 because adequate
capacity exists to produce
2017 output in 2016
In summary, the net decrease in operating income as a result of the price-recovery component
equals:
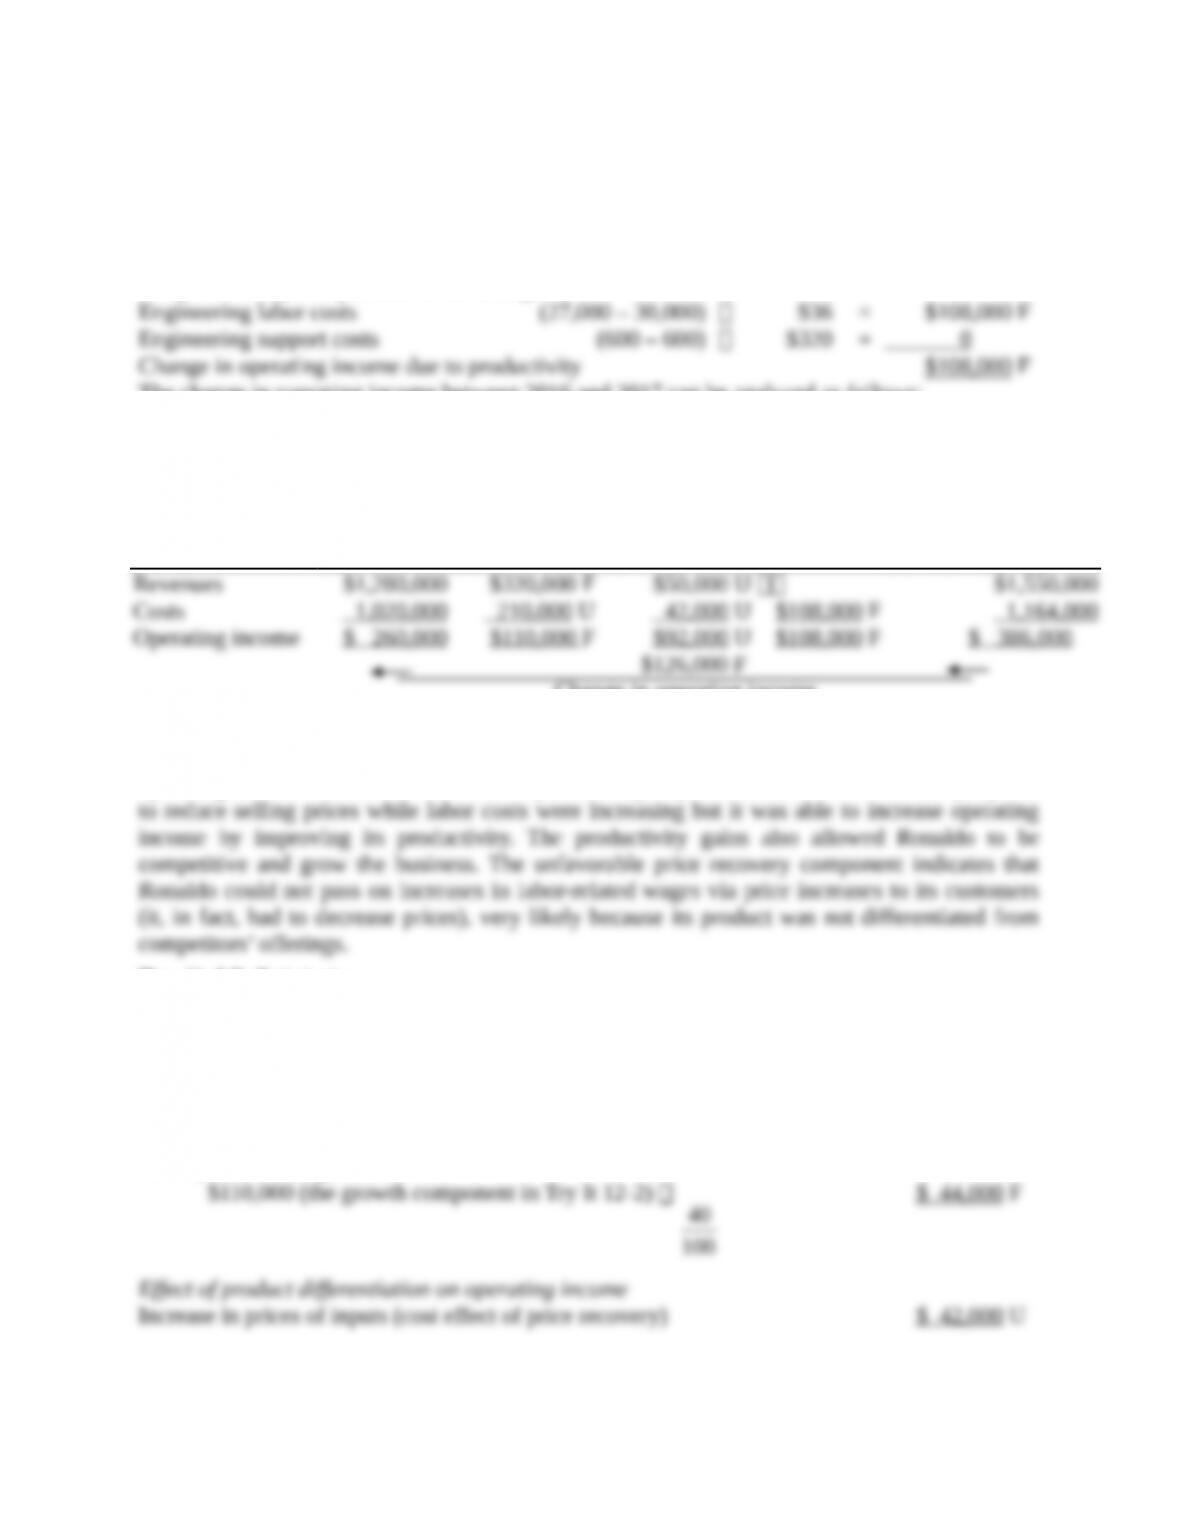
The Productivity Component
Cost effect of
productivity for
variable costs
=
Actual units of Units of input
input used required to
to produce produce 2017
2017 output ouput in 2016
–
æ ö
ç ÷
ç ÷
è ø
´
Input
price
in 2017
12-+
Cost effect of
productivity for
fixed costs
=
Actual Actual units of capacity in
units of 2016 because adequate
capacity capacity exists to produce
in 2017 2017 output in 2016
–
æ ö
ç ÷
ç ÷
è ø
´
Price per
unit of
capacity
in 2017
The productivity component of cost changes are:
The change in operating income between 2016 and 2017 can be analyzed as follows:
Income
Statement
Amounts
in 2016
(1)
Revenue and
Cost Effects
of Growth
Component
in 2017
(2)
Revenue and
Cost Effects of
Price-Recovery
Component
in 2017
(3)
Cost Effect of
Productivity
Component
in 2017
(4)
Income
Statement
Amounts
in 2017
(5) =
(1) + (2) + (3) + (4)
Change in operating income
3. The analysis of operating income indicates that a significant amount of the increase in
operating income resulted from Ronaldo’s productivity improvements in 2017. The company had
Try It 12-3 Solution
Effect of industry-market-size factor on operating income
Of the 100 jobs increase in sales from 400 to 500 jobs, 10% or 40 jobs (10% 400) are due to
growth in market size, and 60 (100 40) jobs are due to an increase in market share.
The change in Ronaldo’s operating income from the industry market-size factor rather than
from specific strategic actions is:
Effect of cost leadership on operating income
12-+
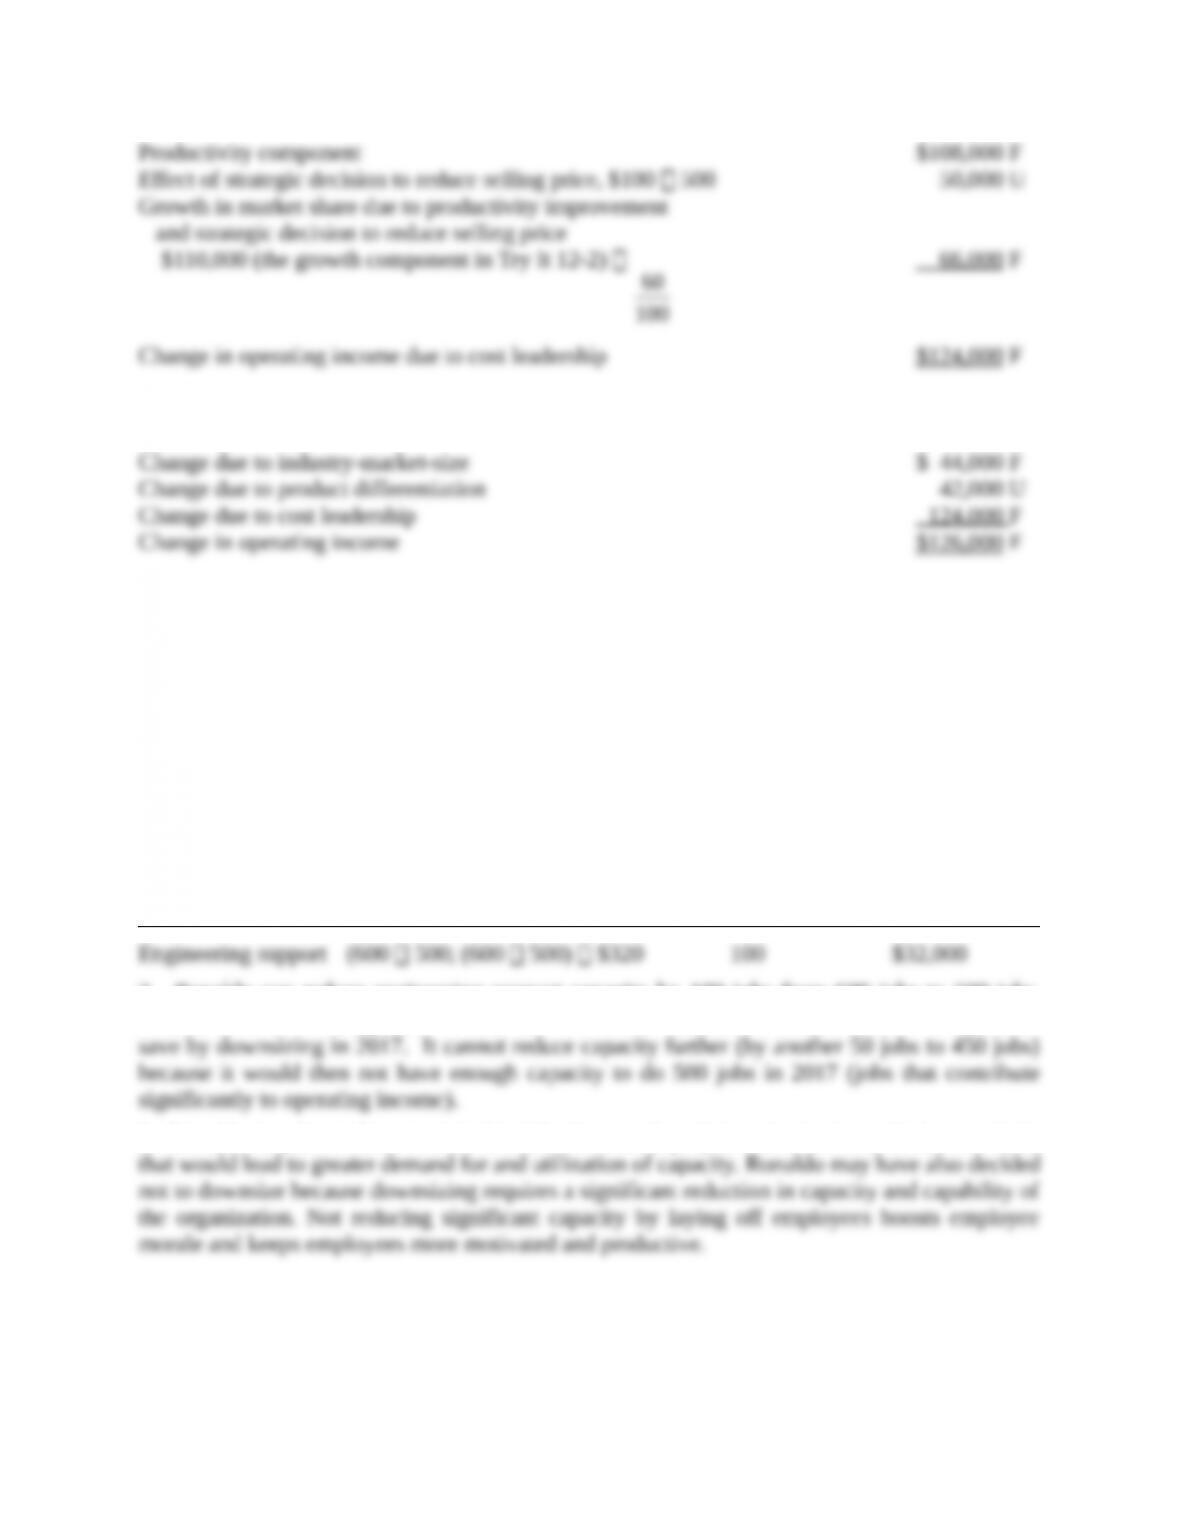
The change in operating income between 2016 and 2017 can then be summarized as
Ronaldo has been very successful in implementing its cost leadership strategy. Despite the
increase in the cost of engineering labor and engineering support, Ronaldo strategically
decreased the selling price of a job by $100. That is, Ronaldo took advantage of its productivity
gains to reduce price, gain market share, and increase operating income.
Try It 12-4 Solution
1. The amount and cost of unused capacity at the beginning of year 2017 when Ronaldo makes
its capacity decisions for the year based on jobs done in year 2017 follows:
Amount of Cost of
Unused Unused
Capacity Capacity
2. Ronaldo can reduce engineering support capacity by 100 jobs from 600 jobs to 500 jobs.
Ronaldo will save 100 $320 = $32,000. This is the maximum amount of costs Ronaldo can
3. Ronaldo may have chosen not to downsize because it projects sales increases in the near term
12-+