SOLUTION
(20 min.) Analysis of growth, price-recovery, and productivity components
(continuation of 12-25 and 12-26).
Effect of the industry-market-size factor on operating income
Of the 10-unit increase in sales from 200 to 210 units, 3% or 6 (3% 200) units is due to
growth in market size, and 4 (10 6) units is due to an increase in market share.
The change in Stanmore’s operating income from the industry-market size factor rather
than from specific strategic actions is:
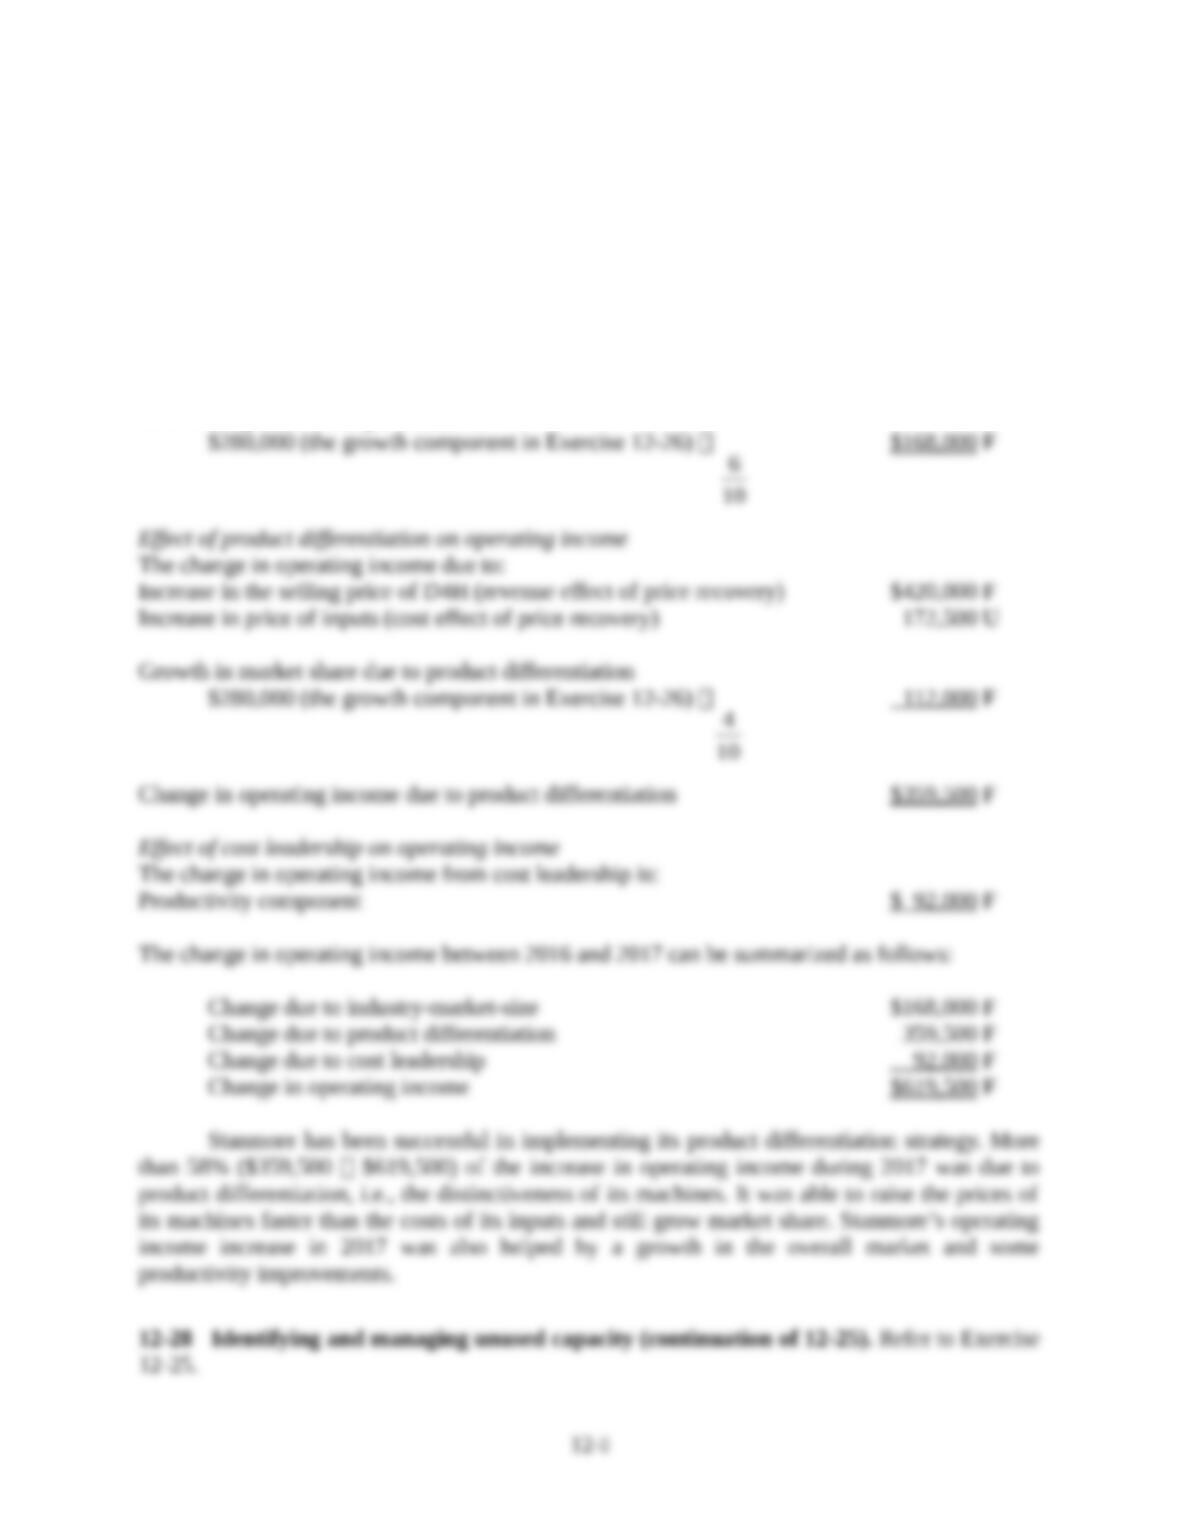
$280,000 (the growth component in Exercise 12-26)
6
10
$168 ,000 F
Effect of product differentiation on operating income
The change in operating income due to:
Increase in the selling price of D4H (revenue effect of price recovery) $420,000 F
Increase in price of inputs (cost effect of price recovery) 172,500 U
Growth in market share due to product differentiation
$280,000 (the growth component in Exercise 12-26)
4
10
112 ,000 F
Change in operating income due to product differentiation $359 ,500 F
Effect of cost leadership on operating income
The change in operating income from cost leadership is:
Productivity component $ 92 ,000 F
The change in operating income between 2016 and 2017 can be summarized as follows:
Stanmore has been successful in implementing its product differentiation strategy. More
than 58% ($359,500 $619,500) of the increase in operating income during 2017 was due to
product differentiation, i.e., the distinctiveness of its machines. It was able to raise the prices of
its machines faster than the costs of its inputs and still grow market share. Stanmore’s operating
income increase in 2017 was also helped by a growth in the overall market and some
productivity improvements.
12-28 Identifying and managing unused capacity (continuation of 12–25). Refer to Exercise
12-25.
12-;
Required:
1. Calculate the amount and cost of (a) unused manufacturing capacity and (b) unused selling and
customer-service capacity at the beginning of 2017 based on actual production and actual
number of customers served in 2017.
2. Suppose Stanmore can add or reduce its manufacturing capacity in increments of 30 units.
What is the maximum amount of costs that Stanmore could save in 2017 by downsizing
manufacturing capacity?
3. Stanmore, in fact, does not eliminate any of its unused manufacturing capacity. Why might
Stanmore not downsize?
SOLUTION
(15 min.) Identifying and managing unused capacity (continuation of 12-25).
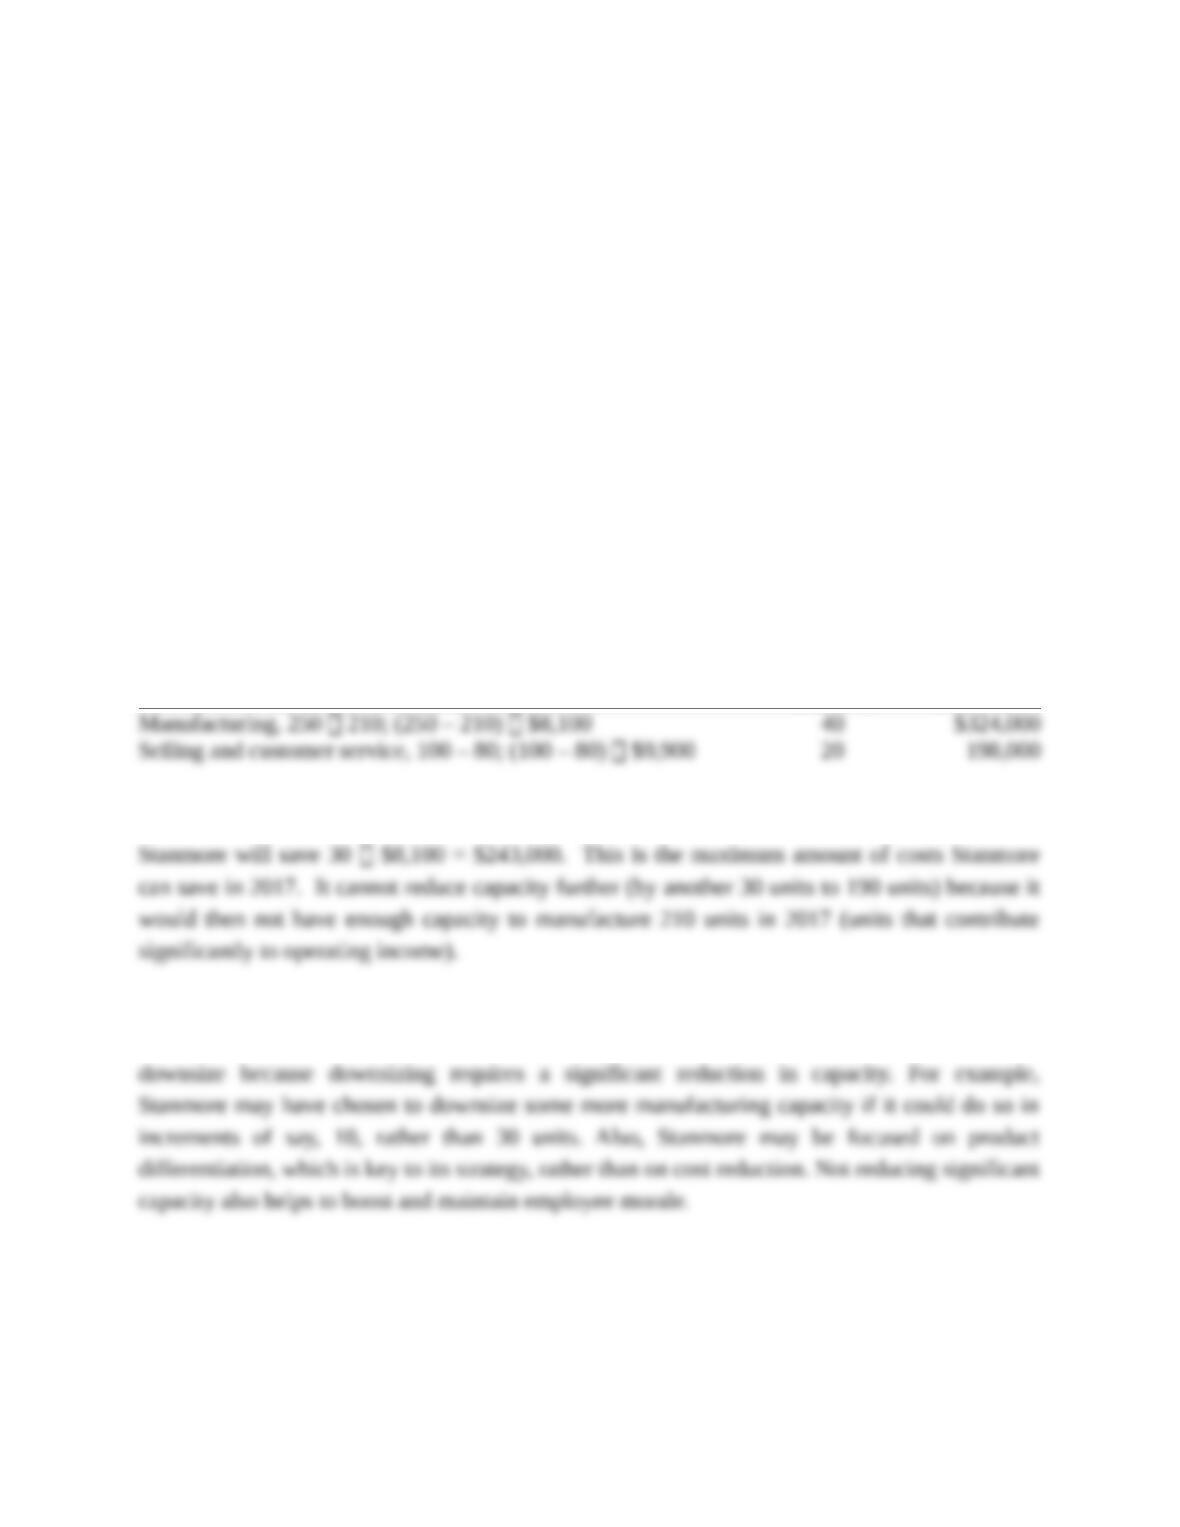
1. The amount and cost of unused capacity at the beginning of year 2017 based on year
2017 production follows:
Amount of Cost of
Unused Unused
Capacity Capacity
2. Stanmore can reduce manufacturing capacity from 250 units to 220 (250 30) units.
3. Stanmore may choose not to downsize because it projects sales increases that would lead
to a greater demand for and utilization of capacity. Stanmore may have also decided not to
12-29 Strategy, balanced scorecard, service company. Compton Associates is an
architectural firm that has been in practice only a few years. Because it is a relatively new firm,
the market for the firm’s services is very competitive. To compete successfully, Compton must
deliver quality services at a low cost. Compton presents the following data for 2016 and 2017.
12-;
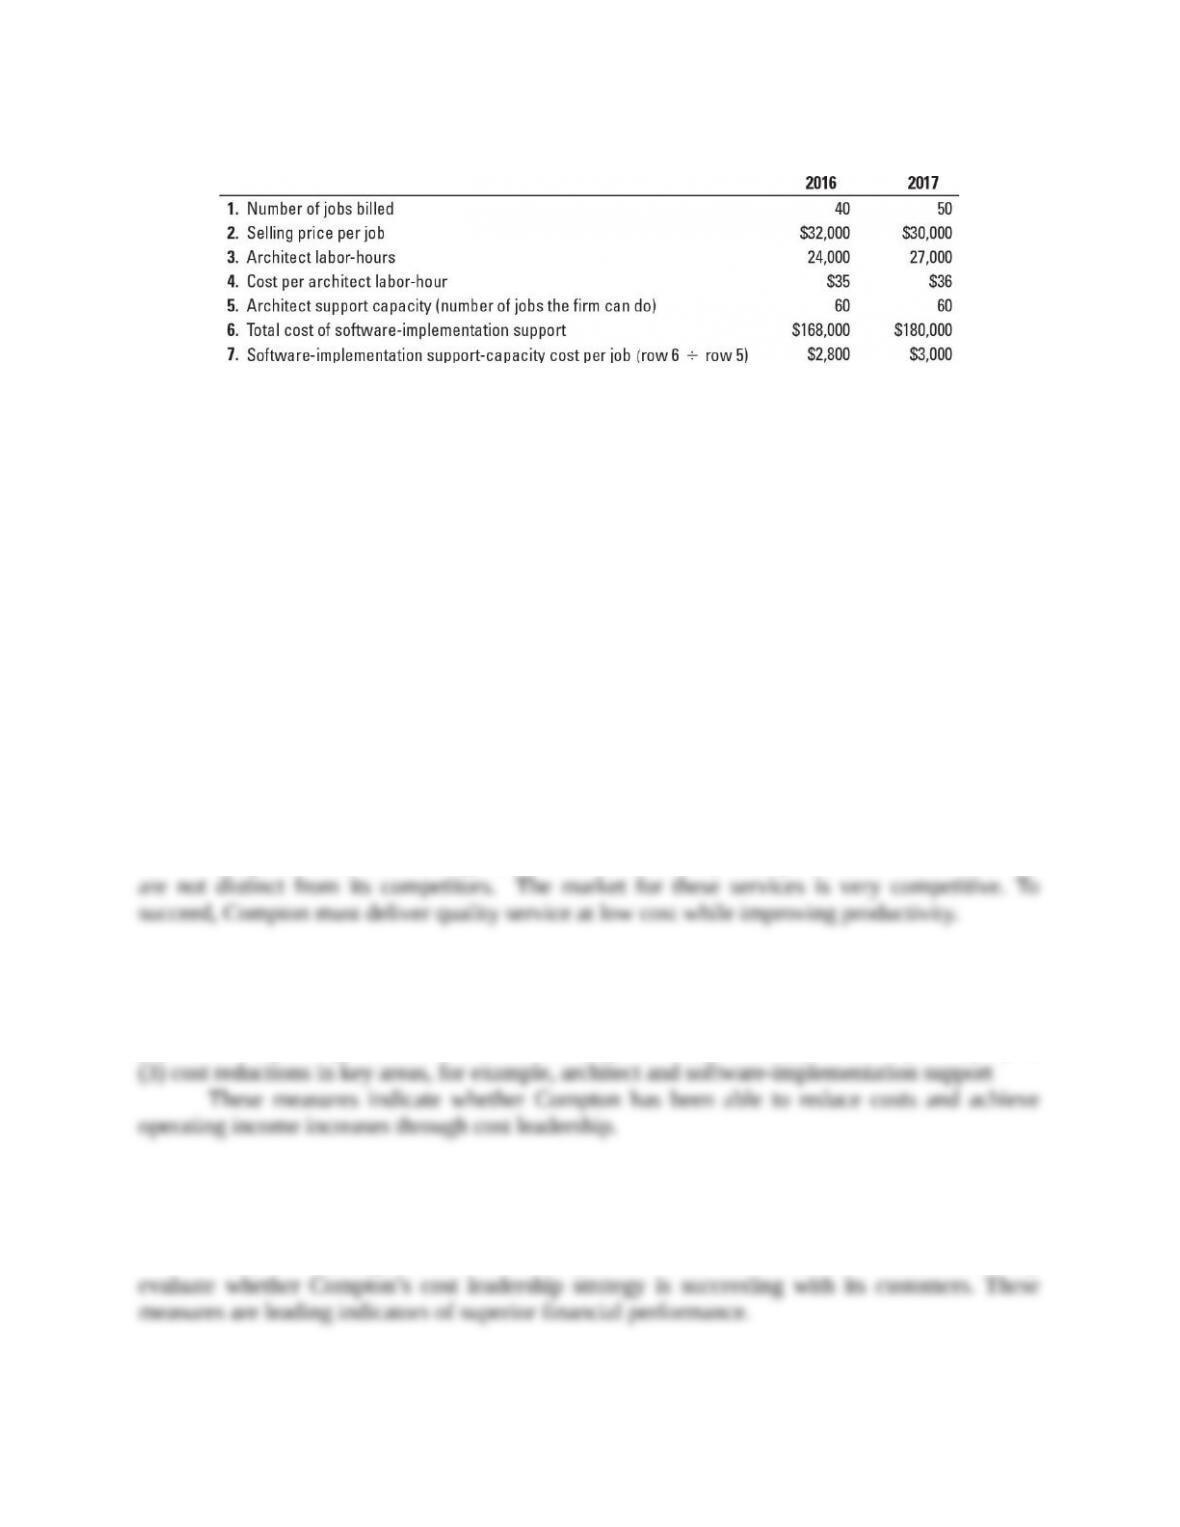
Architect labor-hour costs are variable costs. Architect support costs for each year depend on the
Architect support capacity that Compton chooses to maintain each year (that is, the number of
jobs it can do each year). Architect support costs do not vary with the actual number of jobs done
that year.
Required:
1. Is Compton Associate’s strategy one of product differentiation or cost leadership? Explain
briefly.
2. Describe key measures you would include in Compton’s balanced scorecard and your reasons
for doing so.
SOLUTION
(15 min.) Strategy, balanced scorecard, service company.
(Please note that Architect support costs are in the form of Software-implementation
support and are used interchangeably in the problem.)
1. Compton Associates’ strategy in 2017 is cost leadership. Compton’s architectural services
2. Balanced Scorecard measures for 2017 follow:
Financial Perspective
(1) Increase operating income from productivity gains and growth, (2) revenues per employee,
Customer Perspective
(1) Market share, (2) number of new customers, (3) customer responsiveness index, (4) customer
satisfaction index
Compton’s strategy should result in improvements in these customer measures that help
12-;
Internal Business Process Perspective
(1) Time to complete customer jobs, (2) time lost due to errors, (3) quality of job (are the
Learning and Growth Perspective
(1) Time required to analyze and design steps, (2) time taken to perform key steps in the design
Improvements in these measures are likely to improve Compton’s ability to achieve cost
12-30 Strategic analysis of operating income (continuation of 12-29). Refer to
Exercise
12-29.
Required:
1. Calculate the operating income of Compton Associates in 2016 and 2017.
2. Calculate the growth, price-recovery, and productivity components that explain the change in
operating income from 2016 to 2017.
3. Comment on your answer in requirement 2. What do these components indicate?
SOLUTION
(30 min.) Strategic analysis of operating income (continuation of 12-29).
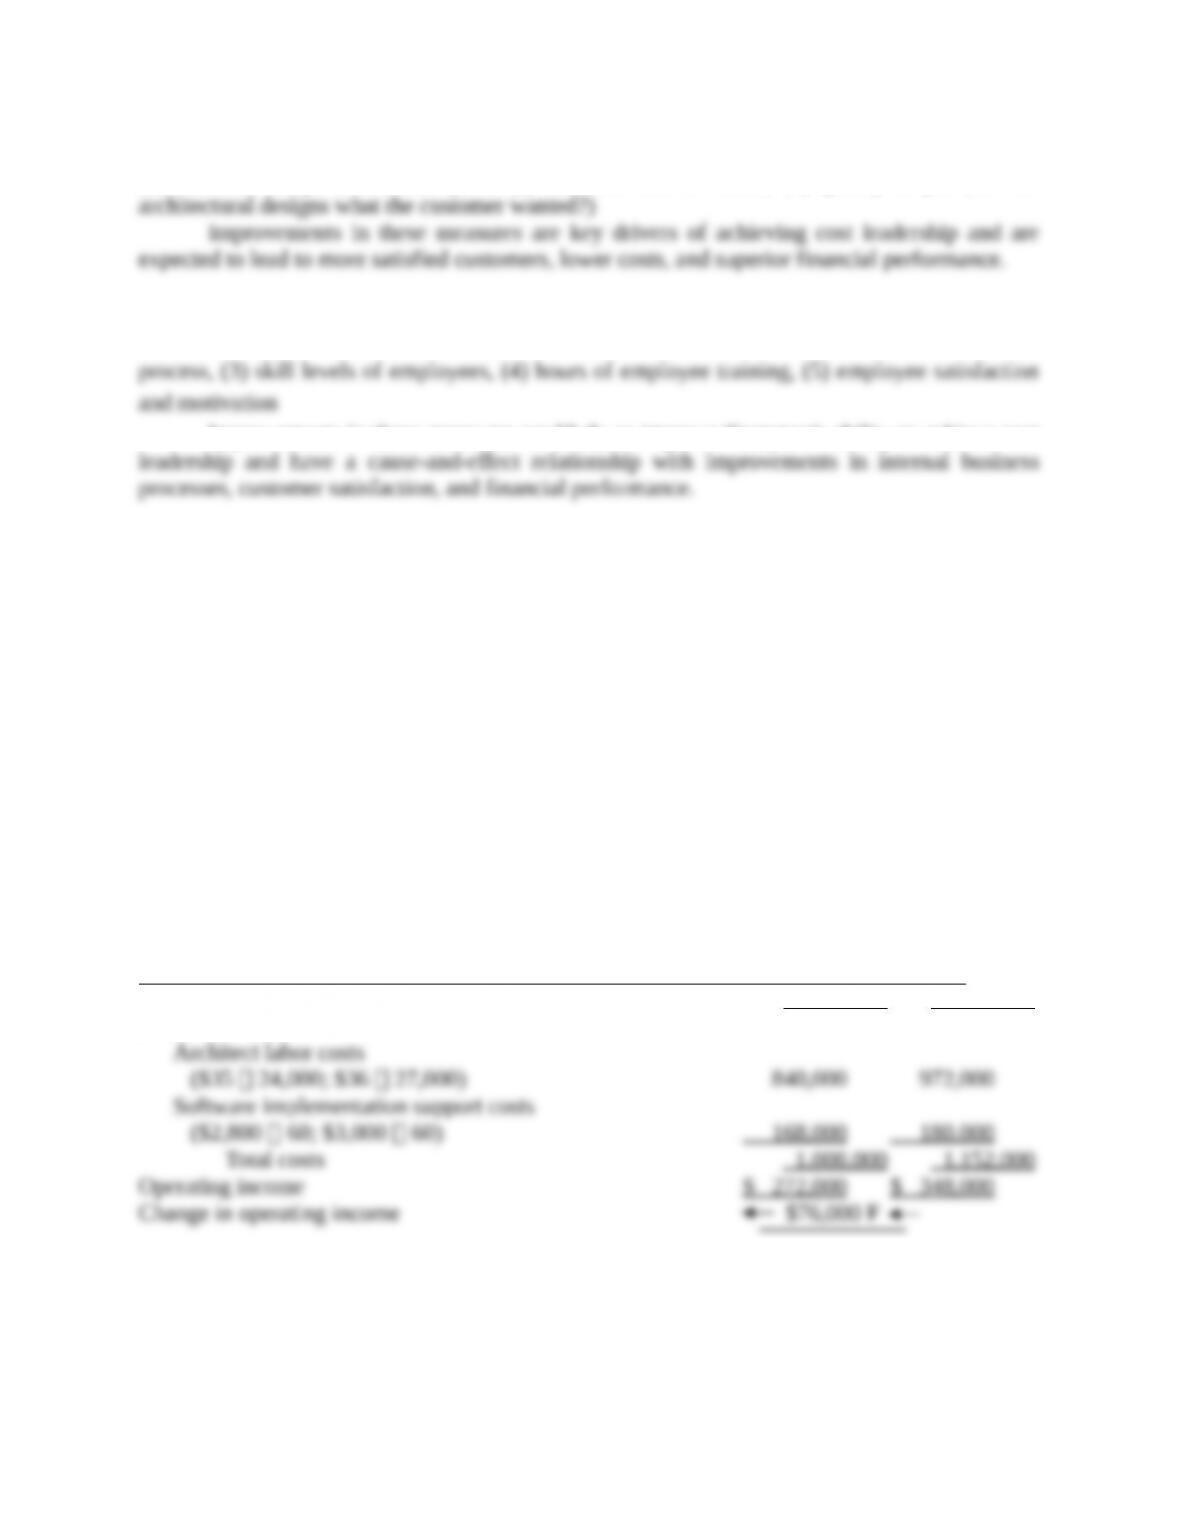
1. Operating income for each year is as follows:
2016 2017
Revenues ($32,000 40; $30,000 50) $1 ,280,000 $1 ,500,000
Costs
2. The Growth Component
12-;
Revenue effect
of growth
=
Actual units Actual units of Selling
of output sold output sold price
in 2017 in 2016 in 2016
– ´
æ ö
ç ÷
ç ÷
è ø
Cost effect of
growth for
variable costs
=
Units of Actual units
input required of inputs
to produce used to
2017 output produce
in 2016 2016 ouput
–
æ ö
ç ÷
ç ÷
ç ÷
è ø
×
Input
price
in 2016
Cost effect of
growth for
fixed costs
=
Actual units of capacity in Actual
2016 because adequate units of
capacity exists to produce capacity
2017 output in 2016 in 2016
–
æ ö
ç ÷
ç ÷
è ø
×
Price per unit
of capacity
in 2016
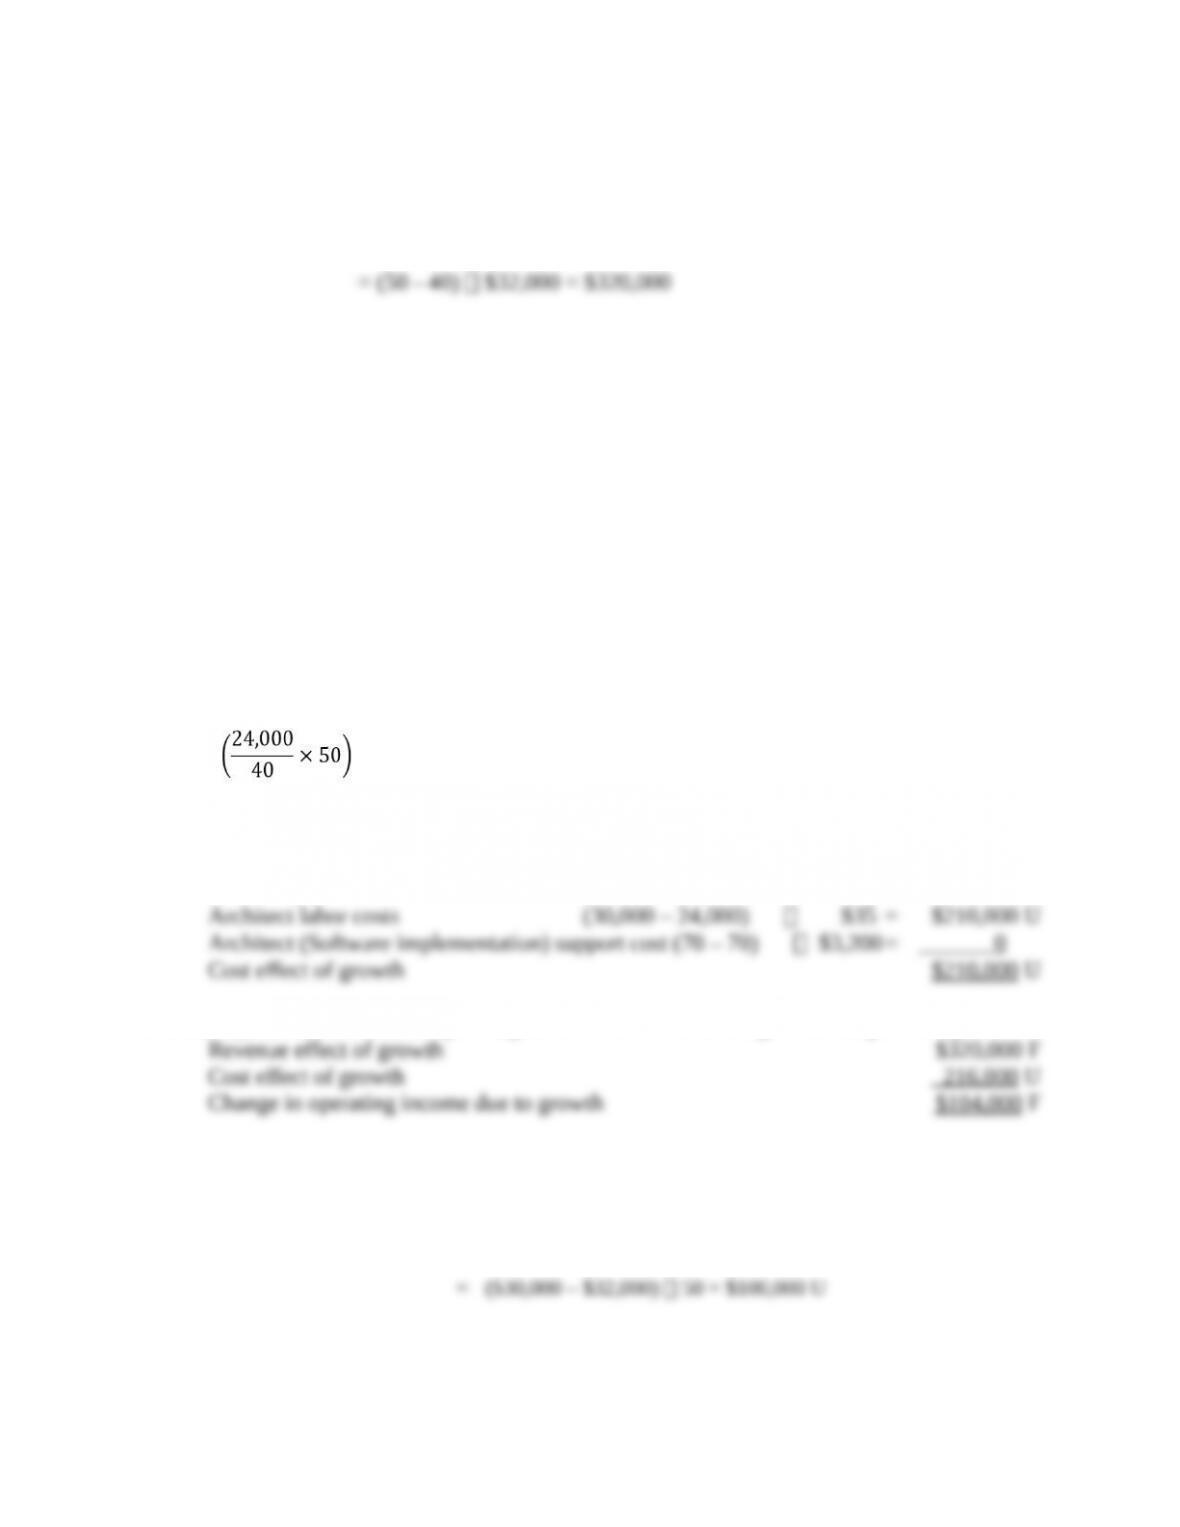
Architect labor-hours that would be required in 2017 to complete 50 jobs instead of the 40
jobs completed in 2016, assuming the 2016 input-output relationship continued into 2017, equal
30,000
25,000
40 ´ 55
æ
è
çö
ø
÷
labor-hours. Architect (software implementation) support capacity would
not change since adequate capacity exists in 2016 to support year 2017 output and customers.
The cost effects of growth component are
In summary, the net increase in operating income as a result of the growth component equals:
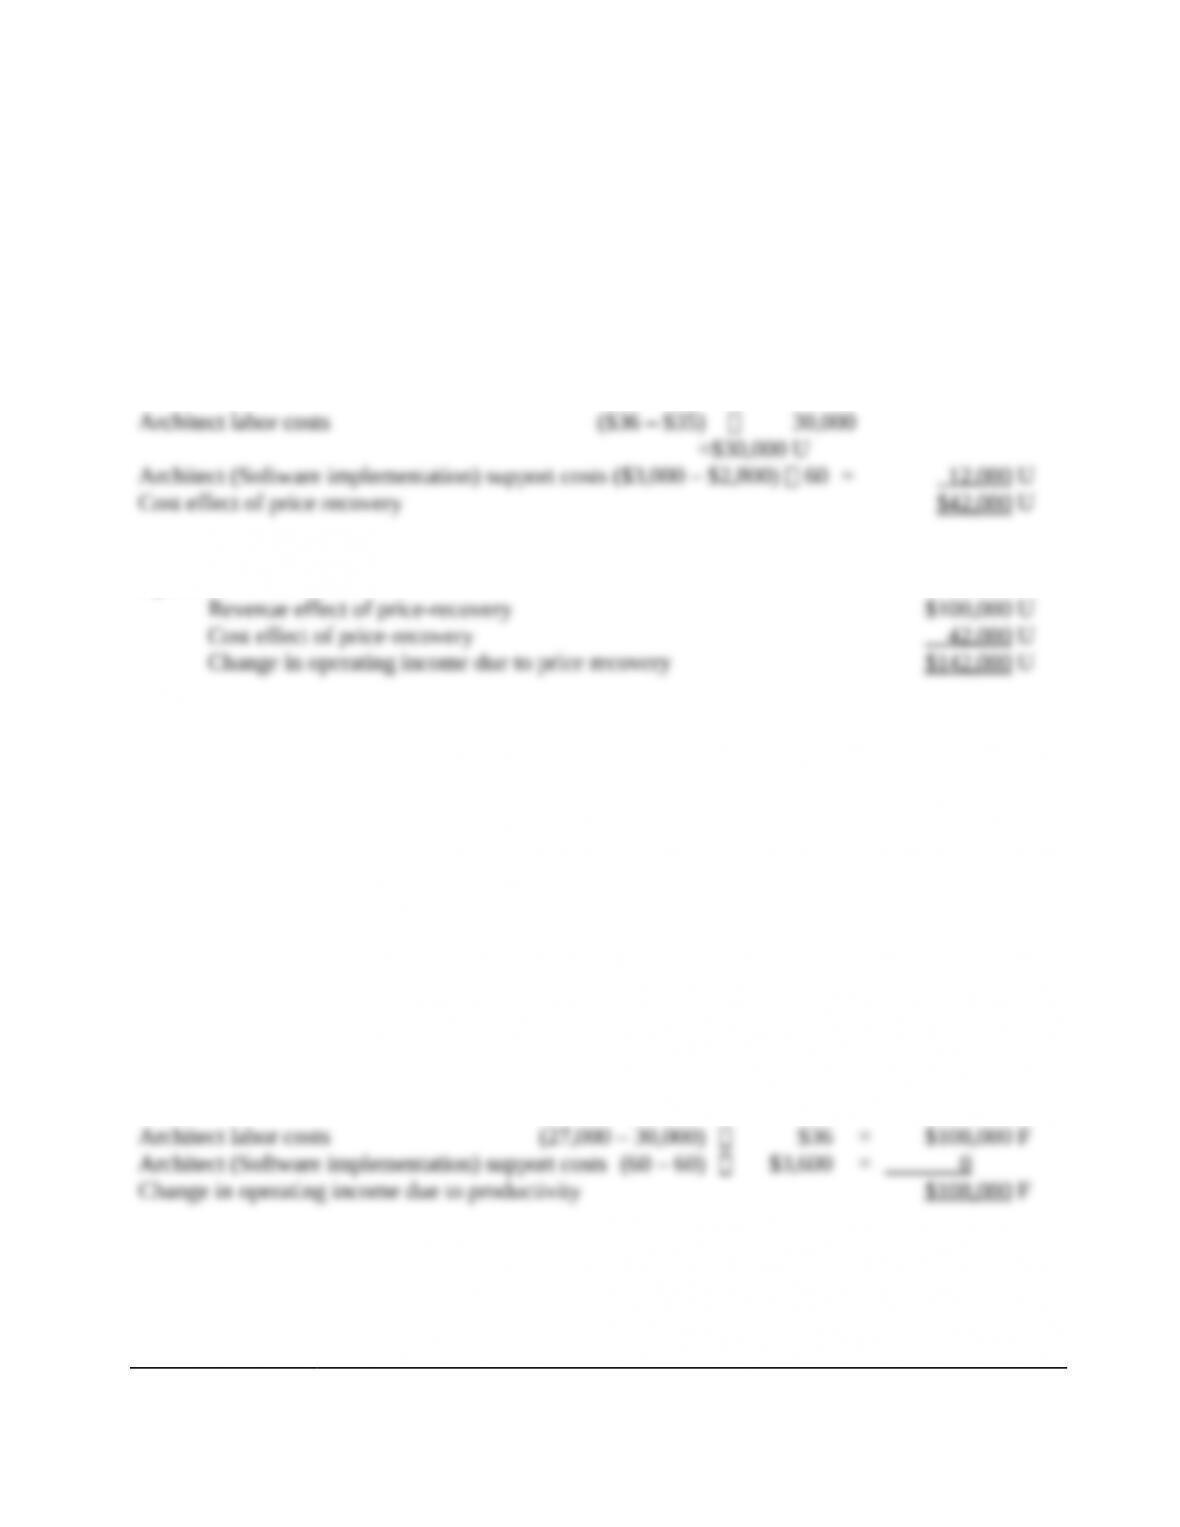
The Price-Recovery Component
Revenue effect of
price-recovery
()
Actual units
Selling price Selling price
= of output
in 2017 in 2016 sold in 2017
– ´
12-;
Cost effect of
price-recovery for
variable costs
=
Input Input
price in price in
2017 2016
–
æ ö
ç ÷
è ø
×
Units of input
required to
produce 2017
output in 2016
Cost effect of
price-recovery for
fixed costs
=
Price per Price per
unit of unit of
capacity capacity
in 2017 in 2016
–
æ ö
ç ÷
ç ÷
è ø
×
Actual units of capacity in
2016 because adequate
capacity exists to produce
2017 output in 2016
In summary, the net decrease in operating income as a result of the price-recovery component
equals:
The Productivity Component
Cost effect of
productivity for
variable costs
=
Actual units of Units of input
input used required to
to produce produce 2017
2017 output ouput in 2016
–
æ ö
ç ÷
ç ÷
è ø
´
Input
price
in 2017
Cost effect of
productivity for
fixed costs
=
Actual Actual units of capacity in
units of 2016 because adequate
capacity capacity exists to produce
in 2017 2017 output in 2016
–
æ ö
ç ÷
ç ÷
è ø
´
Price per
unit of
capacity
in 2017
The productivity component of cost changes are:
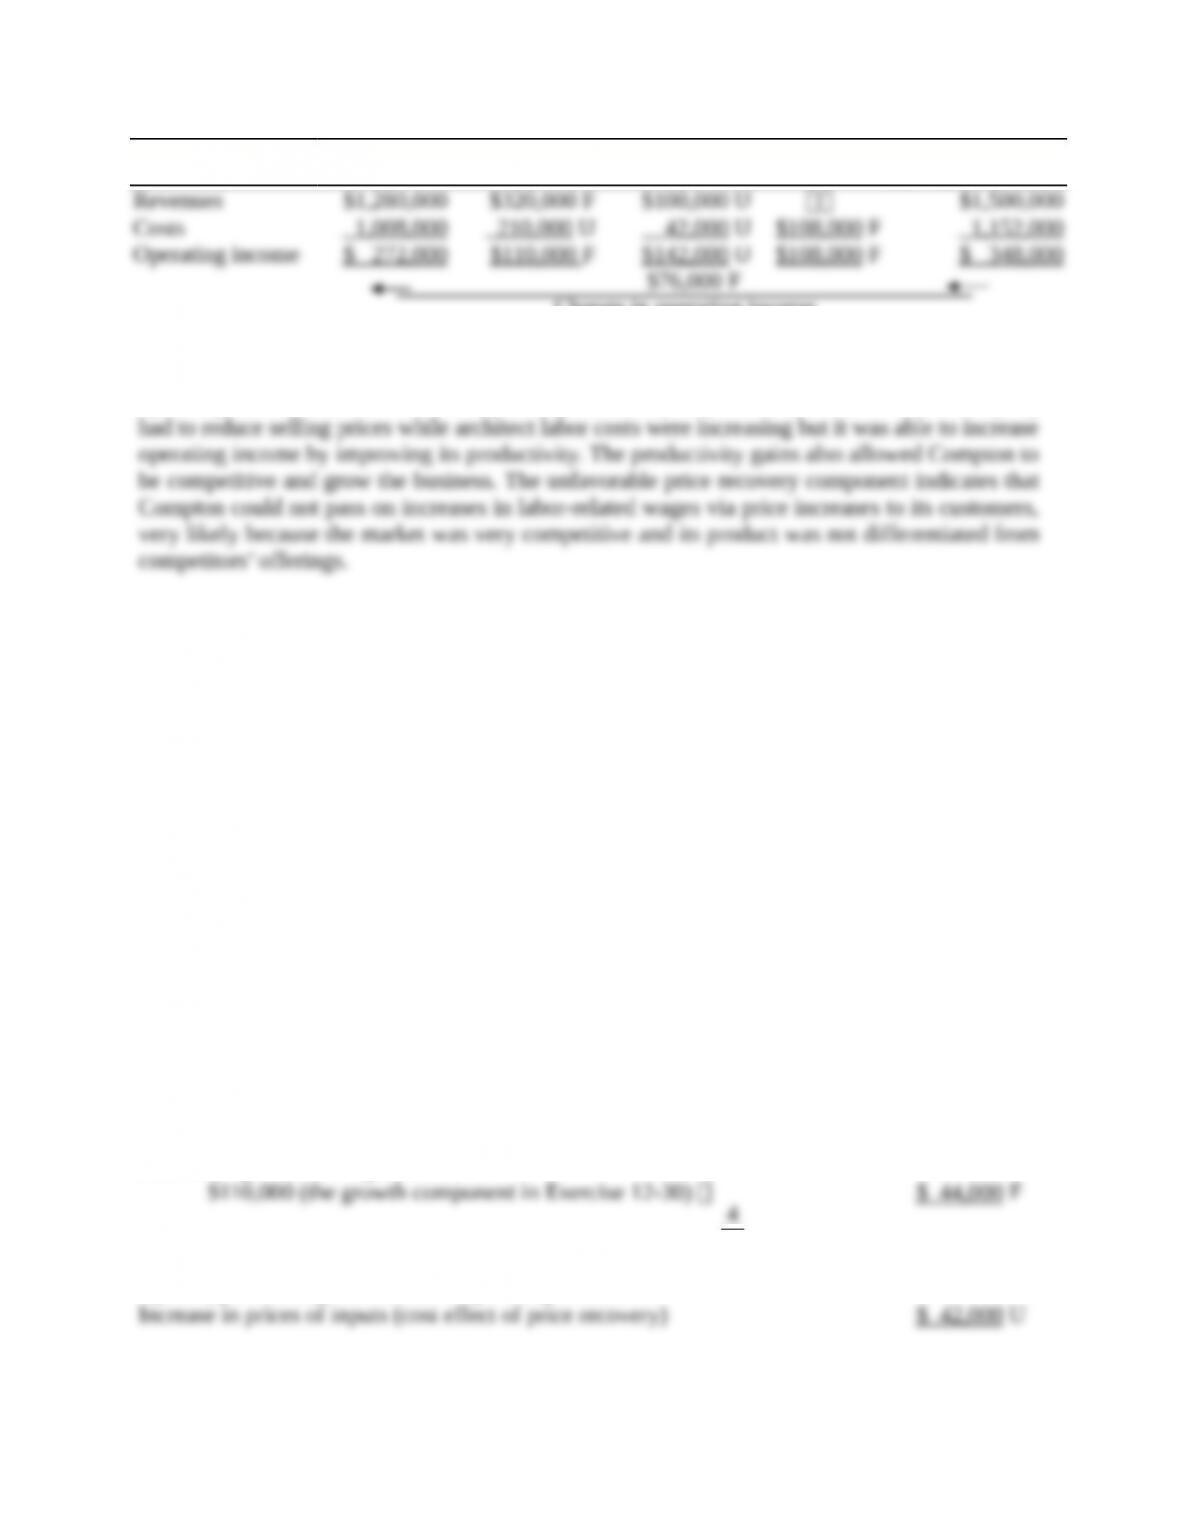
The change in operating income between 2016 and 2017 can be analyzed as follows:
Income
Statement
Amounts
Revenue and
Cost Effects
of Growth
Component
Revenue and
Cost Effects of
Price-Recovery
Component
Cost Effect of
Productivity
Component
Income
Statement
Amounts
in 2017
12-;
in 2016
(1)
in 2017
(2)
in 2017
(3)
in 2017
(4)
(5) =
(1) + (2) + (3) + (4)
Change in operating income
3. The analysis of operating income indicates that a significant amount of the increase in
operating income resulted from Compton’s productivity improvements in 2017. The company
12-31 Analysis of growth, price-recovery, and productivity components (continuation of
12-29 and 12-30). Suppose that during 2017, the market for architectural jobs increases by 10%.
Assume that any increase in market share more than 10% and any decrease in selling price are
the result of strategic choices by Compton’s management to implement its strategy.
Required:
Calculate how much of the change in operating income from 2016 to 2017 is due to the
industry-market-size factor, product differentiation, and cost leadership. How successful has
Compton been in implementing its strategy? Explain.
SOLUTION
(25 min.) Analysis of growth, price-recovery, and productivity components (continuation
of 12-29 and 12-30).
Effect of industry-market-size factor on operating income
Of the 10-unit increase in sales from 40 to 50 jobs, 10% or 4 jobs (10% 40) are due to growth
in market size, and 6 (10 4) jobs are due to an increase in market share.
The change in Compton’s operating income from the industry market-size factor rather
than from specific strategic actions is:
4
10
Effect of product differentiation on operating income
Effect of cost leadership on operating income
12-;
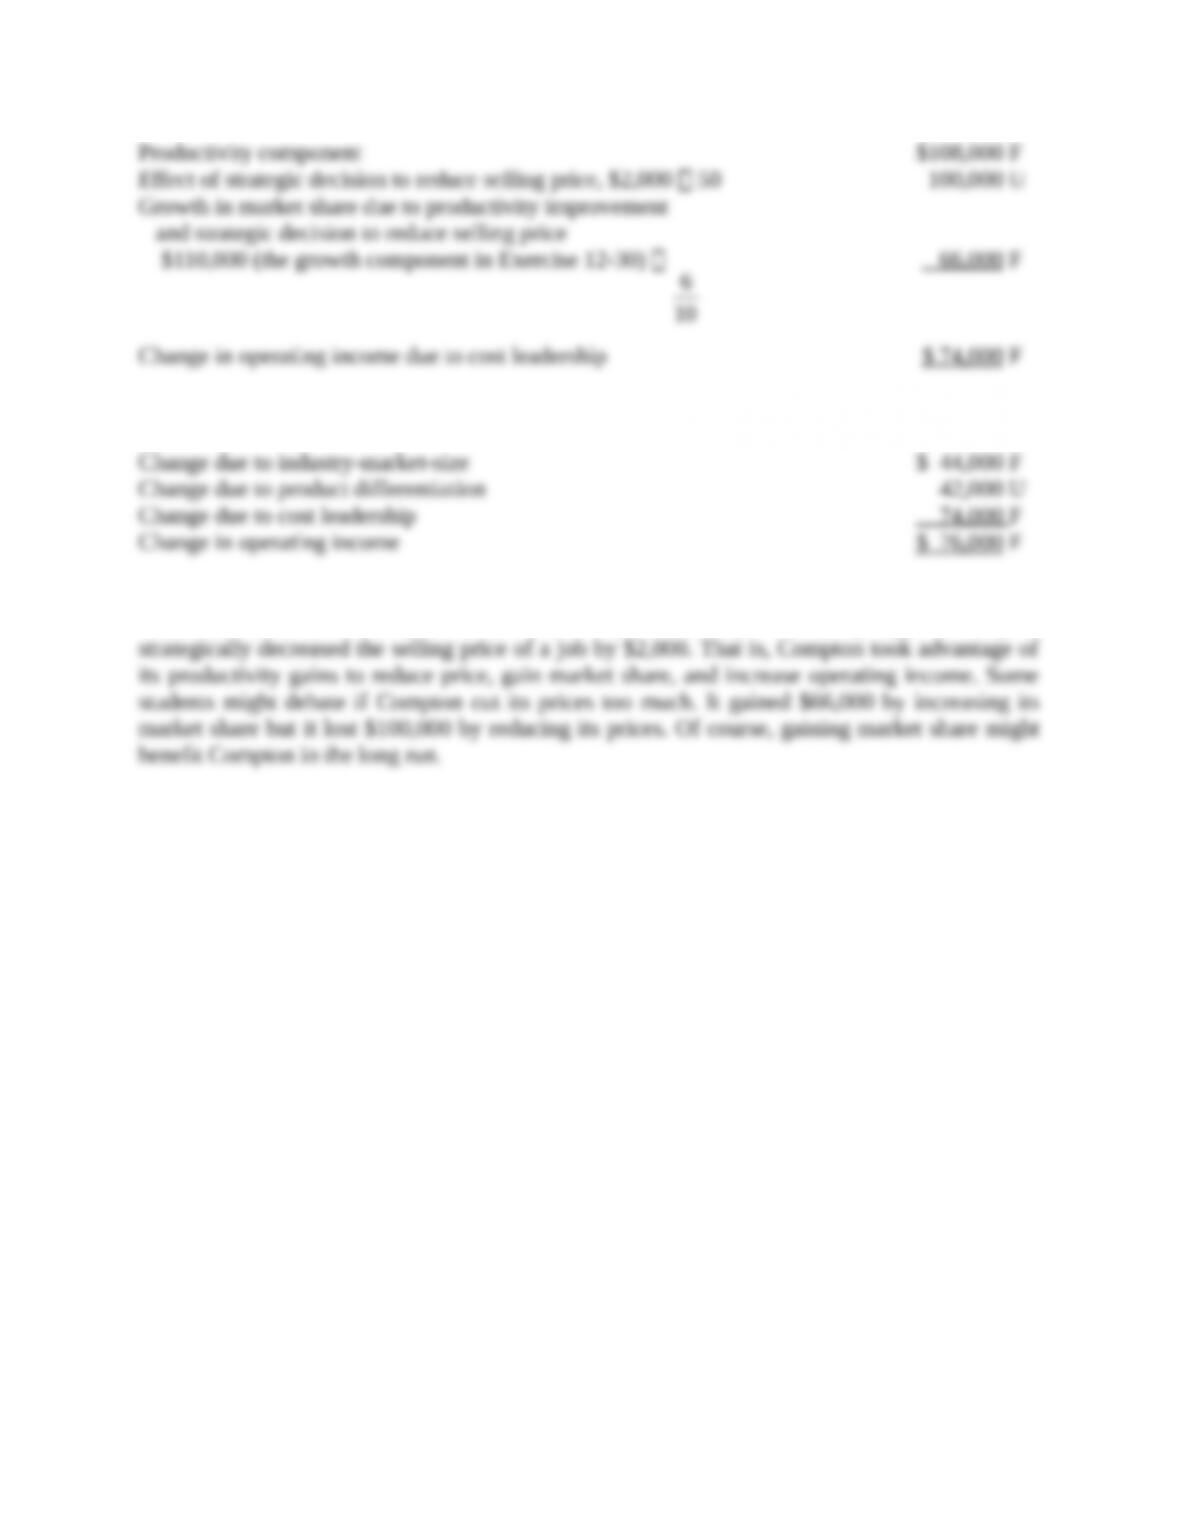
The change in operating income between 2016 and 2017 can then be summarized as
Compton has been very successful in implementing its cost leadership strategy. Despite the
increase in the cost of architect labor and architect (software-implementation) support, Compton
12-32 Identifying and managing unused capacity (continuation of 12-29). Refer to Exercise
12-29.
Required:
1. Calculate the amount and cost of unused architectural support capacity at the beginning of
2017, based on the number of jobs actually done in 2017.
2. Suppose Compton can add or reduce its architectural support capacity in increments of 10
units. What is the maximum amount of costs that Compton could save in 2017 by downsizing
architectural support capacity?
3. Compton, in fact, does not eliminate any of its unused architectural support capacity. Why
might Compton not downsize?
SOLUTION
(20 min.) Identifying and managing unused capacity (continuation of 12-29).
1. The amount and cost of unused capacity at the beginning of year 2017 when Compton
makes its capacity decisions for the year based on work done in year 2017 follows:
Amount of Cost of
Unused Unused
12-;
Capacity Capacity
2. Compton can reduce architect (software implementation) support capacity from 60 jobs
to 50 (60 10) jobs. Compton will save 10 $3,600 = $36,000. This is the maximum amount of
3. Compton may have chosen not to downsize because it projects sales increases in the near
term that would lead to greater demand for and utilization of capacity. Compton may have also
12-33 Balanced scorecard and strategy. Scott Company manufactures a DVD player called
Orlicon. The company sells the player to discount stores throughout the country. This player is
significantly less expensive than similar products sold by Scott’s competitors, but the Orlicon
offers just DVD playback, compared with DVD and Blu-ray playback offered by competitor
Nomad Manufacturing. Furthermore, the Orlicon has experienced production problems that have
resulted in significant rework costs. Nomad’s model has an excellent reputation for quality.
Required:
1. Draw a simple customer preference map for Scott and Nomad using the attributes of price,
quality, and playback features. Use the format of Exhibit 12-1.
2. Is Scott’s current strategy that of product differentiation or cost leadership?
3. Scott would like to improve quality and decrease costs by improving processes and training
workers to reduce rework. Scott’s managers believe the increased quality will increase sales.
Draw a strategy map as in Exhibit 12-2 describing the cause-and-effect relationships among
the strategic objectives you would expect to see. Present at least two strategic objectives you
would expect to see under each balanced scorecard perspective. Identify what you believe are
any (a) strong ties, (b) focal points, (c) trigger points, and (d) distinctive objectives.
Comment on your structural analysis of the strategy map.
4. For each strategic objective, suggest a measure you would recommend in Scott’s balanced
scorecard.
SOLUTION
(20–25 min.) Balanced scorecard and strategy.
1. Solution Exhibit 12-33A shows the customer preference map for DVD players for Scott
Company and Nomad Manufacturing on price, playback features, and quality.
SOLUTION EXHIBIT 12-33A
12-;
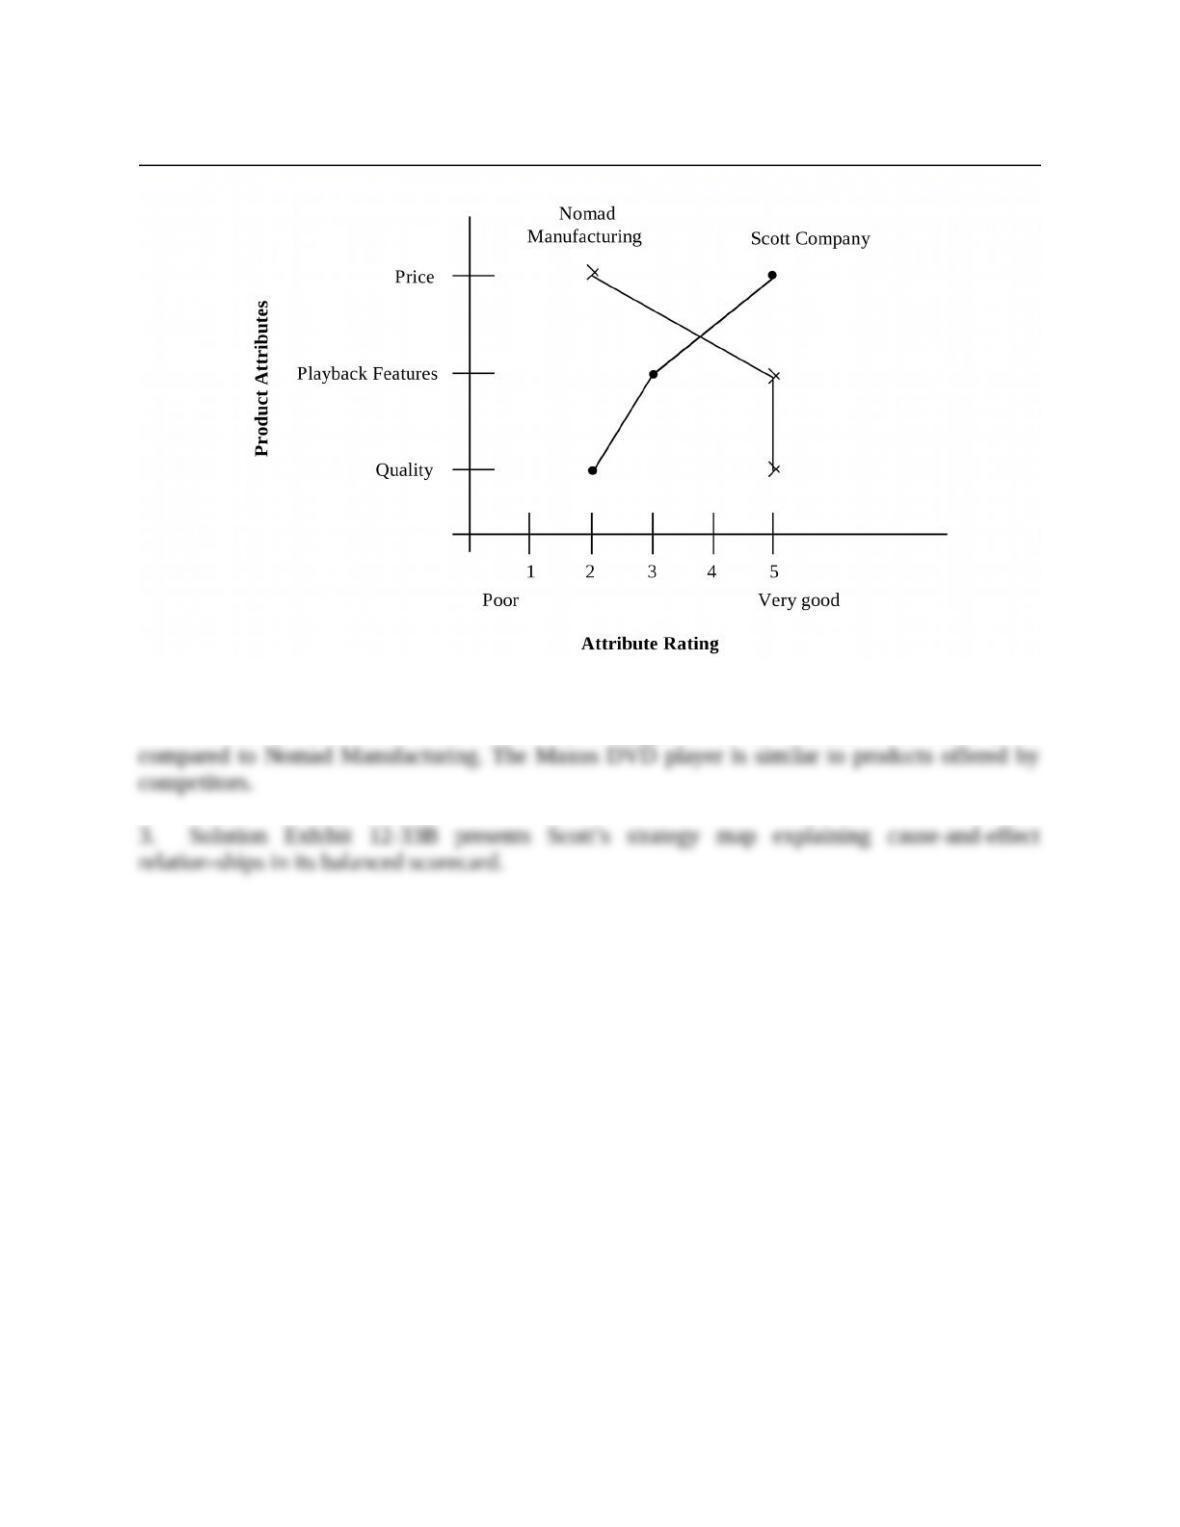
Customer Preference Map for DVD Players
2. Scott currently follows a cost leadership strategy, which is reflected in its lower price
12-;