SOLUTION
(25–30 min.) Strategic analysis of operating income (continuation of 12-21).
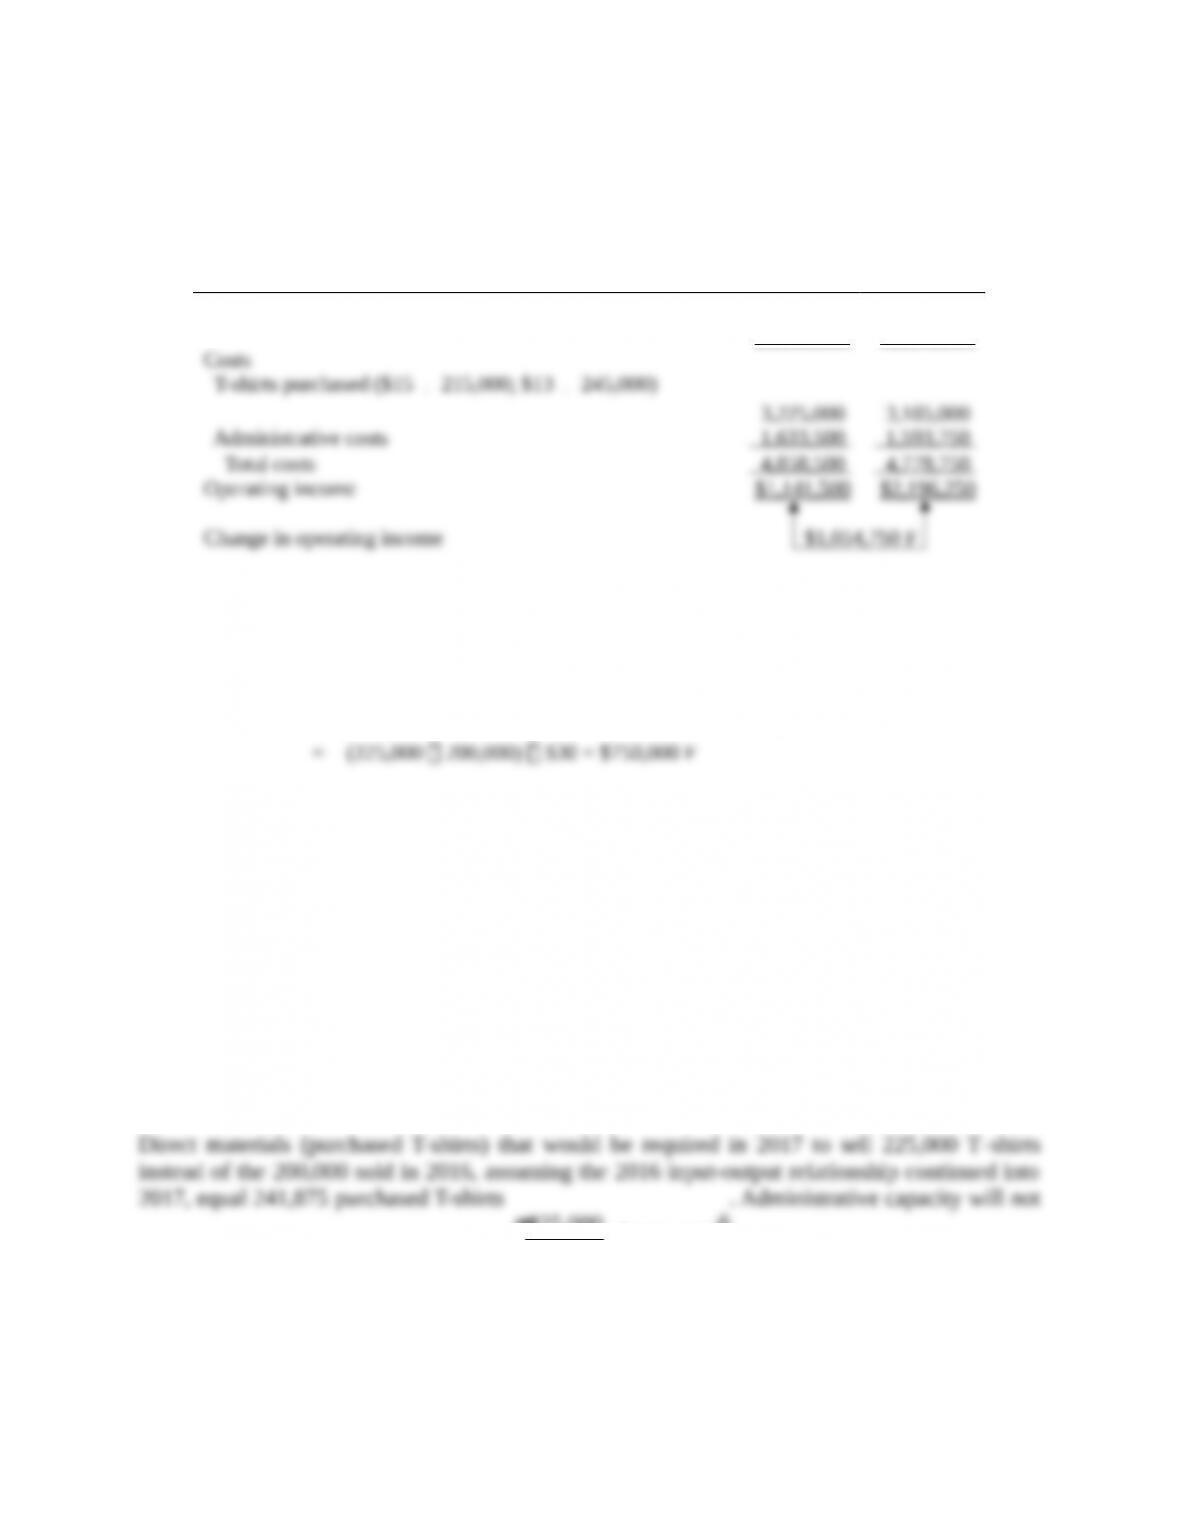
1. Operating Income Statement
2016 2017
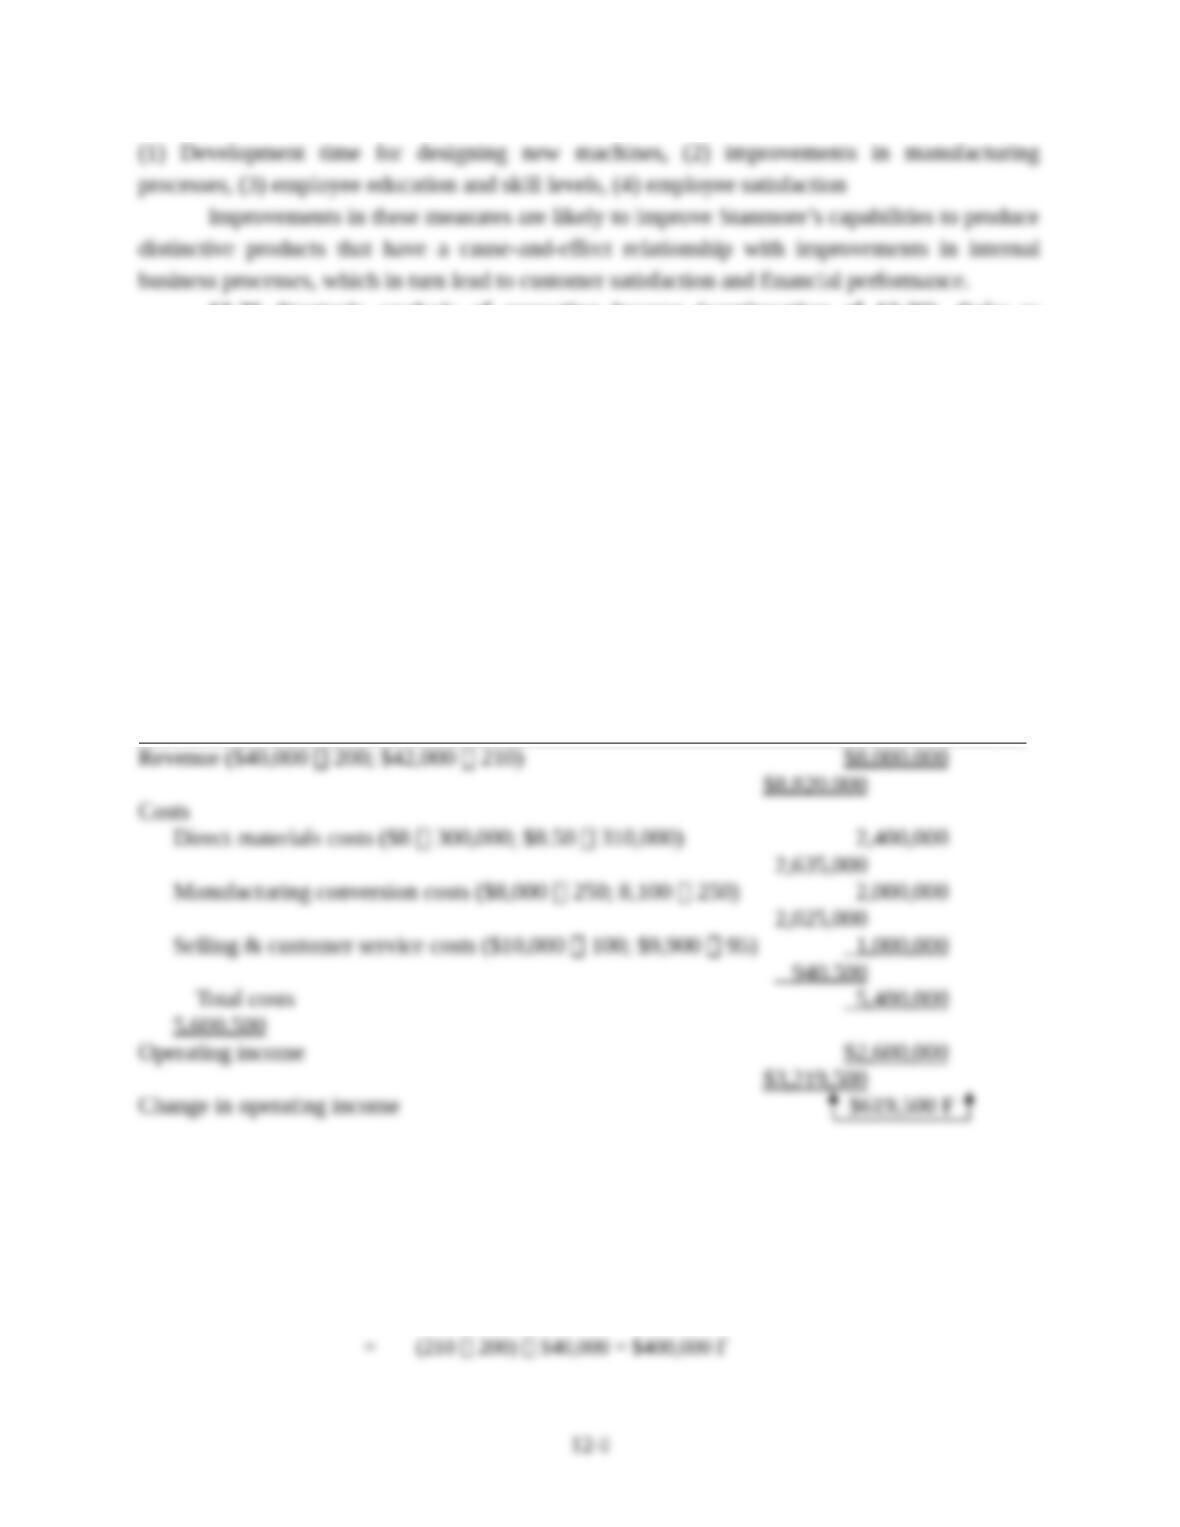
Revenues ($30
´
200,000; $31
´
225,000)
$6,000,000 $6,975,000
2. The Growth Component
Revenue effect
of growth
=
Actual units of Actual units of
output sold output sold
in 2017 in 2016
–
æ ö
ç ÷
è ø
×
Selling
price
in 2016
Cost effect of
growth for
variable costs
=
Units of input Actual units of
required to input used
produce 2017 to produce
output in 2016 2016 ouput
–
æ ö
ç ÷
ç ÷
è ø
×
Input
price
in 2016
Cost effect of
growth for
fixed costs
=
Actual units of capacity in Actual
2016 because adequate units of
capacity exists to produce capacity
2017 output in 2016 in 2016
–
æ ö
ç ÷
ç ÷
è ø
×
Price per unit
of capacity
in 2016
225,000 215,000
200,000
æ ö
´
ç ÷
è ø
change because adequate capacity exists in 2016 to support year 2017 output and customers.
The cost effects of growth component are
12-8
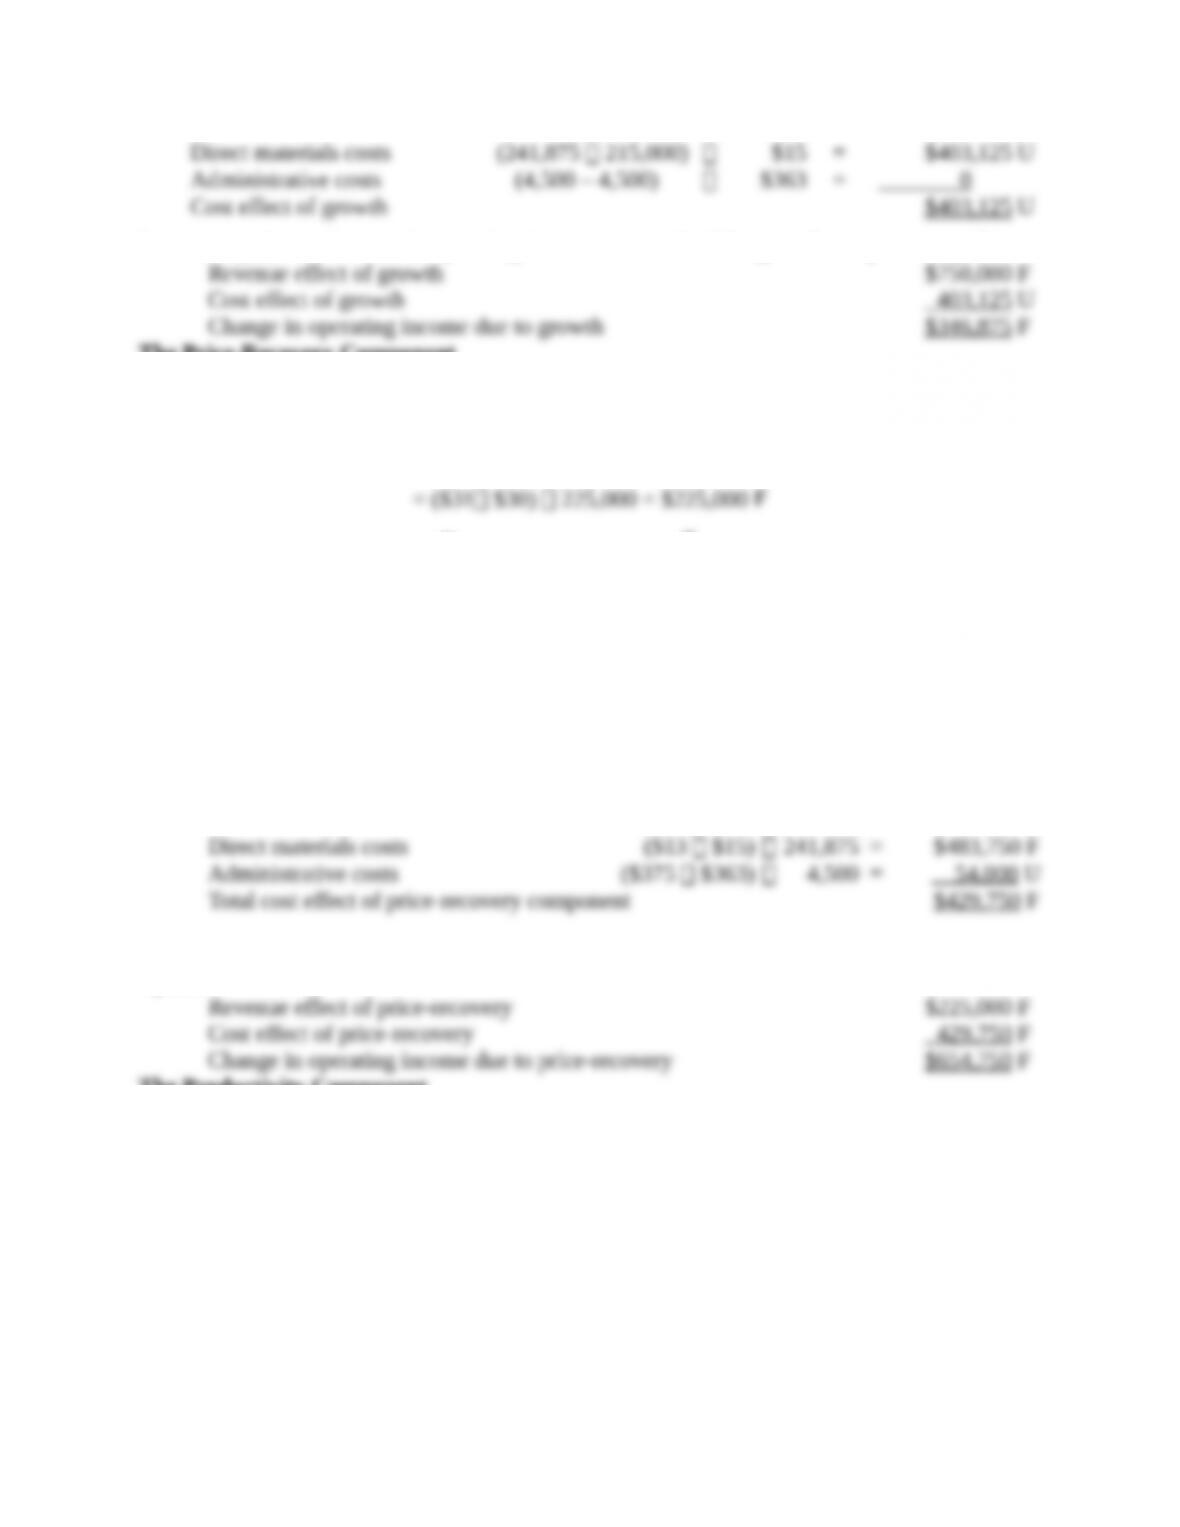
In summary, the net increase in operating income as a result of the growth component equals:
The Price-Recovery Component
Revenue effect of
price-recovery
( )
Actual units
Selling price Selling price
= of output
in 2017 in 2016 sold in 2017
– ´
Cost effect of
price-recovery for
variable costs
=
Input Input
price in price in
2017 2016
æ ö
ç ÷
–
ç ÷
è ø
×
Units of input required
to produce 2017
output in 2016
Cost effect of
price-recovery for
fixed costs
=
Price per Price per
unit of unit of
capacity capacity
in 2017 in 2016
–
æ ö
ç ÷
ç ÷
ç ÷
è ø
×
Actual units of capacity in
2016 because adequate
capacity exists to produce
2017 output in 2016
In summary, the net increase in operating income as a result of the price-recovery component
equals:
The Productivity Component
Cost effect of
productivity for
variable costs
=
Actual units of Units of input
input used required to
to produce produce 2017
2017 output ouput in 2016
–
æ ö
ç ÷
ç ÷
è ø
´
Input
price
in 2017
Cost effect of
productivity for
fixed costs
=
Actual Actual units of capacity in
units of 2016 because adequate
capacity capacity exists to produce
in 2017 2017 output in 2016
–
æ ö
ç ÷
ç ÷
è ø
´
Price per
unit of
capacity
in 2017
12-8
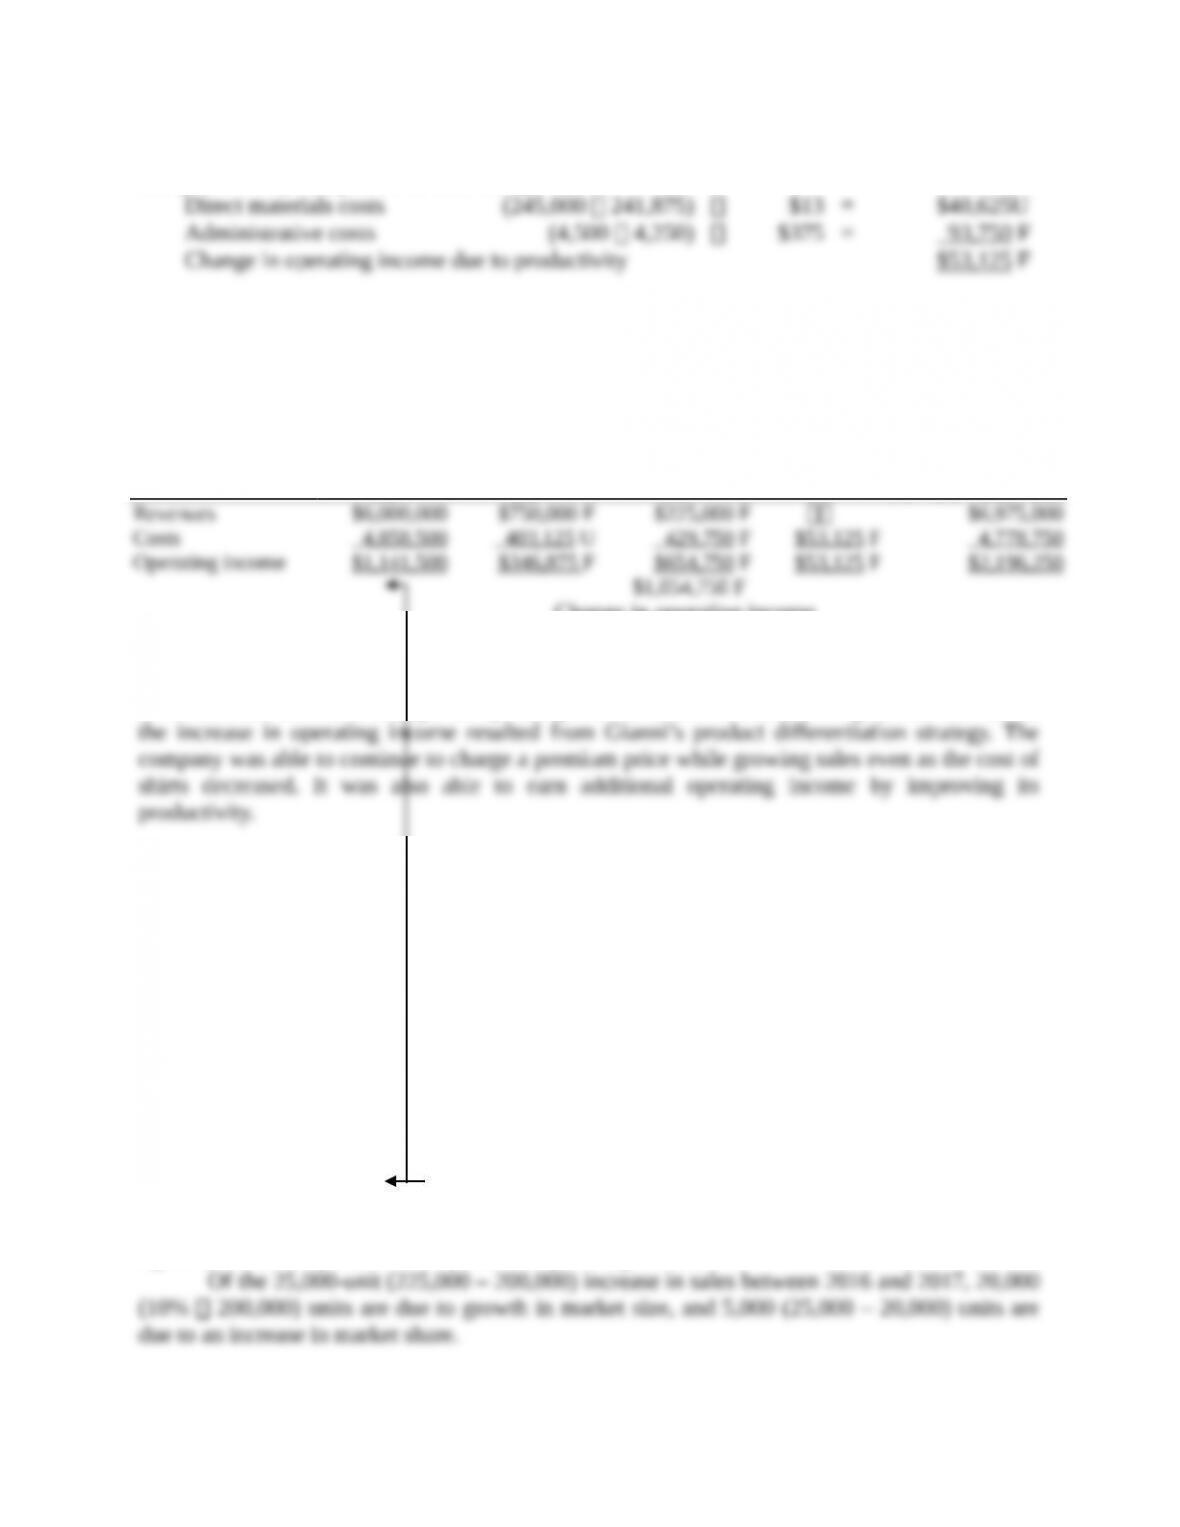
The productivity component of cost changes are
The change in operating income between 2016 and 2017 can be analyzed as follows:
Income
Statement
Amounts
in 2016
(1)
Revenue and
Cost Effects
of Growth
in 2017
(2)
Revenue and
Cost Effects of
Price-Recovery
in 2017
(3)
Cost Effect
of
Productivity
in 2017
(4)
Income
Statement
Amounts
in 2017
(5) =
(1) + (2) + (3) + (4)
Change in operating income
3. The analysis of operating income indicates that growth, price-recovery, and productivity
all resulted in favorable changes in operating income in 2017. Further, a significant amount of
12-23 Analysis of growth, price-recovery, and productivity components (continuation of
12-21 and 12-22). Refer to Exercise 12-21. Suppose that the market for
silk-screened T-shirts grew by 10% during 2017. All increases in sales greater
than 10% are the result of Gianni’s strategic actions.
Required:
Calculate the change in operating income from 2016 to 2017 due to growth in market size,
product differentiation, and cost leadership. How successful has Gianni been in implementing its
strategy? Explain.
SOLUTION
(20 min.) Analysis of growth, price-recovery, and productivity components
(continuation of 12-22).
Effect of the industry-market-size factor on operating income
12-8
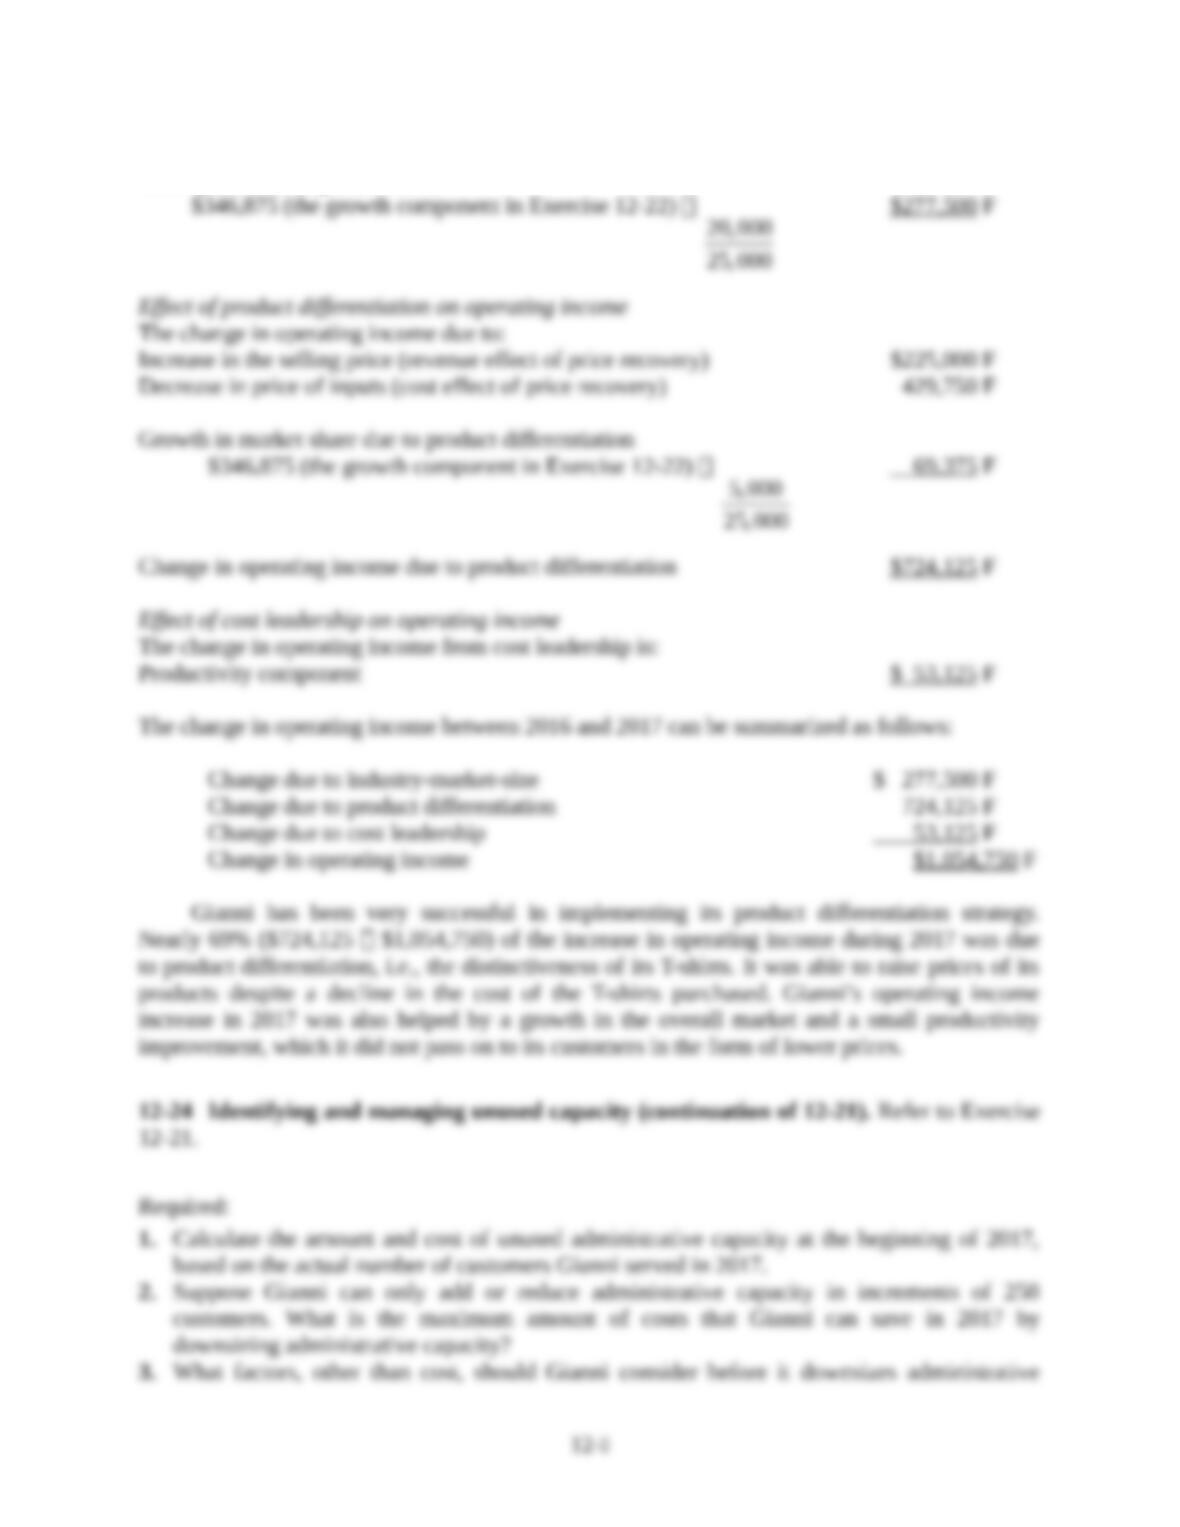
The change in Gianni’s operating income from the industry-market size factor rather than
from specific strategic actions is:
$346,875 (the growth component in Exercise 12-22)
20,000
25, 000
$277 ,500 F
Effect of product differentiation on operating income
The change in operating income due to:
Increase in the selling price (revenue effect of price recovery) $225,000 F
Decrease in price of inputs (cost effect of price recovery) 429,750 F
Growth in market share due to product differentiation
$346,875 (the growth component in Exercise 12-22)
5,000
25, 000
69 ,375 F
Change in operating income due to product differentiation $724 ,125 F
Effect of cost leadership on operating income
The change in operating income from cost leadership is:
The change in operating income between 2016 and 2017 can be summarized as follows:
Gianni has been very successful in implementing its product differentiation strategy.
12-24 Identifying and managing unused capacity (continuation of 12-21). Refer to Exercise
12-21.
Required:
1. Calculate the amount and cost of unused administrative capacity at the beginning of 2017,
based on the actual number of customers Gianni served in 2017.
2. Suppose Gianni can only add or reduce administrative capacity in increments of 250
customers. What is the maximum amount of costs that Gianni can save in 2017 by
downsizing administrative capacity?
3. What factors, other than cost, should Gianni consider before it downsizes administrative
12-8
capacity?
SOLUTION
(15 min.) Identifying and managing unused capacity (continuation of 12-21).
1. The amount and cost of unused capacity at the beginning of year 2017 based on year
2017 needs follows:
Amount of Cost of
Unused Unused
Capacity Capacity
2. Gianni can reduce administrative capacity by another 750 customers (4,250 – 750 =
´
3. Before Gianni downsizes administrative capacity, it should consider whether sales
increases in the future would lead to a greater demand for and utilization of capacity as new
12-25 Strategy, balanced scorecard. Stanmore Corporation makes a special-purpose machine,
D4H, used in the textile industry. Stanmore has designed the D4H machine for 2017 to be
distinct from its competitors. It has been generally regarded as a superior machine. Stanmore
presents the following data for 2016 and 2017.
12-8
Stanmore produces no defective machines, but it wants to reduce direct materials usage per D4H
machine in 2017. Conversion costs in each year depend on production capacity defined in terms
of D4H units that can be produced, not the actual units produced. Selling and customer-service
costs depend on the number of customers that Stanmore can support, not the actual number of
customers it serves. Stanmore has 75 customers in 2016 and 80 customers in 2017.
Required:
1. Is Stanmore’s strategy one of product differentiation or cost leadership? Explain briefly.
2. Describe briefly key measures that you would include in Stanmore’s balanced scorecard and
the reasons for doing so.
SOLUTION
(15 min.) Strategy, balanced scorecard.
1. Stanmore Corporation follows a product differentiation strategy in 2017. Stanmore’s D4H
2. Balanced Scorecard measures for 2017 follow:
Financial Perspective
Customer Perspective
(1) Market share in high-end special-purpose textile machines, (2) customer satisfaction, (3) new
customers
Internal Business Process Perspective
(1) Manufacturing quality and reduced wastage of direct materials, (2) new product features
added, (3) order delivery time
Learning and Growth Perspective
12-8
12-26 Strategic analysis of operating income (continuation of 12-25). Refer to
Exercise 12-25.
Required:
1. Calculate the operating income of Stanmore Corporation in 2016 and 2017.
2. Calculate the growth, price-recovery, and productivity components that explain the change in
operating income from 2016 to 2017.
3. Comment on your answer in requirement 2. What do these components indicate?
SOLUTION
(30 min.) Strategic analysis of operating income (continuation of 12-25).
1. Operating income for each year is as follows:
2016 2017
2. The Growth Component
Revenue effect
of growth
=
Actual units Actual units of Selling
of output sold output sold price
in 2017 in 2016 in 2016
– ´
æ ö
ç ÷
ç ÷
è ø
12-8
Cost effect of
growth for
variable costs
=
Units of Actual units
input required of inputs
to produce used to
2017 output produce
in 2016 2016 ouput
–
æ ö
ç ÷
ç ÷
ç ÷
è ø
´
Input
price
in 2016
Cost effect of
growth for
fixed costs
=
Actual units of capacity in Actual
2016 because adequate units of
capacity exists to produce capacity
2017 output in 2016 in 2016
–
æ ö
ç ÷
ç ÷
è ø
×
Price per unit
of capacity
in 2016
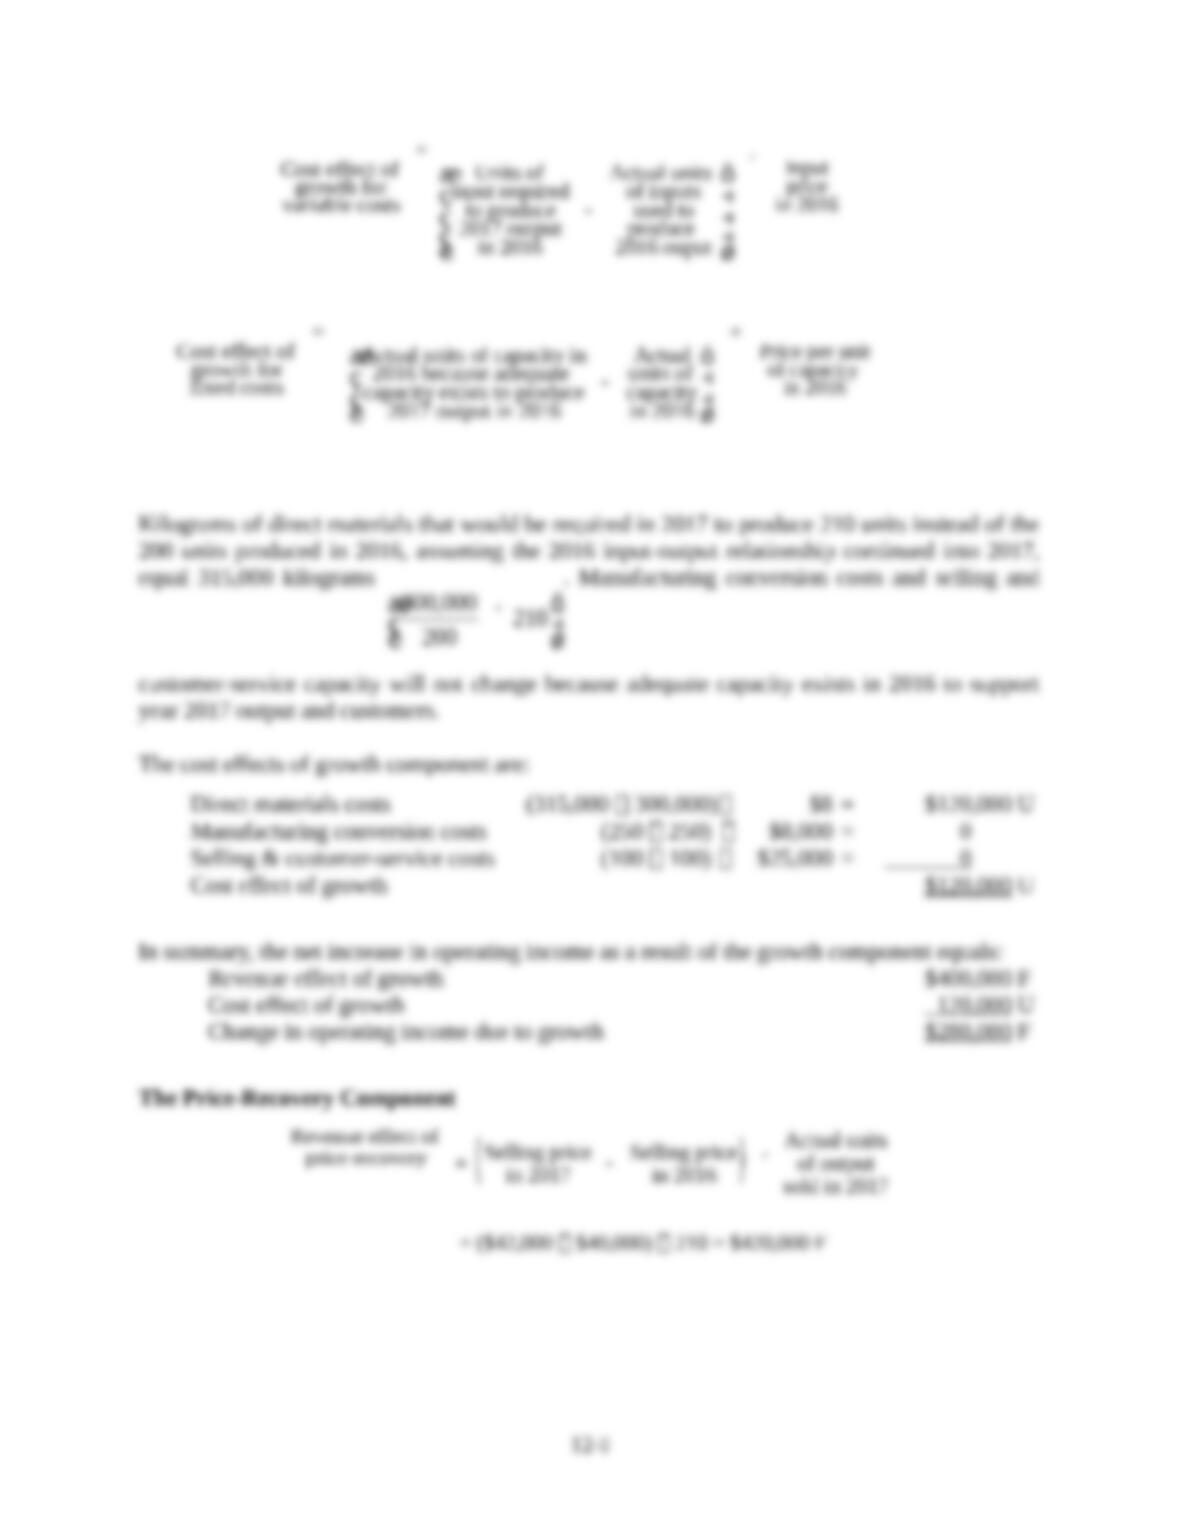
Kilograms of direct materials that would be required in 2017 to produce 210 units instead of the
200 units produced in 2016, assuming the 2016 input-output relationship continued into 2017,
equal 315,000 kilograms
300,000 210
200
æ ö
´
ç ÷
è ø
. Manufacturing conversion costs and selling and
customer-service capacity will not change because adequate capacity exists in 2016 to support
year 2017 output and customers.
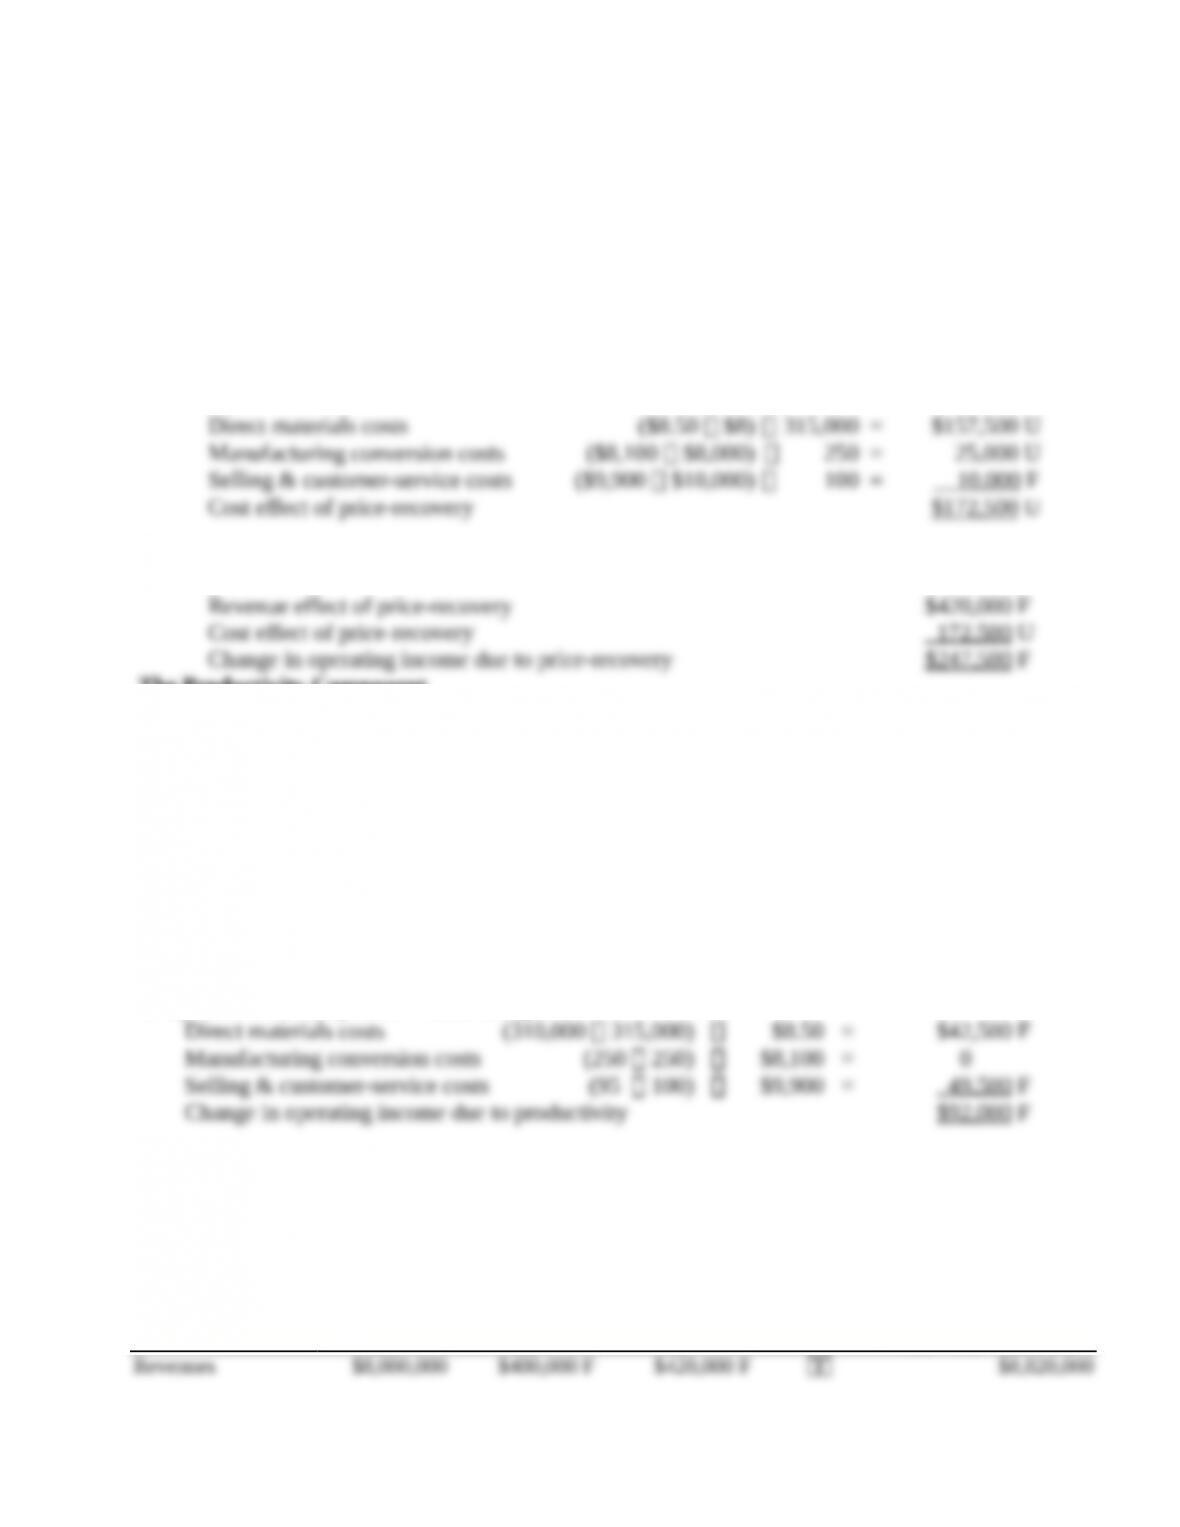
The cost effects of growth component are:
Direct materials costs (315,000 300,000) $8 = $120,000 U
Manufacturing conversion costs (250 250) $8,000 = 0
Selling & customer-service costs (100 100) $25,000 = 0
Cost effect of growth $120 ,000 U
In summary, the net increase in operating income as a result of the growth component equals:
The Price-Recovery Component
Revenue effect of
price-recovery
()
Actual units
Selling price Selling price
= of output
in 2017 in 2016 sold in 2017
– ´
12-8
Cost effect of
price-recovery for
variable costs
=
Input Input
price in price in
2017 2016
–
æ ö
ç ÷
è ø
×
Units of input
required to
produce 2017
output in 2016
Cost effect of
price-recovery for
fixed costs
=
Price per Price per
unit of unit of
capacity capacity
in 2017 in 2016
–
æ ö
ç ÷
ç ÷
è ø
×
Actual units of capacity in
2016 because adequate
capacity exists to produce
2017 output in 2016
In summary, the net increase in operating income as a result of the price-recovery component equals:
The Productivity Component
Cost effect of
productivity for
variable costs
=
Actual units of Units of input
input used required to
to produce produce 2017
2017 output ouput in 2016
–
æ ö
ç ÷
ç ÷
è ø
´
Input
price
in 2017
Cost effect of
productivity for
fixed costs
=
Actual Actual units of capacity in
units of 2016 because adequate
capacity capacity exists to produce
in 2017 2017 output in 2016
–
æ ö
ç ÷
ç ÷
è ø
´
Price per
unit of
capacity
in 2017
The productivity component of cost changes are
The change in operating income between 2016 and 2017 can be analyzed as follows:
Income
Statement
Amounts
in 2016
(1)
Revenue and
Cost Effects
of Growth
Component
in 2017
(2)
Revenue and
Cost Effects of
Price-Recovery
Component
in 2017
(3)
Cost Effect
of
Productivity
Component
in 2017
(4)
Income
Statement
Amounts in 2017
(5) =
(1) + (2) + (3) + (4)
12-8
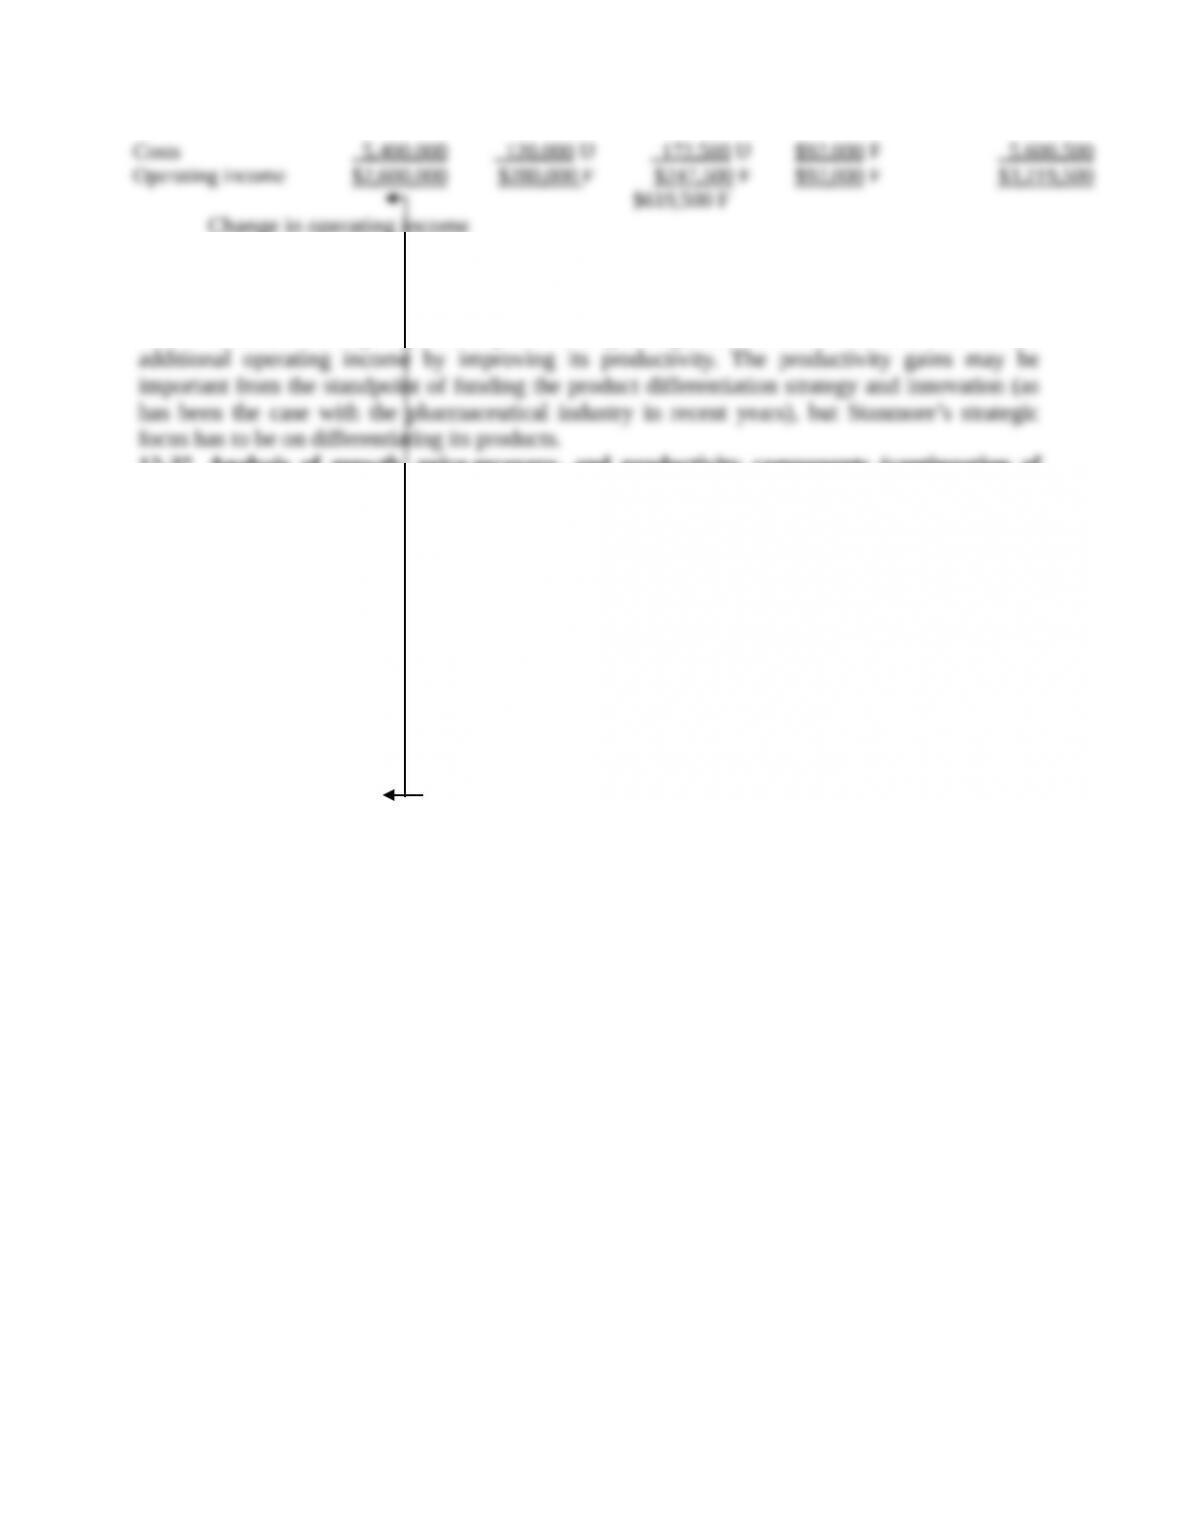
Change in operating income
3. The analysis of operating income indicates that a significant amount of the increase in
operating income resulted from Stanmore’s product differentiation strategy. The company was
able to continue to charge a premium price while growing sales. Stanmore was also able to earn
12-27 Analysis of growth, price-recovery, and productivity components (continuation of
12-25 and 12-26). Suppose that during 2017, the market for Stanmore’s special-purpose
machines grew by 3%. All increases in market share (that is, sales increases greater than 3%) are
the result of Stanmore’s strategic actions.
Required:
Calculate how much of the change in operating income from 2016 to 2017 is due to the
industry-market-size factor, product differentiation, and cost leadership. How successful has
Stanmore been in implementing its strategy? Explain.
12-8