CHAPTER 12
STRATEGY, BALANCED SCORECARD, AND
STRATEGIC PROFITABILITY ANALYSIS
12-1 Define strategy.
12-2 Describe the five key forces to consider when analyzing an industry.
The five key forces to consider in industry analysis are: (1) competitors, (2) potential entrants
12-3 Describe two generic strategies.
Two generic strategies are (1) product differentiation, an organization’s ability to offer products
12-4 What is a customer preference map, and why is it useful?
12.5 What is reengineering?
12-6 What are four key perspectives in the balanced scorecard?
The four key perspectives in the balanced scorecard are (1) Financial perspective—this
perspective evaluates the profitability of the strategy and the creation of shareholder value;
12-1
12-7 What are the five types of conditions to consider when evaluating a strategy map?
A strategy map is a diagram that describes how an organization creates value by connecting
strategic objectives in explicit cause-and-effect relationships with each other in the financial,
12-8 Describe three features of a good balanced scorecard.
A good balanced scorecard design has several features:
1. It tells the story of a company’s strategy by articulating a sequence of cause-and-effect
relationships.
2. It helps to communicate the strategy to all members of the organization by translating the
strategy into a coherent and linked set of understandable and measurable operational
12-9 What are three important pitfalls to avoid when implementing a balanced scorecard?
Pitfalls to avoid when implementing a balanced scorecard are the following:
1. Don’t assume the cause-and-effect linkages are precise; they are merely hypotheses. An
12-10 Describe three key components in doing a strategic analysis of operating income.
Three key components in doing a strategic analysis of operating income are:
1. The growth component, which measures the change in operating income attributable
2. The price-recovery component, which measures the change in operating income
3. The productivity component, which measures the change in costs attributable to a change
12-2
12-11 Why might an analyst incorporate the industry-market-size factor and the
interrelationships among the growth, price-recovery, and productivity components into a
strategic analysis of operating income?
An analyst can incorporate other factors such as the growth in the overall market and reductions
in selling prices resulting from productivity gains into a strategic analysis of operating income.
12-12 How does an engineered cost differ from a discretionary cost?
Engineered costs result from a cause-and-effect relationship between the cost driver, output, and
12-13 What is downsizing?
Downsizing (also called rightsizing) is an integrated approach configuring processes, products,
12-14 What is a partial-productivity measure?
A partial productivity measure is the quantity of output produced divided by the quantity of an
12-15 “We are already measuring total factor productivity. Measuring partial productivities
would be of no value.” Do you agree? Comment briefly.
No. Total factor productivity (TFP) and partial productivity measures work best together because
12-3
12-16 Jacobs Inc. is a relatively new company that has established a position in the highly
competitive biotechnology industry. Which of the following statements is correct regarding
Jacobs’ profitability?
a. Profits will increase when buyers have lower switching costs.
b. Significant up-front capital requirements for new entrants will help Jacobs’ profit margins.
c. Profitability is diminished when there are many suppliers.
d. Rival firms willing to spend a lot of money on advertising will increase Jacobs’ profits
SOLUTION
Choice “a” is incorrect. Profits will increase when buyers have higher switching costs because they are
less likely to search for other firms to meet their needs.
Choice “c” is incorrect. Profitability increases when there are many suppliers.
Choice “d” is incorrect. If rival firms are willing to spend a lot on advertising, Jacobs’ profits will likely
suffer as it tries to keep up with its competitors.
12-17 The balanced scorecard describes all of the following except which one?
a. The descriptions of critical initiatives for the organization’s performance.
b. The strategic goals.
c. The related measures associated with strategic and tactical goals.
d. The definition of strategic business
SOLUTION
Choice “d” is correct. The balanced scorecard does not define strategic businesses of a company. It takes
the businesses and strategies as given and describes objectives and measures to implement those
strategies. Similarly, the balanced scorecard does not define strategic business units. Strategic business
12-18 Canarsie Corporation uses a balanced scorecard to evaluate its digital camera
manufacturing operation. Which of the following statements with respect to balanced scorecards
is/are correct?
I. A balanced scorecard reports management information regarding organizational performance
in achieving goals classified by critical success factors to demonstrate that no single
dimension of organizational performance can be relied upon to evaluate success.
II. Performance measures used in a balanced scorecard tend to be divided into financial,
customer, internal business process, and learning and growth.
12-4
III.In a balanced scorecard, internal business processes are what the company does in its
attempts to satisfy customers.
1. I and II only are correct.
2. II and III only are correct.
3. III only is correct.
4. I, II, and III are correct
SOLUTION
Choice 2 is correct. The balanced scorecard divides performance measures into financial, customer,
internal business process, and learning and growth (item II) and internal business processes are what the
12-19 Balanced scorecard. Pineway Electric manufactures electric motors. It competes and
plans to grow by selling high-quality motors at a low price and by delivering them to customers
in a reasonable time after receiving customers’ orders. There are many other manufacturers who
produce similar motors. Pineway believes that continuously improving its manufacturing
processes and having satisfied employees are critical to implementing its strategy in 2017.
Required:
1. Is Pineway’s 2017 strategy one of product differentiation or cost leadership? Explain briefly.
2. Ramsey Corporation, a competitor of Pineway, manufactures electric motors with more
sizes and features than Pineway at a higher price. Ramsey’s motors are of high quality but
require more time to produce and so have longer delivery times. Draw a simple customer
preference map as in Exhibit 12-1 for Pineway and Ramsey using the attributes of price,
delivery time, quality, and design features.
3. Draw a strategy map as in Exhibit 12-2 with at least two strategic objectives you would expect
to see under each balanced scorecard perspective. Identify what you believe are any (a) strong
ties, (b) focal points, (c) trigger points, and (d) distinctive objectives. Comment on the
structural analysis of your strategy map.
4. For each strategic objective indicate a measure you would expect to see in Pineway’s
balanced scorecard for 2017.
SOLUTION
(15 min.) Balanced scorecard.
1. Pineway Electric’s 2017 strategy is a cost leadership strategy. Pineway plans to grow by
producing high-quality motors at a low cost delivered to customers at a low price and in a timely
12-5
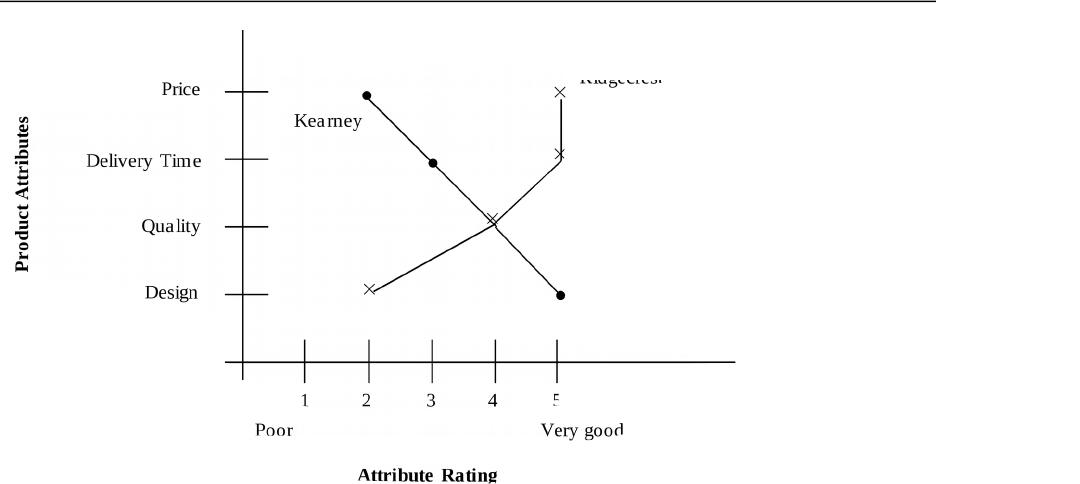
2. Solution Exhibit 12-19A shows the customer preference map for electric motors for
Pineway and Ramsey on price, timeliness, quality, and design.
SOLUTION EXHIBIT 12-19A
Customer Preference Map for Electric Motors
12-6
Pineway
Ramsey
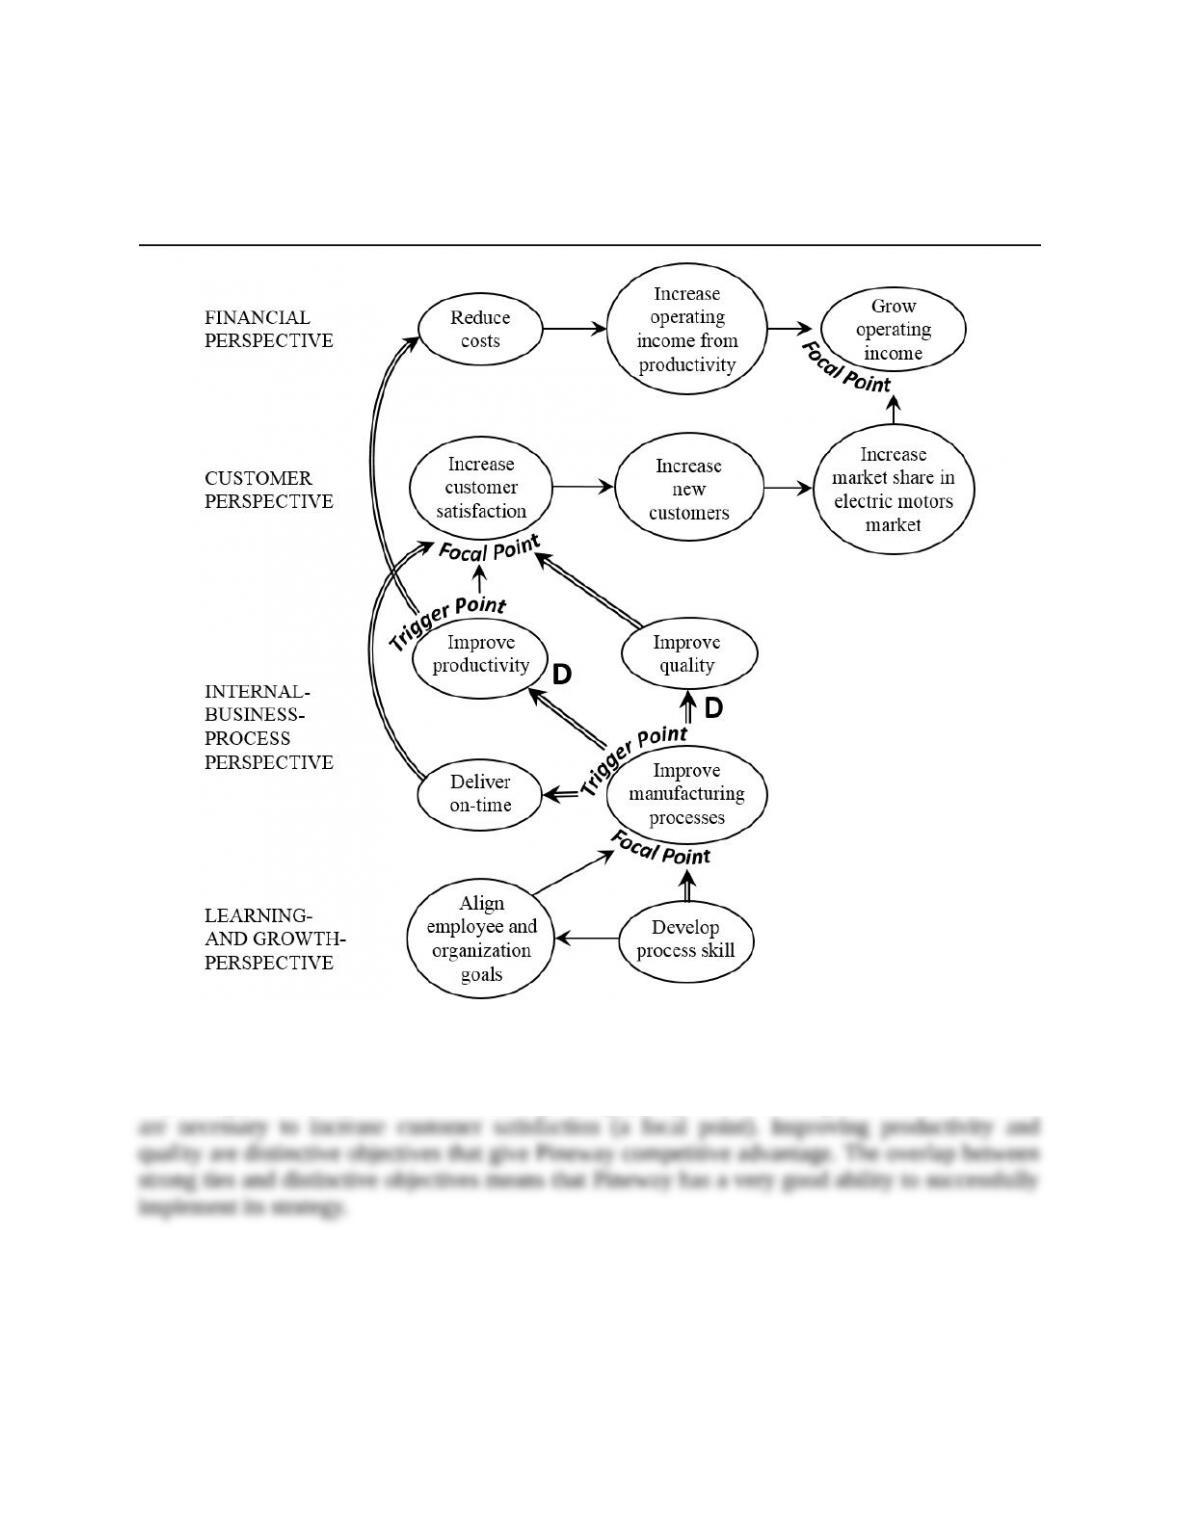
3. Solution Exhibit 12-19B presents the strategy map for Pineway for 2017.
SOLUTION EXHIBIT 12-19B
Strategy Map for Pineway for 2017
The strategy map indicates that developing process skill is an important objective because it has
a strong tie to improving manufacturing processes that is a trigger point that has strong ties to
improving productivity to reduce costs, improving quality, and delivering on-time, all of which
4. Measures that we would expect to see on a Pineway’s balanced scorecard for 2017 are
Financial Perspective
(1) Operating income from productivity gain, (2) operating income from growth, (3) cost
reductions in key areas.
12-7
Customer Perspective
(1) Market share in electric motors market, (2) number of new customers, (3) customer
Internal Business Process Perspective
(1) Productivity, (2) defect rates (2) order delivery time, (3) on-time delivery, (4) number of
major process improvements.
Learning and Growth Perspective
(1) Percentage of employees trained in process and quality management, (2) employee
satisfaction ratings.
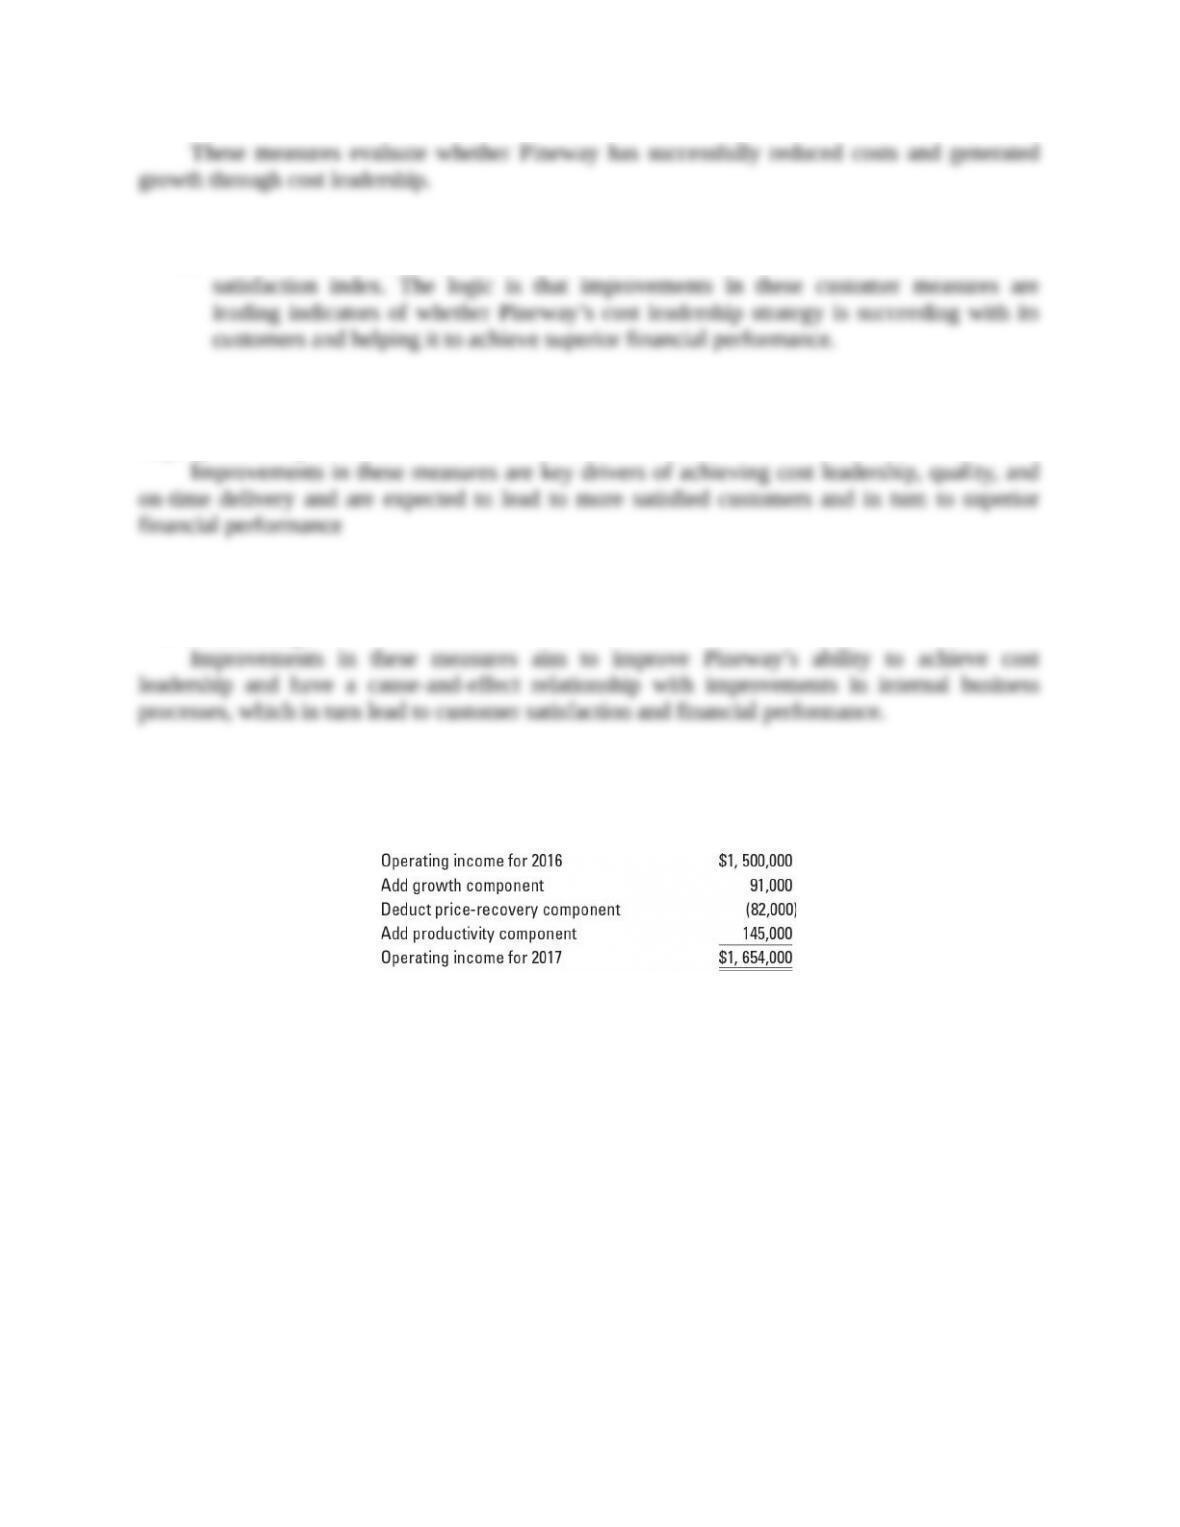
12-20 Analysis of growth, price-recovery, and productivity components (continuation of
12-19). An analysis of Pineway’s operating-income changes between 2016 and 2017 shows the
following:
The industry market size for electric motors did not grow in 2017, input prices did not change,
and Pineway reduced the prices of its motors.
Required:
1. Was Pineway’s gain in operating income in 2017 consistent with the strategy you identified
in requirement 1 of Exercise 12-19?
2. Explain the productivity component. In general, does it represent savings in only variable
costs, only fixed costs, or both variable and fixed costs?
SOLUTION
(20 min.) Analysis of growth, price-recovery, and productivity components (continuation of
12-19).
12-8
1. Pineway’s operating income gain is consistent with the cost leadership strategy identified
in requirement 1 of Exercise 12-19. The increase in operating income in 2017 was driven by the
2. The productivity component measures the change in costs attributable to a change in the
quantity and mix of inputs used in a year relative to the quantity and mix of inputs that would
The productivity component represents savings in both variable costs and fixed costs.
With respect to variable costs, such as direct materials, productivity improvements immediately
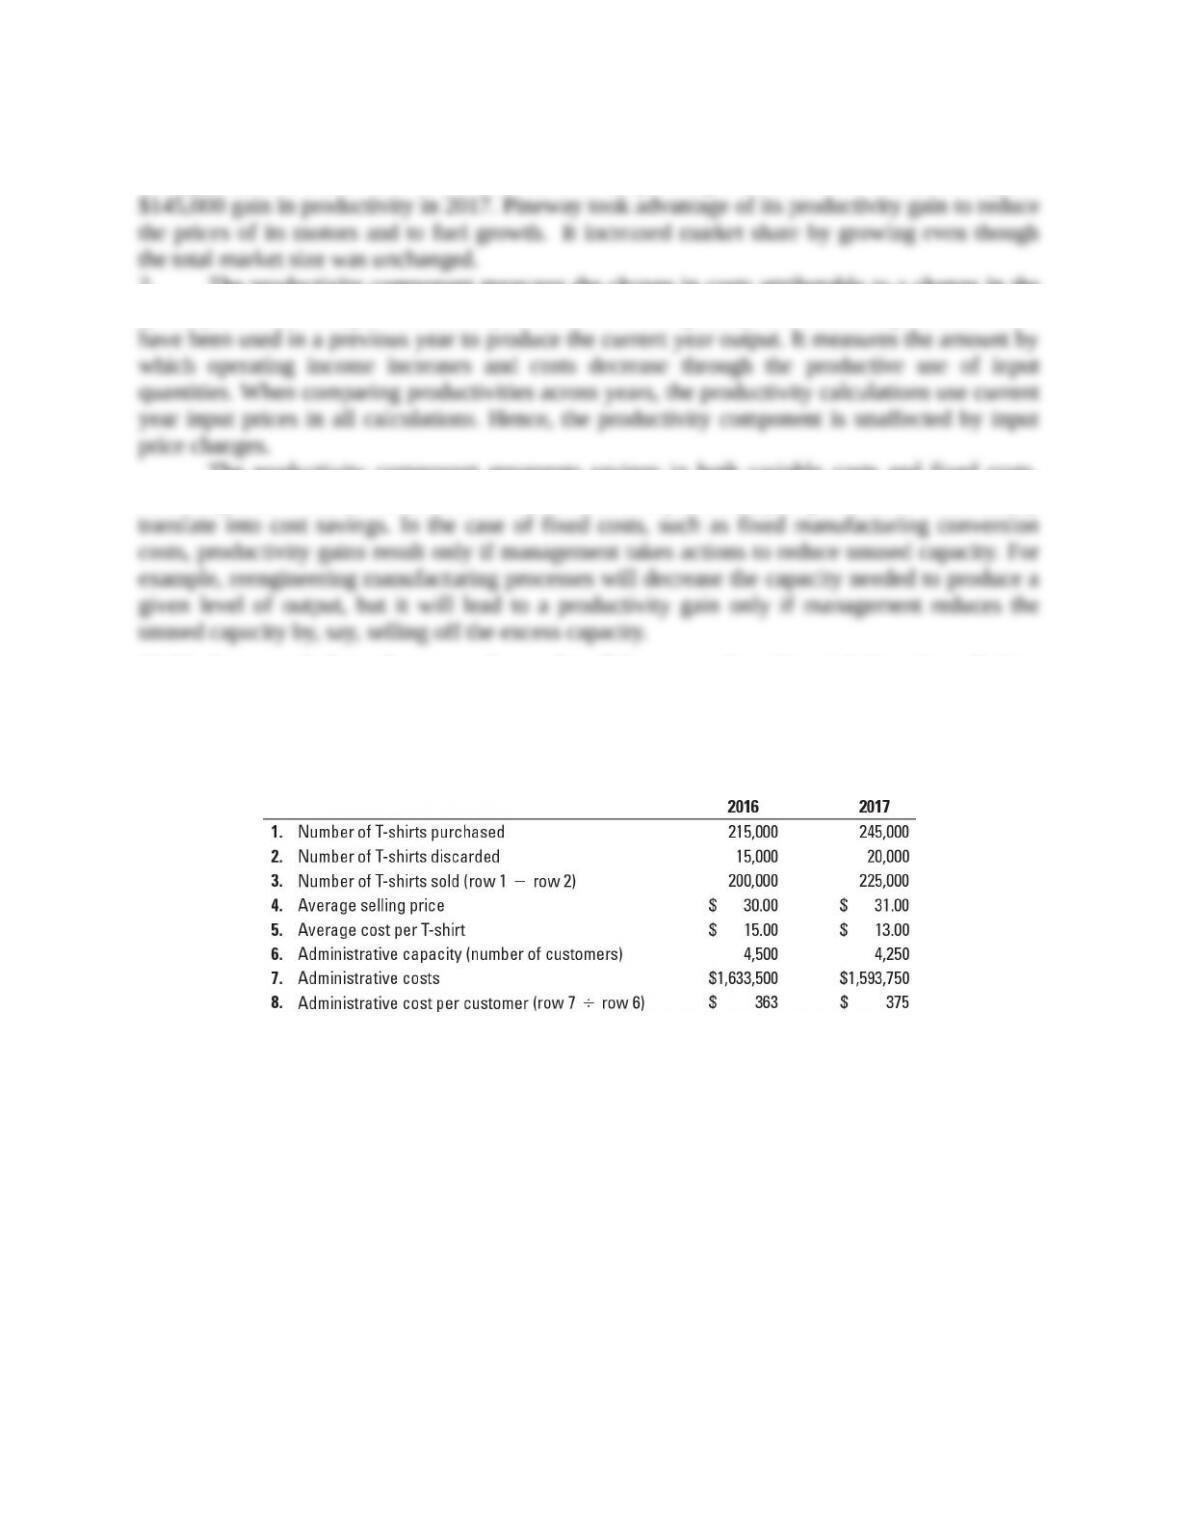
12-21 Strategy, balanced scorecard, merchandising operation. Gianni & Sons buys T-shirts
in bulk, applies its own trendsetting silk-screen designs, and then sells the T-shirts to a number of
retailers. Gianni wants to be known for its trendsetting designs, and it wants every teenager to be
seen in a distinctive Gianni T-shirt. Gianni presents the following data for its first two years of
operations, 2016 and 2017.
Administrative costs depend on the number of customers Gianni has created capacity to support,
not on the actual number of customers served. Gianni had 3,600 customers in 2016 and 3,500
customers in 2017.
Required:
1. Is Gianni’s strategy one of product differentiation or cost leadership? Explain briefly.
2. Describe briefly the key measures Gianni should include in its balanced scorecard and the
reasons for doing so.
SOLUTION
(20 min.) Strategy, balanced scorecard, merchandising operation.
1. Gianni & Sons follows a product differentiation strategy. Gianni’s designs are
“trendsetting,” its T-shirts are distinctive, and it aims to make its T-shirts a “must have” for each
12-9
2. Possible key elements of Gianni’s balance scorecard, given its product differentiation
strategy:
Financial Perspective
Customer Perspective
(1) Market share in distinctive, name-brand T-shirts, (2) customer satisfaction ratings, (3) number
Internal Business Process Perspective
(1) Quality of silk-screening (number of colors, use of glitter, durability of the design),
Learning and Growth Perspective
(1) Ability to attract and retain talented designers (2) improvements in silk-screening processes,
Improvements in these measures are expected to improve Gianni’s capabilities to produce
12-22 Strategic analysis of operating income (continuation of 12-21). Refer to Exercise
12-21.
Required:
1. Calculate Gianni‘s operating income in both 2016 and 2017.
2. Calculate the growth, price-recovery, and productivity components that explain the change in
operating income from 2016 to 2017.
3. Comment on your answers in requirement 2. What does each of these components indicate?
12-10