Unlock document.
This document is partially blurred.
Unlock all pages and 1 million more documents.
Get Access
116 SUPPLEMENT 7 CA P A C I T Y A N D CO N S T R A I N T MA N A G E M E N T
(b) The basic assumptions made with regard to the ovens
are:
◼ The ovens are of equal quality.
◼ The ovens are of equivalent production capacity.
S7.39 (a) Remember that Year 0 has no discounting.
Initial cost = $1,000,000 Yearly maintenance = $75,000
Salvage cost = $50,000 Yearly dues = $300,000
Interest rate = 0.10 No. of members = 500
Annual dues/member = $600
Year
Cost
Revenues
Profit
PV of $1
NPV
0
$1,075,000
$300,000
–$775,000
1.00
–$775,000
1
75,000
300,000
225,000
.909
$204,525
2
75,000
300,000
225,000
.826
$185,850
3
75,000
300,000
225,000
.751
$168,975
4
75,000
300,000
225,000
.683
$153,675
5
75,000
350,000
275,000
.621
$170,775
Undisc. Profit $400,000
PV Profit $108,800
Assume that dues are collected and maintenance is paid at the begin-
ning of each year. We also assume that the salvage value is generated
at the beginning of the last year. These are simplifications; in reality,
people are likely to join throughout the year, and salvage value may
be the very last transaction.
(b) Special deal comparison: $3,000 for all 6 years. Compare the
PV cash stream of yearly dues from one member to that of the
deal. Since we specified the club will always be full, we can
make the assumption that the member (or her replacement)
will always be paying the annual fee.
Initial cost = $0 Yearly maintenance = $0
Salvage cost = $0 Yearly dues = $600
Interest rate = 0.10
Membership Fee
Year
Cost
Revenues
Profit
PV of $1
NPV
0
$0
$600
$600
1.000
$600
1
0
600
600
.909
$545
Undisc. Profit $3,600
PV Profit $2,875
Because this is less than $3,000, the special deal is worth more to
the health club. Note also: If health club member is using same
interest rates, it’s better for her to pay yearly.
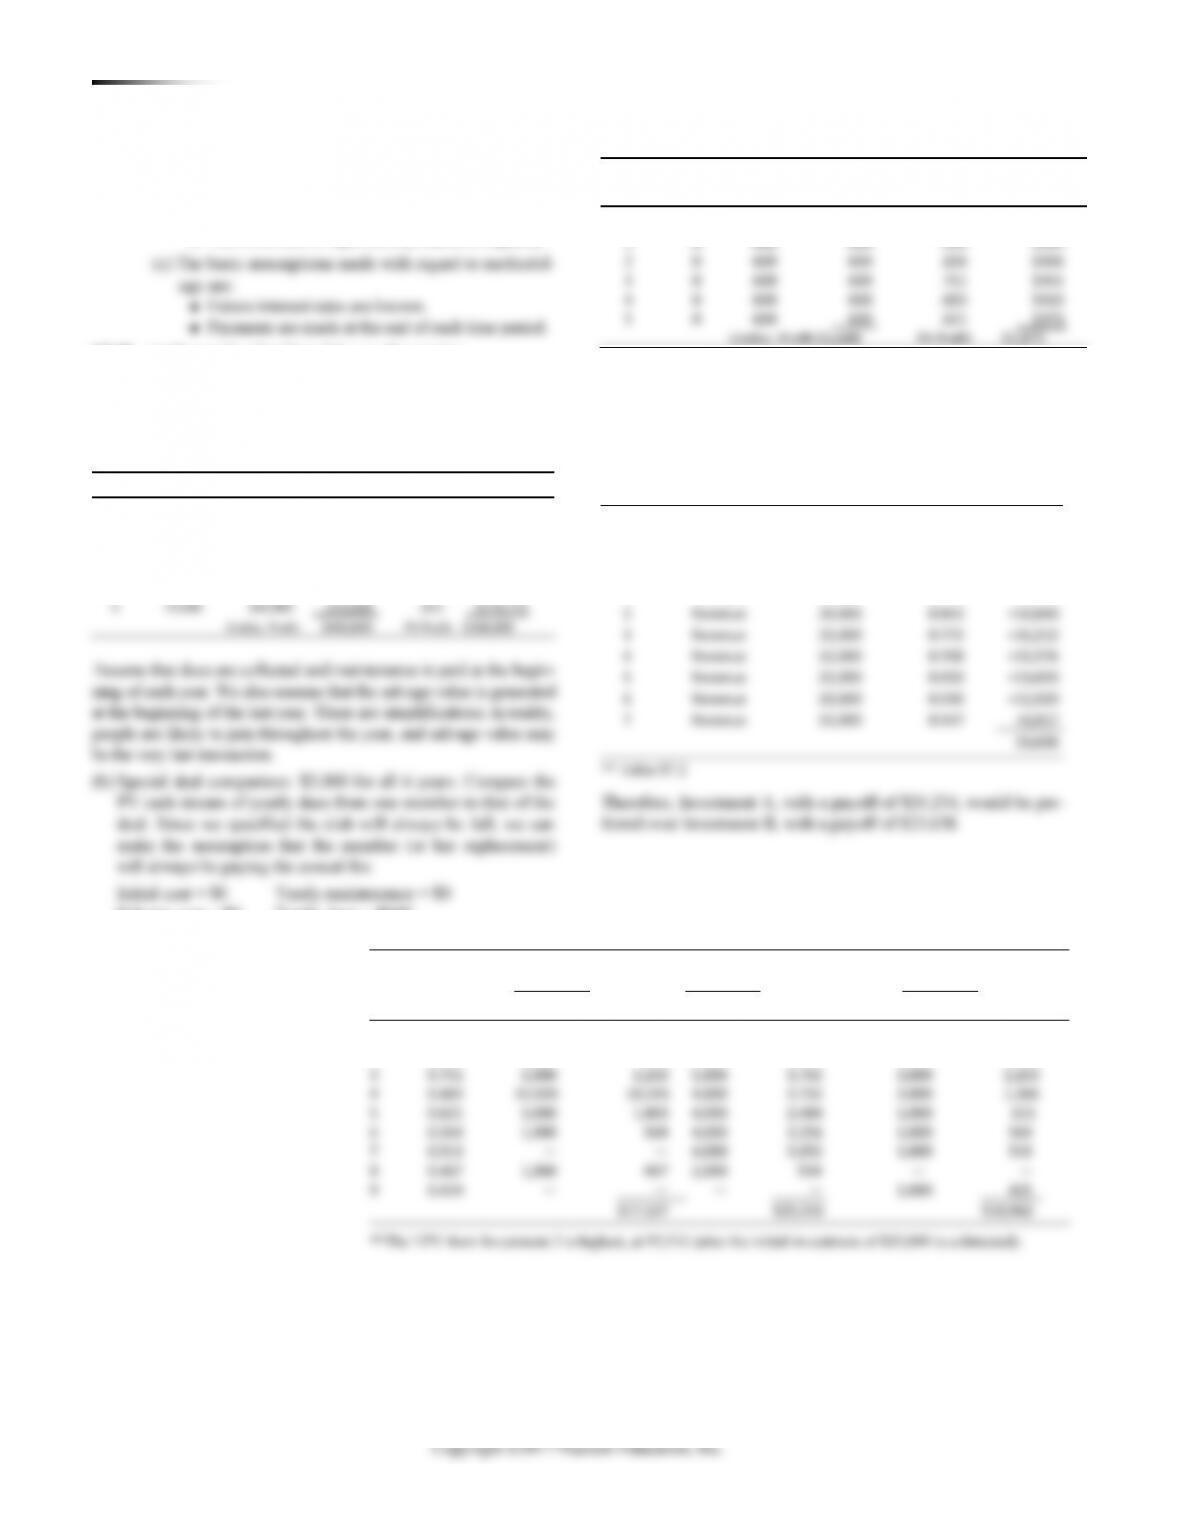
S7.40* Investment A net income, using Table S7.3, 19,000
PVF9%, 6 – 61,000 = 19,000 4.486 – 61,000 = $24,234
Investment B Net Income
Year
NPV Factor**
NPV
Now
Expense
74,000
1.000
–74,000
1
Revenue
19,000
0.917
+17,423
2
Revenue
20,000
0.842
+16,840
3
Revenue
21,000
0.772
+16,212
4
Revenue
22,000
0.708
+15,576
5
Revenue
21,000
0.650
+13,650
6
Revenue
20,000
0.596
+11,920
7
Revenue
11,000
0.547
+6,017
23,638
** Table S7.2
Therefore, Investment A, with a payoff of $24,234, would be pre-
ferred over Investment B, with a payoff of $23,638.
S7.41* Initial investment = $20,000
Cash Flows
NPV
Cash Flow 1
Cash Flow 2
Cash Flow 3
Year
Factor**
Cash
P
Cash
P
Cash
P
1
0.909
$1,000
$909
$7,000
$6,363
$10,000
$9,090
2
0.826
1,000
826
6,000
4,956
5,000
4,130
3
0.751
3,000
2,253
5,000
3,755
3,000
2,253
4
0.683
15,000
10,245
4,000
2,732
2,000
1,366
5
0.621
3,000
1,863
4,000
2,484
1,000
621
6
0.564
1,000
564
4,000
2,256
1,000
564
7
0.513
—
—
4,000
2,052
1,000
513
8
0.467
1,000
467
2,000
934
—
—
9
0.424
—
—
—
—
1,000
425
$17,127
$25,532
$18,962
**The NPV from Investment 2 is highest, at $5,532 (after the initial investment of $20,000 is subtracted).
SUPPLEMENT 7 CA P A C I T Y A N D CO N S TRA I N T MANA G E M E N T 117
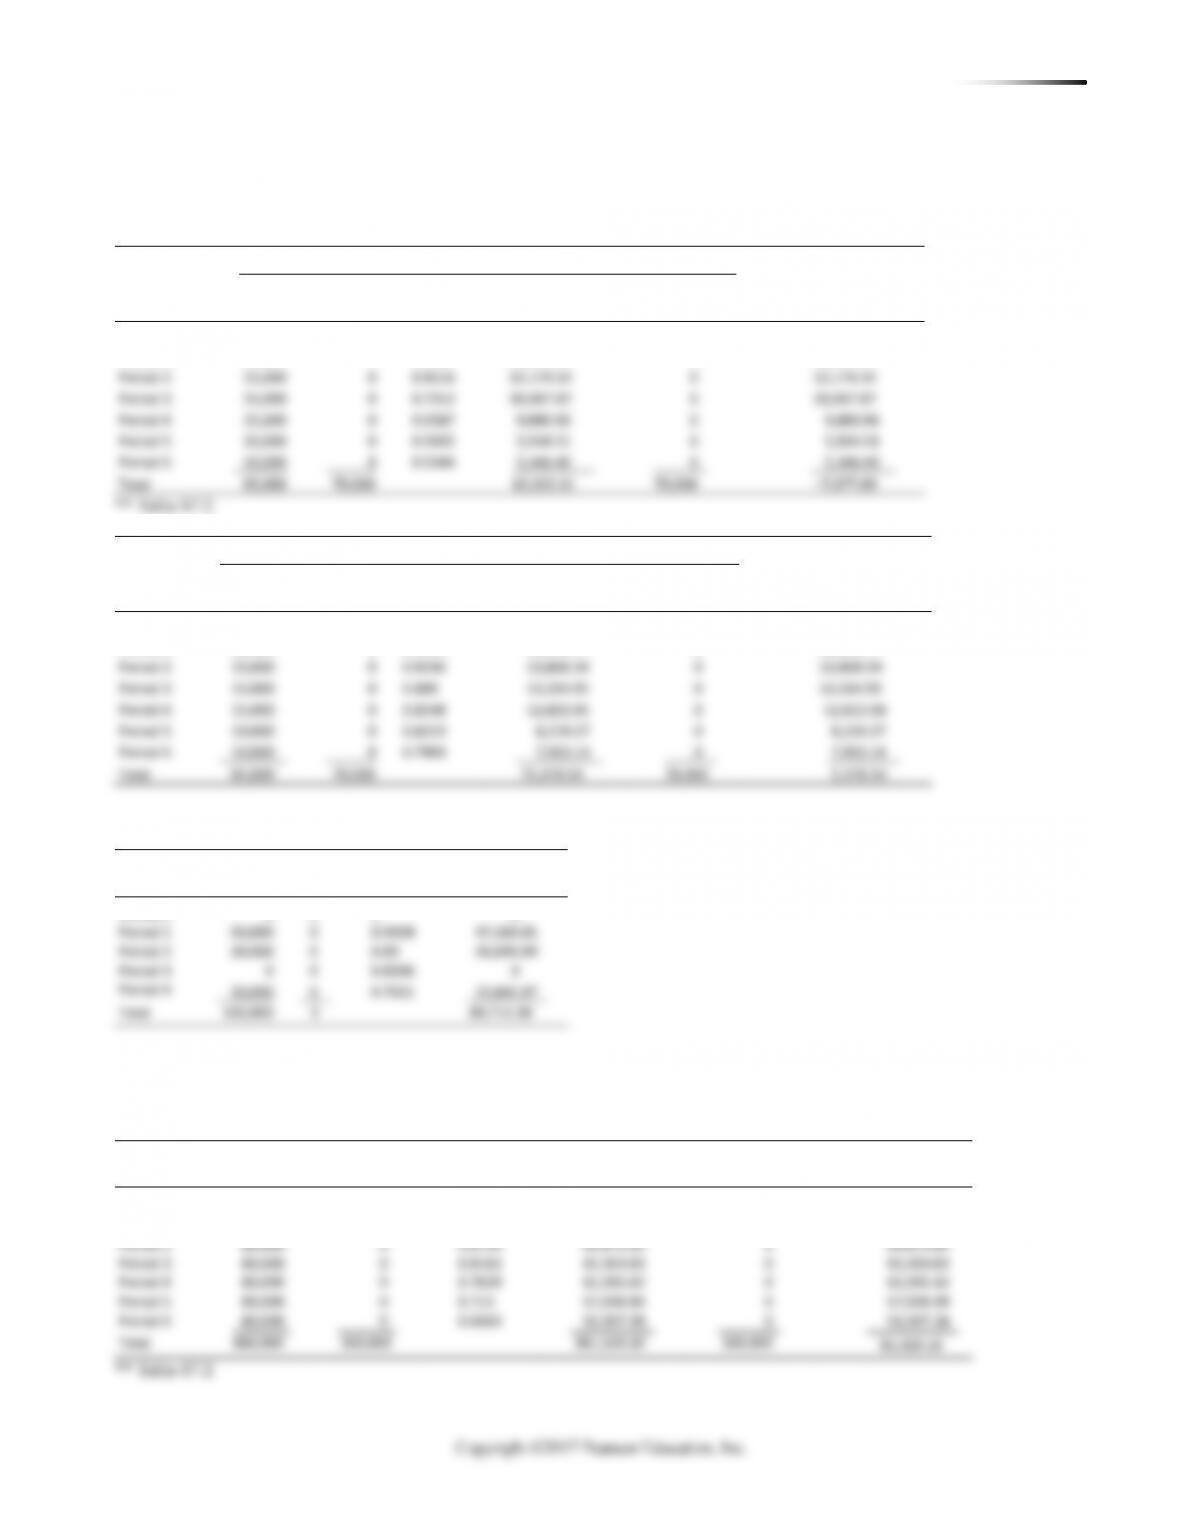
S7.42* At 11%, the net present value is –$7,677.89. At 4%, the
net present value is $5,378.54. They should purchase at 4% but
not at 11%.
S7.43* The net present value of the receipts is $89,711.58.
PV Factor
Inflow
Outflow
at 6%
Present Value
Period 0
0
0
1
0
S7.44* Machine A’s NPV is $81,323.16; machine B’s NPV is
$85,982.66. Machine B has the higher NPV. The lower annual
returns are more than offset by a lower initial cost and by the
salvage value.
Vinyl Siding Machine Solution at 11%
PV Factor
PV
Inflow
Outflow
at 11%**
PV Inflow
PV Outflow
(Inflow–Outflow)
Period 0
0
70,000
1
0
70,000
–70,000
Period 1
20,000
0
0.9009
18,018.02
0
18,018.02
Period 2
15,000
0
0.8116
12,174.34
0
12,174.34
Period 3
15,000
0
0.7312
10,967.87
0
10,967.87
Period 4
15,000
0
0.6587
9,880.96
0
9,880.96
Period 5
10,000
0
0.5935
5,934.51
0
5,934.51
Period 6
10,000
0
0.5346
5,346.40
0
5,346.40
Total
85,000
70,000
62,322.11
70,000
–7,677.89
** Table S7.2.
Vinyl Siding Machine Solution at 4%
PV Factor
PV
Inflow
Outflow
at 4%
PV Inflow
PV Outflow
(Inflow–Outflow)
Period 0
0
70,000
1
0
70,000
–70,000
Period 1
20,000
0
0.9615
19,230.77
0
19,230.77
Period 2
15,000
0
0.9246
13,868.34
0
13,868.34
Period 3
15,000
0
0.889
13,334.95
0
13,334.95
Period 4
15,000
0
0.8548
12,822.06
0
12,822.06
Period 5
10,000
0
0.8219
8,219.27
0
8,219.27
Period 6
10,000
0
0.7903
7,903.14
0
7,903.14
Total
85,000
70,000
75,378.54
70,000
5,378.54
Milling
PV Factor
PV
Machine A
Inflow
Outflow
at 7%**
PV Inflow
PV Outflow
(Inflow–Outflow)
Period 0
0
300,000
1
0
300,000
–300,000
Period 1
80,000
0
0.9346
74,766.35
0
74,766.35
118 SUPPLEMENT 7 CA P A C I T Y A N D CO N S T R A I N T MA N A G E M E N T
S7.45*
PV Factor
Period 1
20,000
0
0.9434
18,867.92
Period 2
0
0
0.89
0
Period 3
30,000
0
0.8396
25,188.58
MyOMLab. (Its running time is 9 minutes.) Also note that the
Global Company Profile in Chapter 6 highlights this hospital.
1. Given the discussion in the text, what approach is APH taking
to match capacity to demand?
2. What kind of major changes can take place in APH’s demand
forecast that would leave the hospital with an underutilized facility
(namely, what are the risks connected with this capacity decision)?
Possible risks:
◼ There is a nursing shortage that could create a staffing bot-
tleneck if not corrected. Recently, the two major hospital
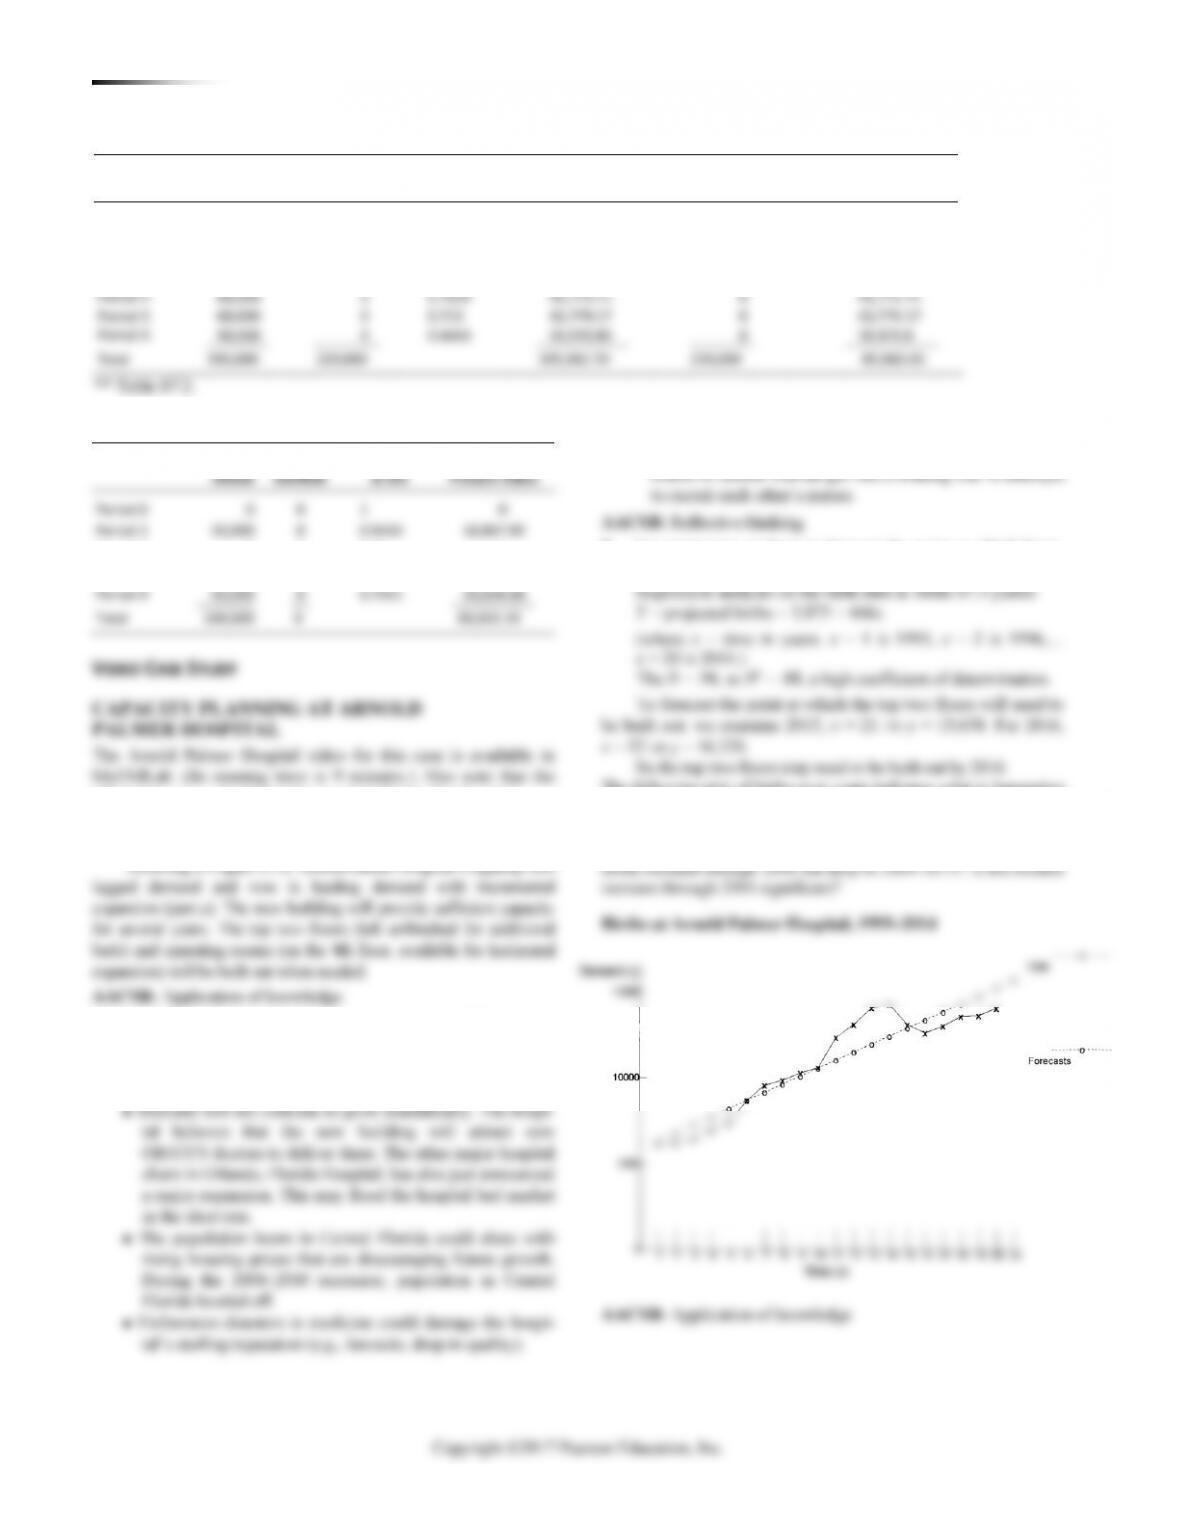
3. Use regression analysis to forecast the point at which Swan-
son needs to “build out” the top two floors of the new building.
The following plot of births over years indicates what is happening
with the actual number of births. This plot may spark an interesting
discussion of the limitations of statistics and suggest more analysis
before building out the additional two stories in 2016. Why did
Milling
PV Factor
PV
Machine B
Inflow
Outflow
at 7%**
PV Inflow
PV Outflow
(Inflow–Outflow)
Period 0
0
220,000
1
0
220,000
–220,000
Period 1
60,000
0
0.9346
56,074.77
0
56,074.77
Period 2
60,000
0
0.8734
52,406.32
0
52,406.32
Period 3
60,000
0
0.8163
48,977.88
0
48,977.88
SUPPLEMENT 7 CA P A C I T Y A N D CO N S TRA I N T MANA G E M E N T 119
ADDITIONAL CASE STUDY (AVAILABLE IN MYOMLAB)
SOUTHWESTERN UNIVERSITY: D
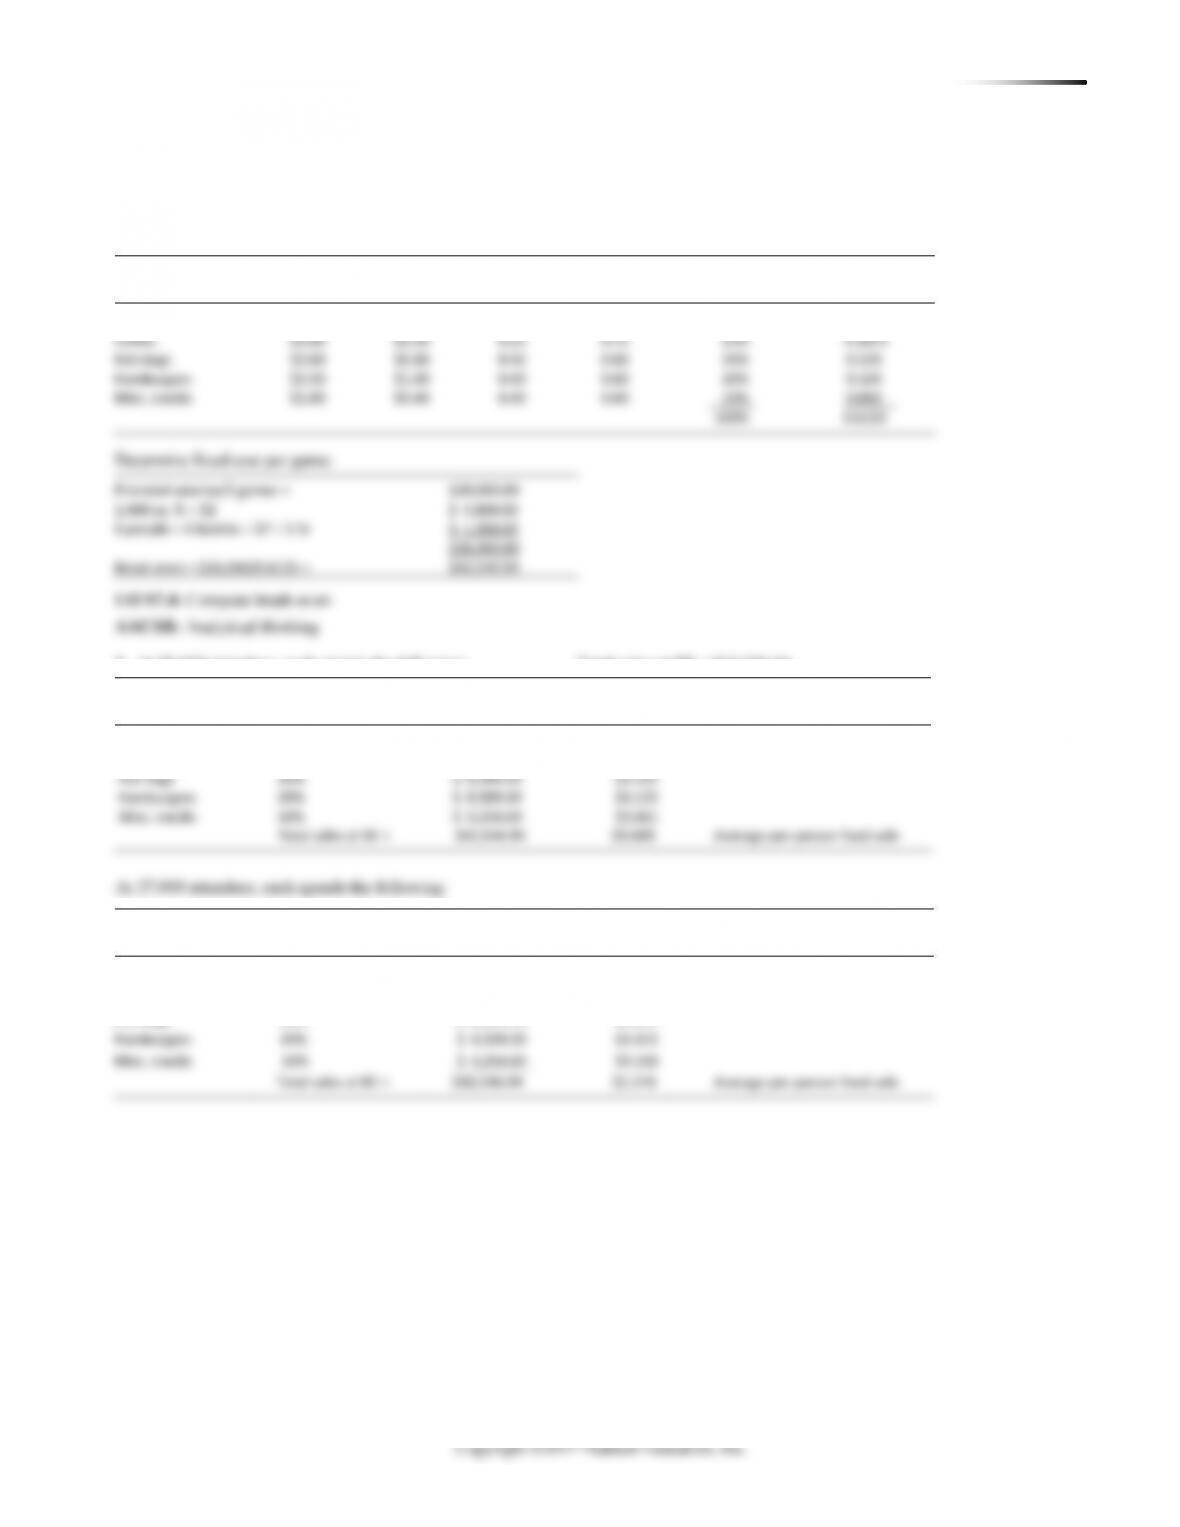
1. Determine weighted contribution.
Prorated salaries/5 games =
$20,000.00
2,400 sq. ft $2
$ 4,800.00
6 people 6 booths $7 5 hr
$ 1,260.00
$26,060.00
Break even = $26,060/0.6125 =
$42,546.94
Selling
Var.
Percent of
Percent
Items
Price/ea
Cost/ea
V/P
(1 –V/P)
Revenues
Contribution
Soft drinks
$1.50
$0.75
0.50
0.50
25%
0.125
Coffee
$2.00
$0.50
0.25
0.75
25%
0.1875
2. At 70,000 attendees, each spends the following:
Total sales at BE = $42,546.94
Percent of
Percent
Sales per Person
Revenues
of Sales
(/70,000)
Soft drinks
25%
$10,636.73
$0.152
Coffee
25%
$10,636.73
$0.152
120 SUPPLEMENT 7 CA P A C I T Y A N D CO N S T R A I N T MA N A G E M E N T
Copyright ©2017 Pearson Education, Inc.
Units sales at breakeven:
Percent of
Percent
Number of Units
Revenues
of Sales
Selling Price
Sold at Break Even
Soft drinks
25%
$10,636.73
$1.50
7,091.2
Coffee
25%
$10,636.73
$2.00
5,318.4
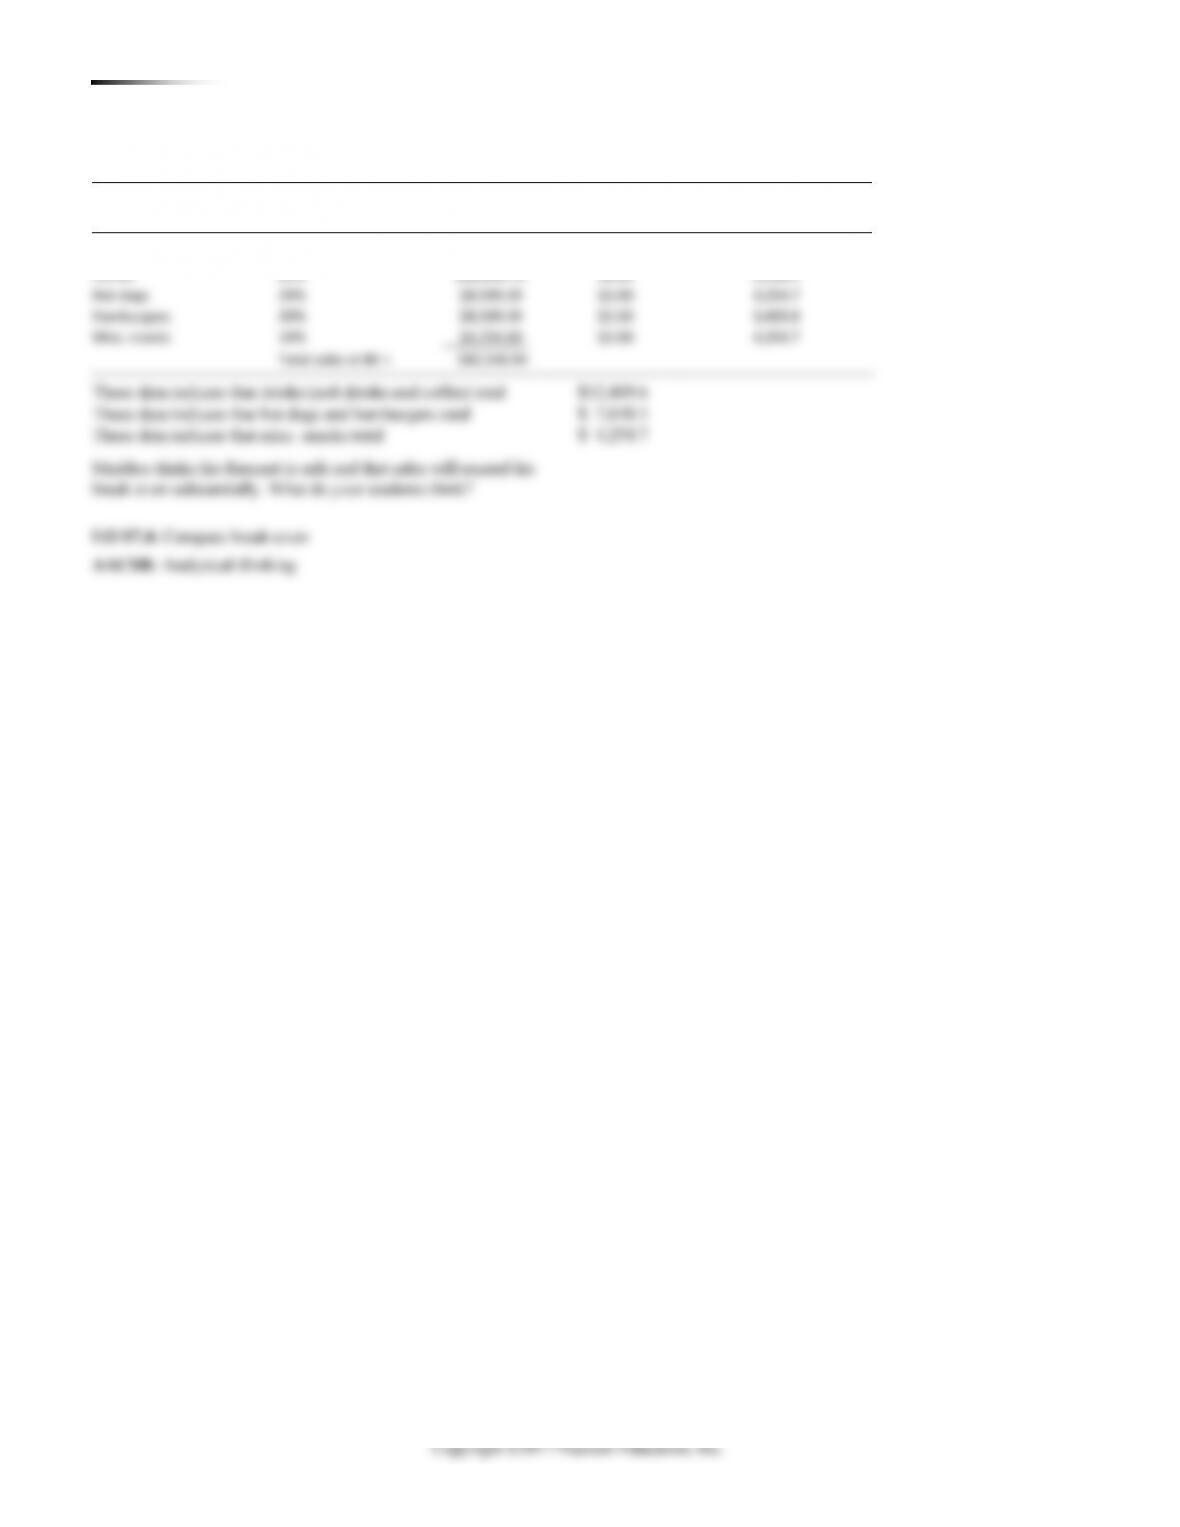
Hot dogs
20%
$8,509.39
$2.00
4,254.7
Hamburgers
20%
$8,509.39
$2.50
3,403.8
Misc. snacks
10%
$4,254.69
$1.00
4,254.7
Total sales at BE =
$42,546.94
These data indicate that drinks (soft drinks and coffee) total $12,409.6
These data indicate that hot dogs and hamburgers total $ 7,658.5
These data indicate that misc. snacks total $ 4,254.7
Maddux thinks his forecast is safe and that sales will exceed his
break even substantially. What do your students think?
LO S7.4: Compute break-even
AACSB: Analytical thinking


