80 CHAPTER 6 MA N A G I N G QU A L I T Y
6.15# Individual responses will vary.
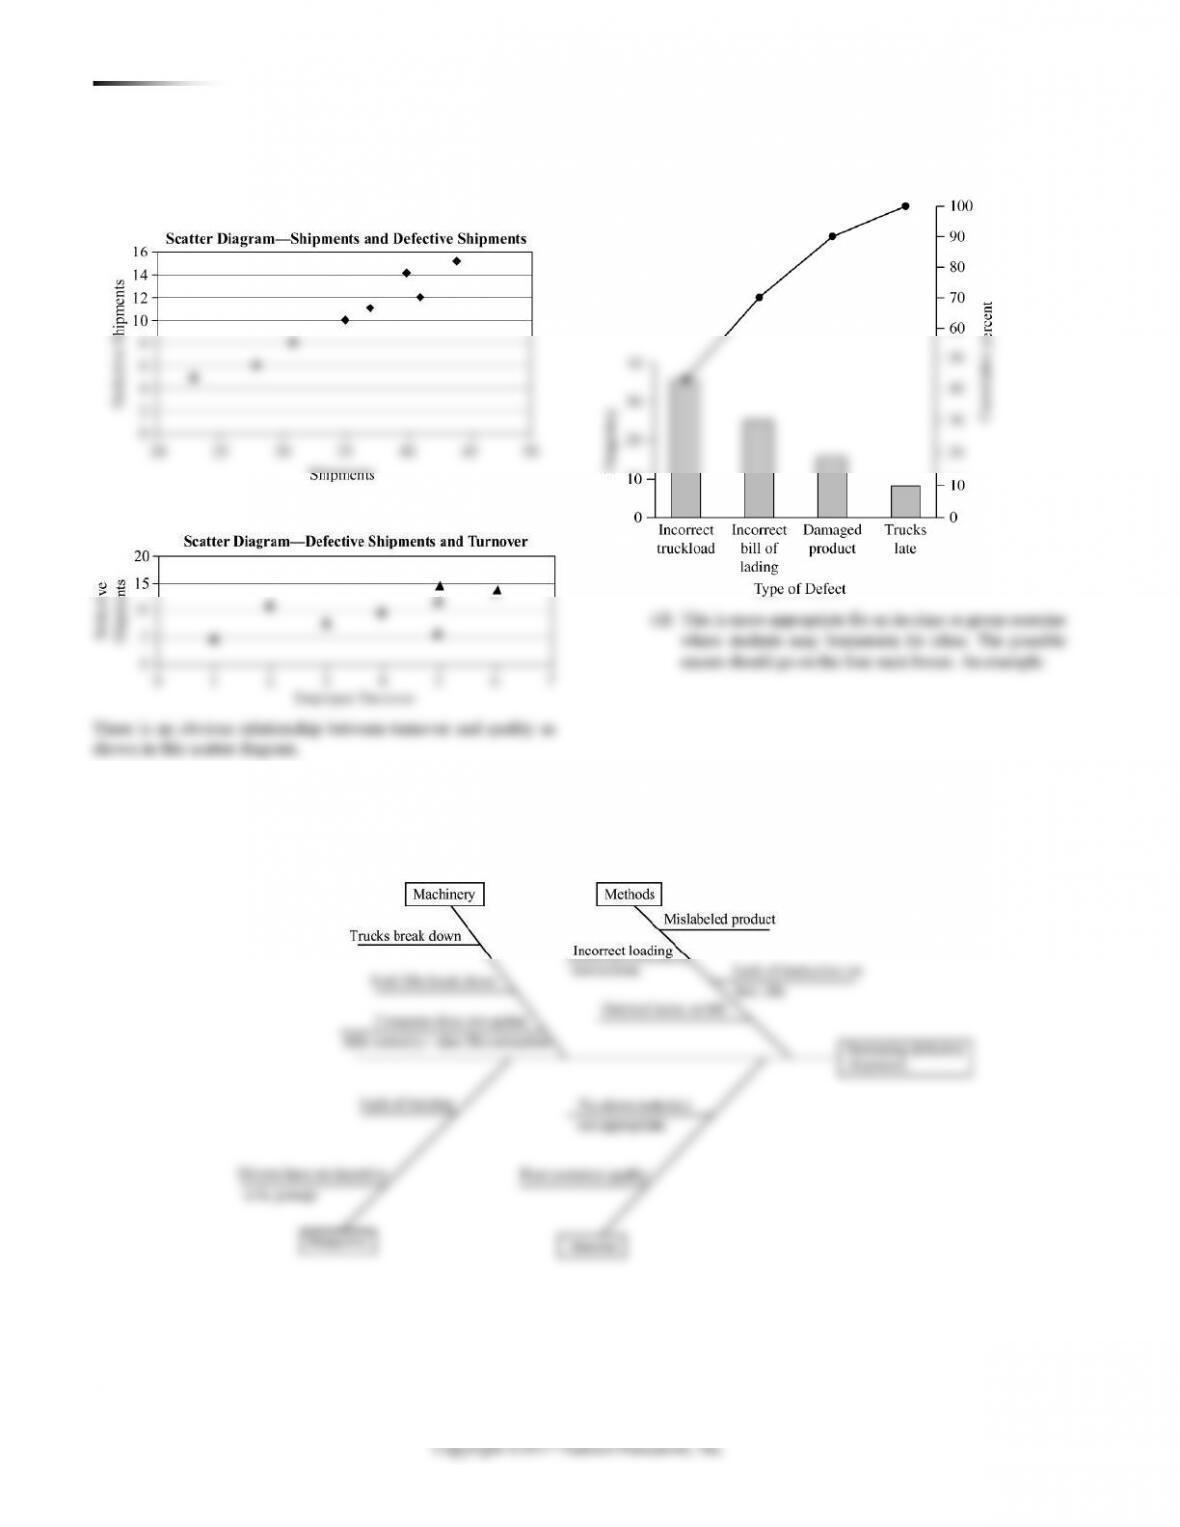
6.16 (a) The scatter diagram shows a strong positive relationship
(b) The scatter diagram will resemble the chart below:
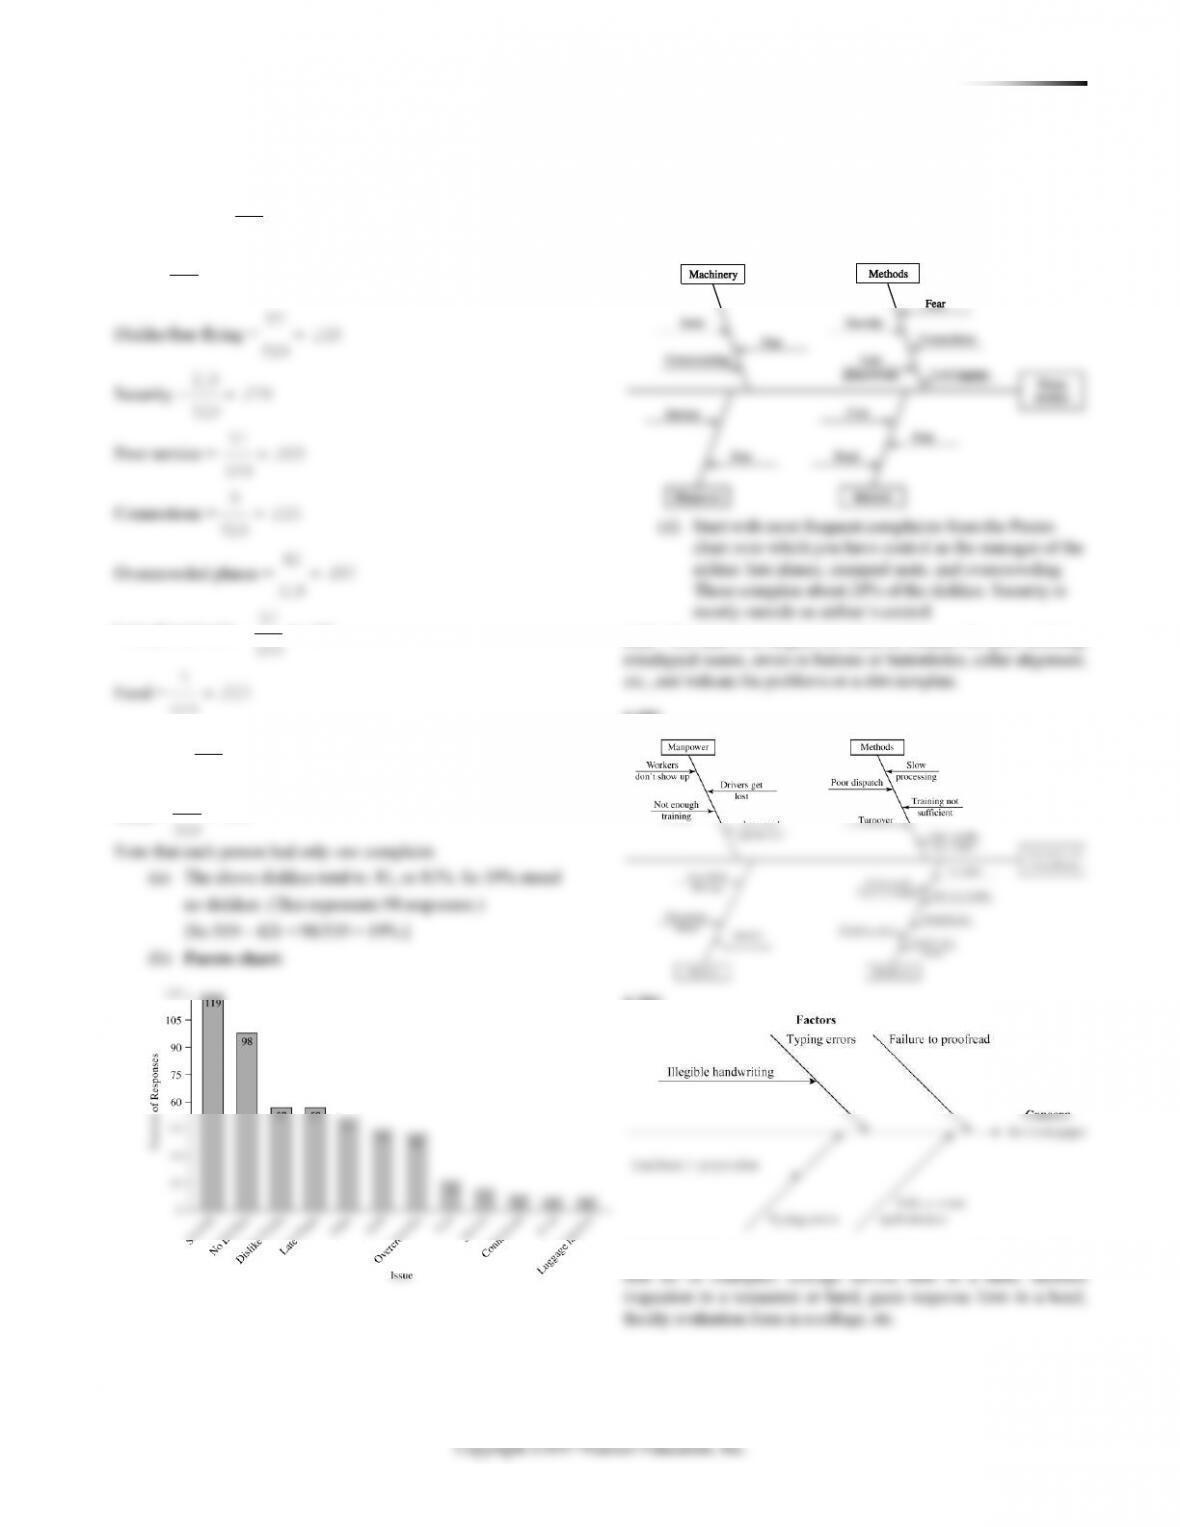
(c) The Pareto chart is:
____________________________________________
CHAPTER 6 MA N A G I N G QU A L I T Y 81
6.17 Conversion of data into percentages in the first step:
Cramped seats =
45
.087
519
=
Cost =
16
.031
519
=
.229
519
=
42
.081
519
=
57
(c) Fishbone diagram. Note that not at all of these are
easily assigned to a specific M. “Fear or dislike of flying”
may be Machinery, Material, Manpower, or Methods
(the way the passenger is treated).

82 CHAPTER 6 MAN A G I N G QU A L I T Y
CASE STUDY
SOUTHWESTERN UNIVERSITY: C
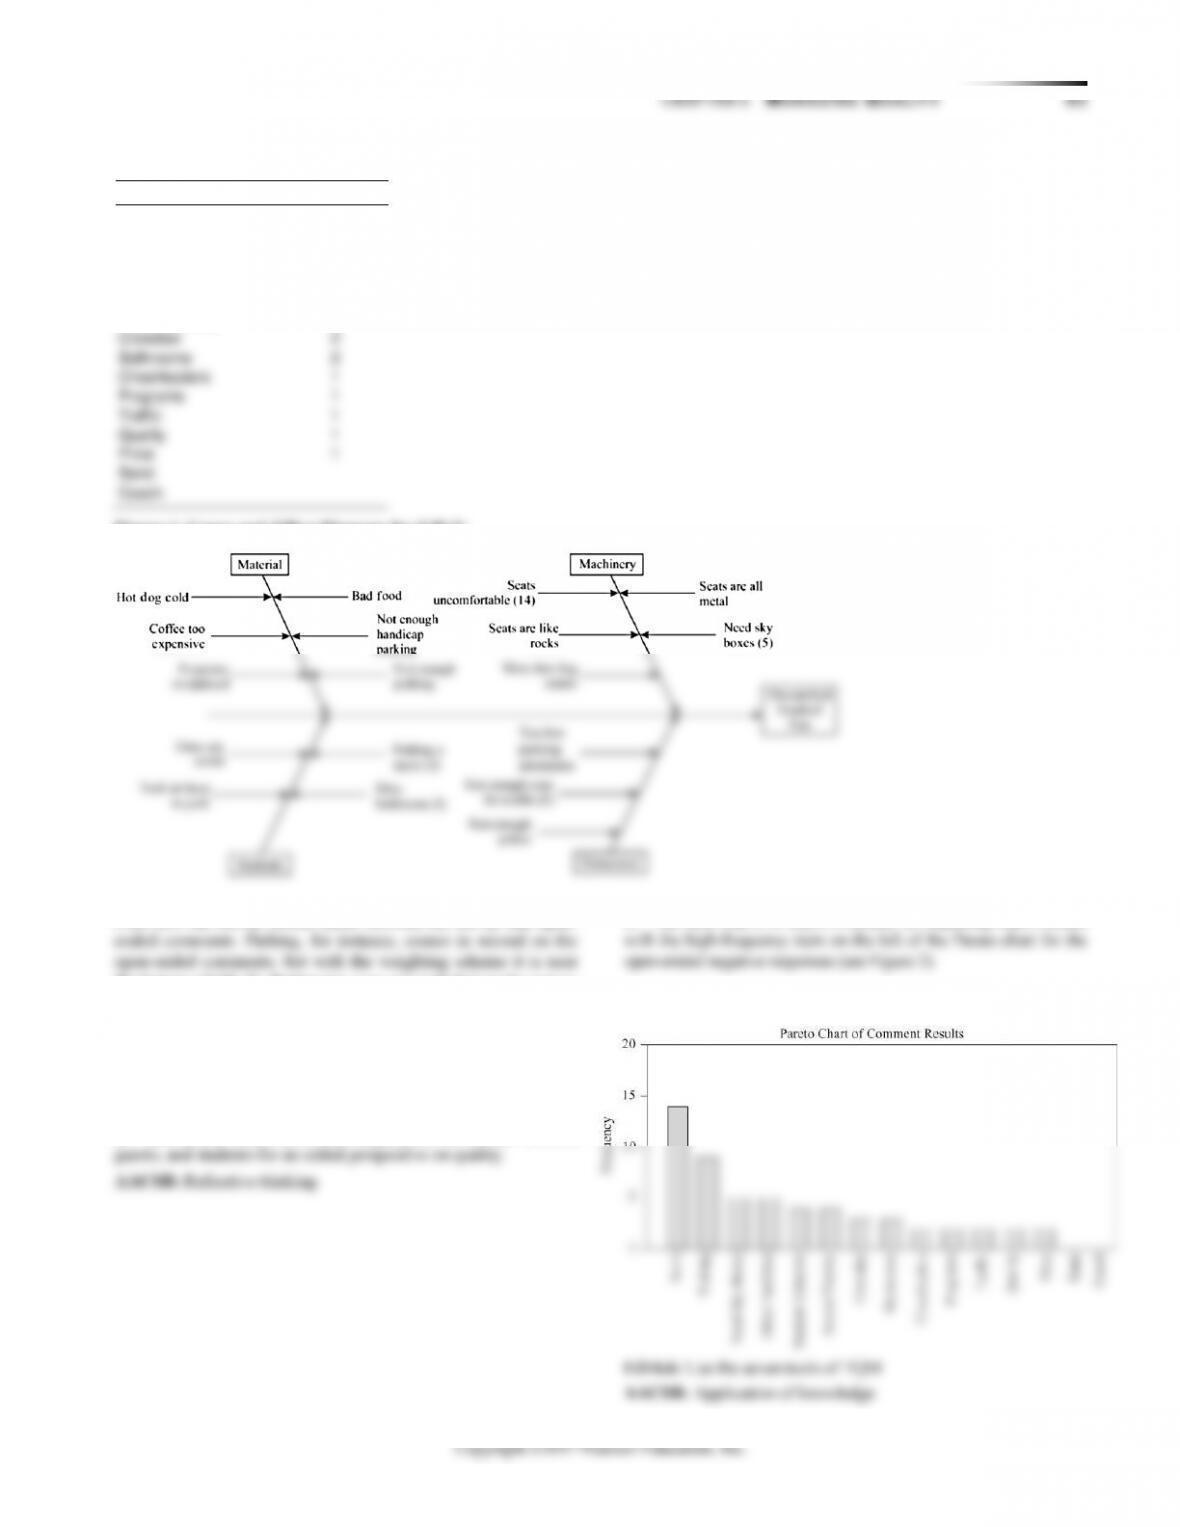
1. There are lots of ways to analyze these data. We suggest getting
the student to begin by considering the tools of TQM and go from
there. Here we have weighted these survey data (from Table 6.7)
with 4 for good and 0 for poor in Table 1 below and then ranked
them. This approach yields the data in descending order (Poor to
Good) in Table 2. Then we take the open-ended questions and look
at both the positive and negative responses (Table 3). Then we rank
these in descending order (most negative to least negative).
Seating
230
35
0
535
2.14
Ticket Pricing
420
312
32
15
0
779
3.12
Food Selection
620
180
48
11
0
859
3.44
Concession Prices
348
116
58
0
586
2.34
Table 2: Items in Weighted Descending Order
Speed of Service
1.66
Poor
Seating
2.14
Printed Program
2.34
Concession Prices
2.34
Traffic
2.41
Season Ticket Plans
2.76
Parking
3.08
Ticket Pricing
3.12
Entertainment
3.23
1
Cheerleaders
5
Other
1
1
Programs
2
Bathroom
—
Band
1
1
Traffic
—
Coach
3
3
Access/Variety
—
Table 1: Survey Data, with No. of Responses Weight Calculated
Weights
Total/250
(Average)
4
3
2
1
0
Total
Parking
360
315
90
5
0
770
3.08
Entertainment
640
105
52
10
0
807
3.23
Traffic
200
255
96
52
0
603
2.41
Printed Program
264
102
196
22
0
584
2.34
Table 3: Open-Ended Comments
Results by Topic
Negative
Entertainment
Positive
Negative
Facilities
Positive
Entertainment
8
14
Seats
—
3
Student Behavior
9
Parking
—
2
Crowded
5
Need Sky Boxes
—
84 CHAPTER 6 MAN A G I N G QU A L I T Y
1
VIDEO CASE STUDIES
THE CULTURE OF QUALITY AT ARNOLD
PALMER HOSPITAL
The Arnold Palmer Hospital (APH) video for this case (10 minutes)
is available in MyOMLab. Also note that the Global Company
Profile that opens this chapter highlights additional issues of quality
related to APH.
1. Why is it important for APH to get the patient’s assessment of
health care quality? Does the patient have the expertise to judge
group of 20 OB/GYNs) to send all their patients to a competing
hospital. Patients cannot accurately judge all aspects of their
medical care, or the care of their child, but they can certainly
2. How would you build a culture of quality in an organization
including APH?
the hospital.
Quality principles:
◼ Quality standards that can be published, measured, and
compared.
◼ Customer focus: Procedures to review patient quality care.
◼ TQM tools techniques that foster quality:
Measurements for the cost of quality.
Plans for dealing with safety and liability problems so
they are studied and not allowed to repeat.
Process controls for such areas as lab tests and pharmacy
prescription errors.
Effective supplier evaluation and development.
JIT suppliers.
Employee fulfillment:
◼ Employee quality circles and programs.
3. What techniques does APH practice in its drive for quality
and continuous improvement?
with the hospital’s quality credo.
◼ Empowers employees at all levels to deal with problems of
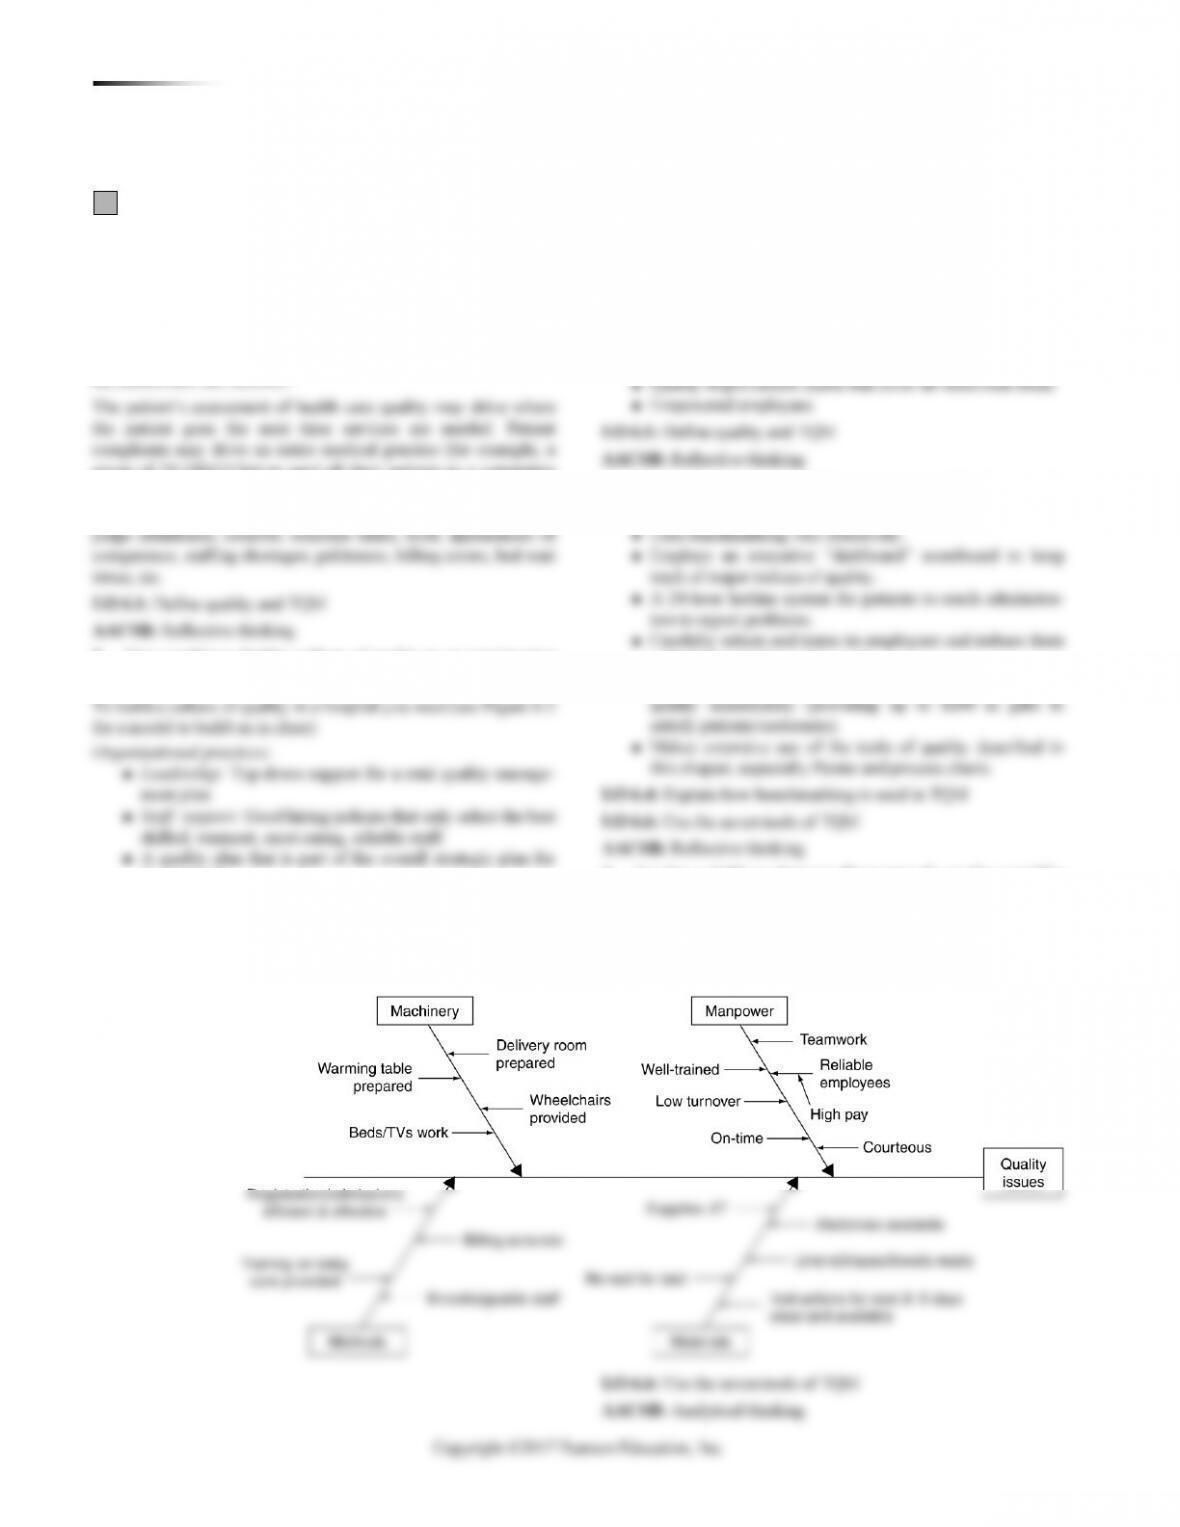
4. Develop a fishbone diagram illustrating the quality variables
for a patient who just gave birth at APH.
CHAPTER 6 MA N A G I N G QU A L I T Y 85
3
2
QUALITY COUNTS AT ALASKA AIRLINES
The 6-minute accompanying video is available in MyOMLab.
1. Alaska Air does have some measure of control over ground
operations even though the entire effort is outsourced to Menzies
LO 6.6: Use the seven tools of TQM
3. What could an airline have done to accommodate a student’s
advising the reason for delays.
AACSB: Reflective thinking
4. Using the table in the case:
QUALITY AT THE RITZ-CARLTON HOTEL
How important is every Customer to our future? Our Finance
Department reports that our break-even Customer per flight in
1994 was 74.5, which means that, on average, only when Customer
#75 came on board did a flight become profitable.
Aside from that statistical data, let me share with you a down-
1. The Ritz-Carlton can monitor quality in the short run
plaints, and ultimately by occupancy rates. There are, of course,
2. For companies that expect quality to be more than a slogan we
suggest they follow the ideas of the text:
◼ A philosophy of continuous improvement
4. Great question for class discussion: Control charts can be used
for tracking customer complaints, Pareto diagrams to find where to
86 CHAPTER 6 MAN A G I N G QU A L I T Y
Copyright ©2017 Pearson Education, Inc.
ADDITIONAL CASE STUDY
(AVAILABLE IN MYOMLAB)
WESTOVER ELECTRICAL, INC.
Note: This is a case that can be used as an introduction to TQM
tools or after the tools are introduced as a learning tool demon–
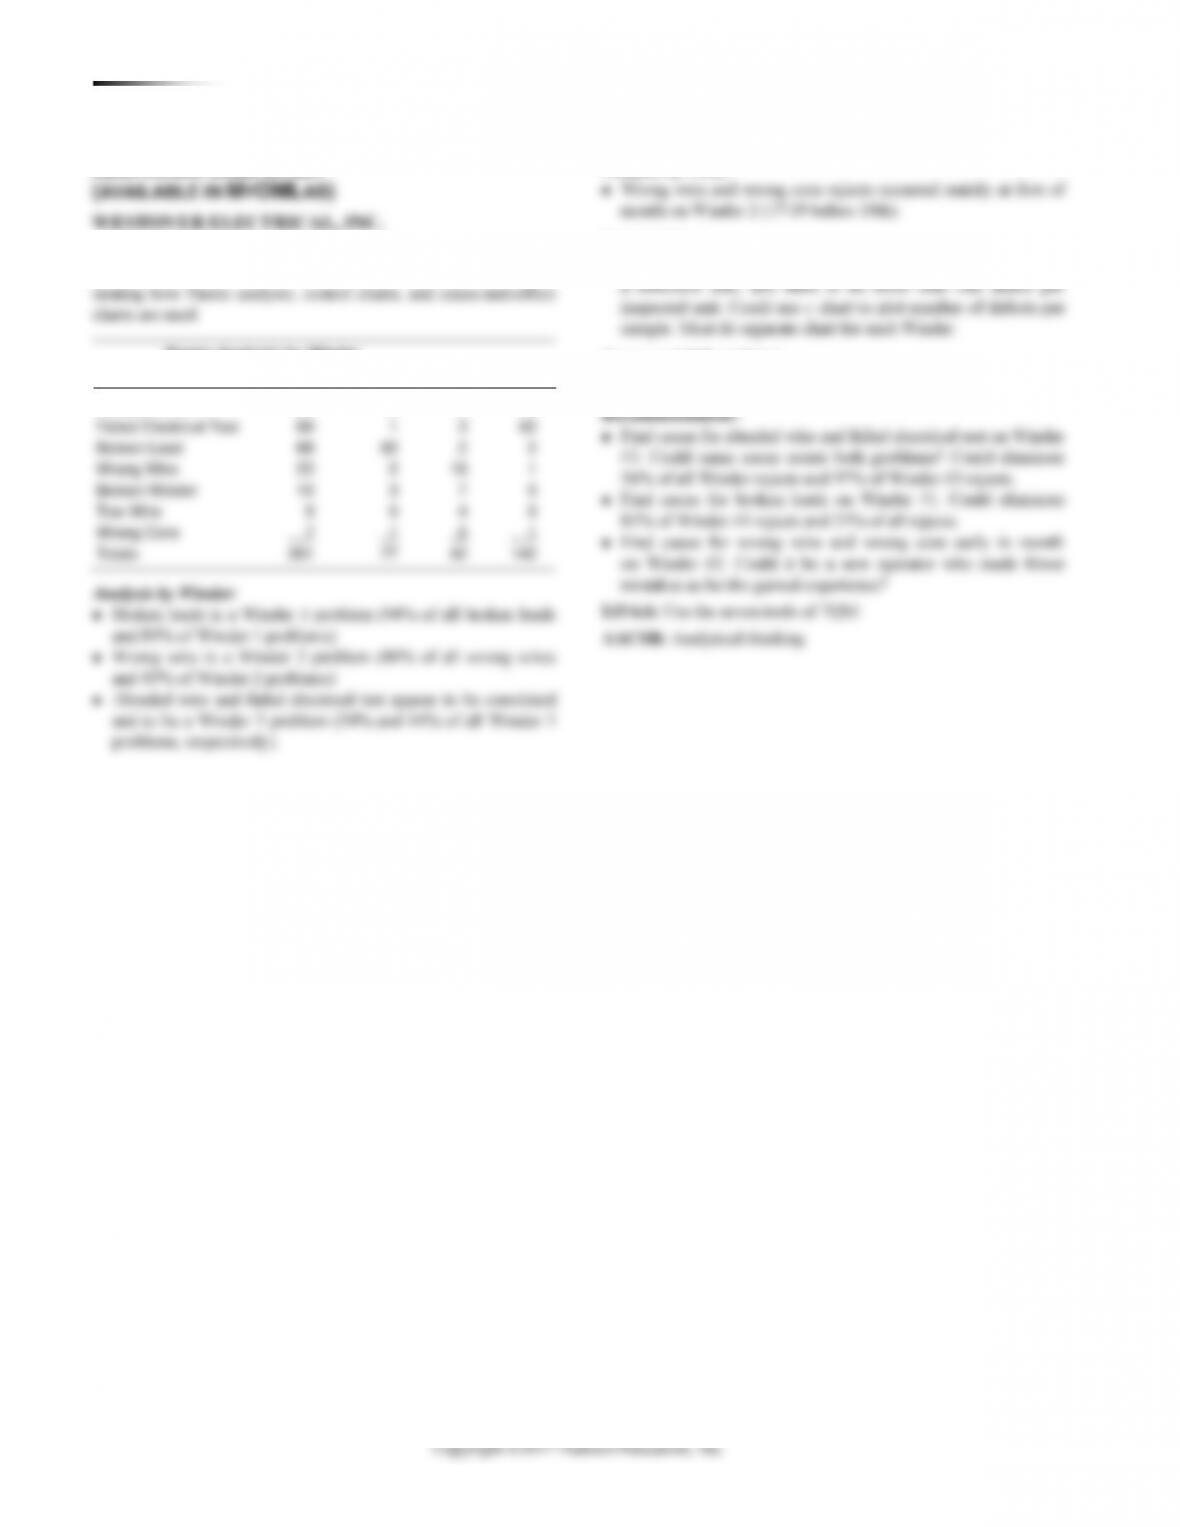
Pareto Analysis by Winder
Defect
Combined
W1
W2
W3
Abraded Wire
81
3
2
76
Failed Electrical Test
66
1
3
62
Broken Lead
66
2
2
Wrong Wire
22
2
1
Broken Winder
10
3
7
0
Tow Wire
9
5
4
0
Wrong Core
7
1
5
1
and to be a Winder 3 problem (54% and 44% of all Winder 3
problems, respectively).
Analysis by Time:
◼ Wrong wire and wrong core rejects occurred mainly at first of
month on Winder 2 (17/19 before 10th).
Control Charts:
◼ Could use p chart if it is assumed that any one defect results in
Cause-and-Effect Chart:
◼ At least mention.