8-28
8-40 (continued)
(part of requirement e.)
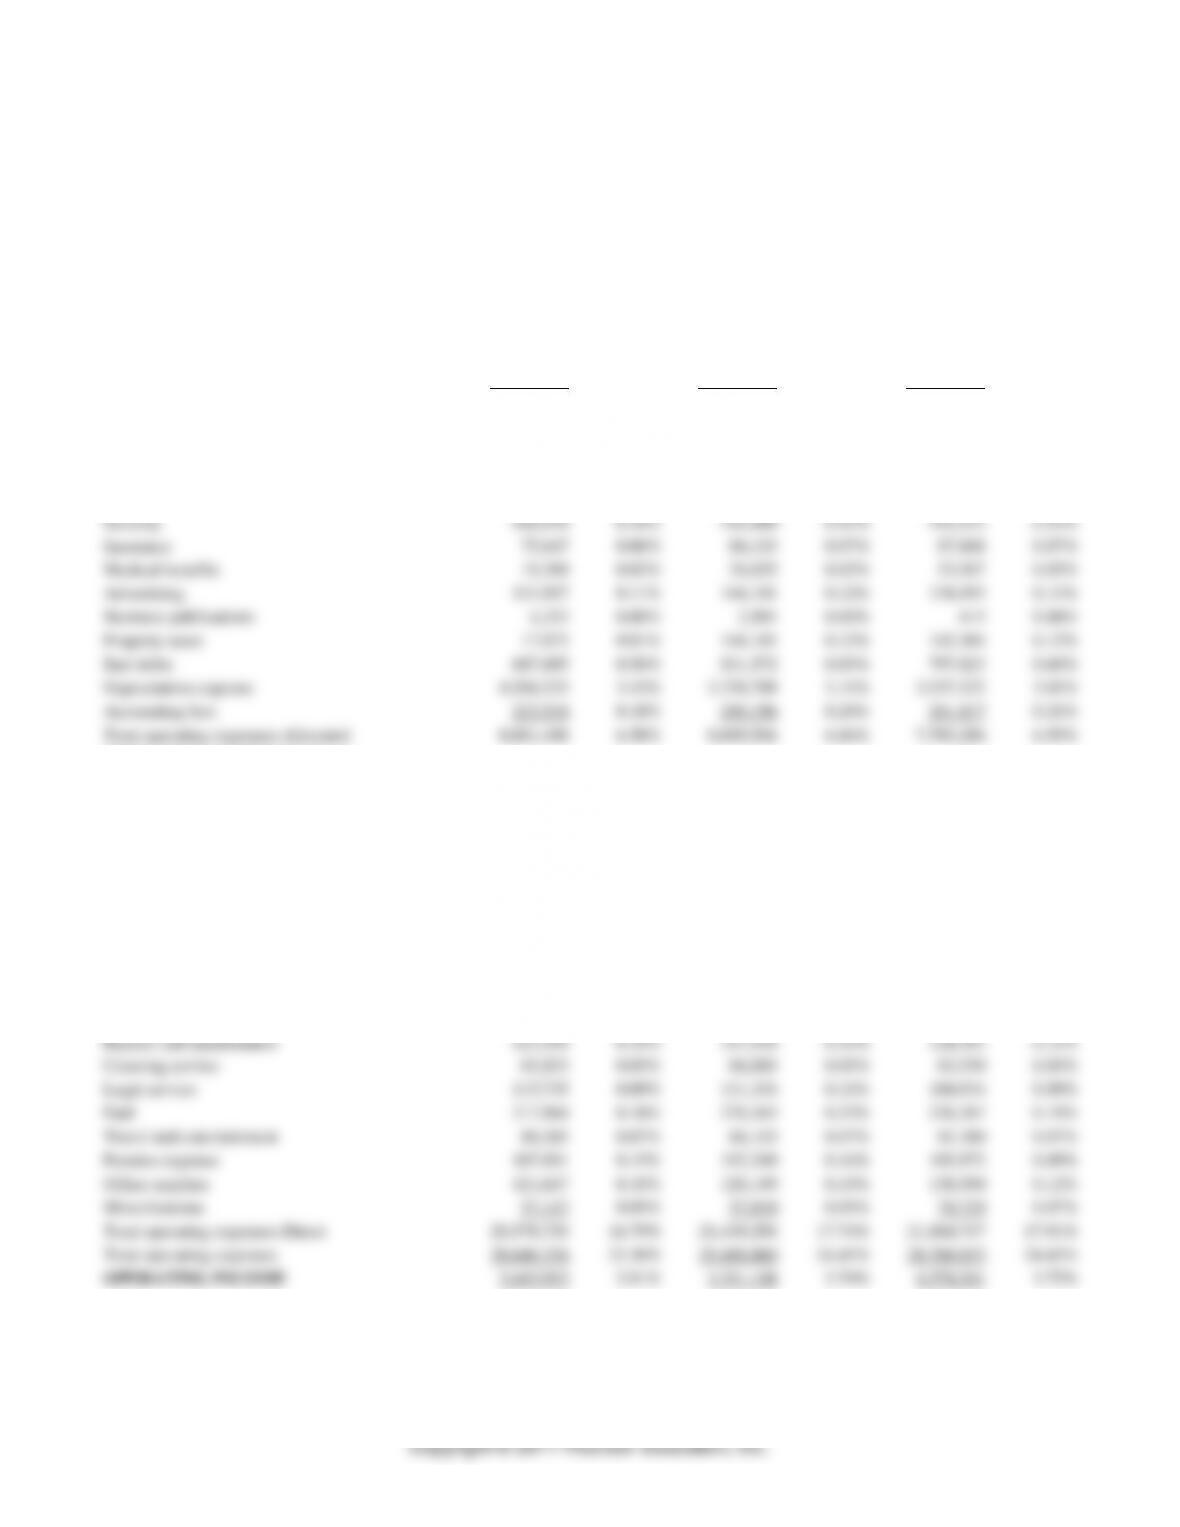
Pinnacle Manufacturing Company
Income Statement – Welburn Division
For the Year Ended December 31
2016
$ Value
2016
% of Div.
Sales
2015
$ Value
2015
% of Div.
Sales
2014
$ Value
2014
% of Div.
Sales
Sales
122,585,513
100.00%
120,830,903
100.00%
117,639,471
100.00%
Sales Returns and Allowances
127,673
0.10%
124,975
0.10%
121,694
0.10%
Cost of Sales*
90,373,709
73.72%
87,905,900
72.75%
84,375,503
71.72%
Gross Profit
32,084,131
26.17%
32,800,028
27.15%
33,142,274
28.17%
OPERATING EXPENSES-Allocated
Salaries-Management
1,851,775
1.51%
1,934,168
1.60%
1,858,914
1.58%
Salaries-Office
255,833
0.21%
240,298
0.20%
248,539
0.21%
Licensing and certification fees
139,951
0.11%
127,659
0.11%
119,829
0.10%
Security
446,938
0.36%
516,406
0.43%
510,552
0.43%
Insurance
75,647
0.06%
84,103
0.07%
87,868
0.07%
Medical benefits
19,389
0.02%
24,032
0.02%
23,507
0.02%
Advertising
131,917
0.11%
144,181
0.12%
134,193
0.11%
Business publications
4,213
0.00%
2,981
0.00%
415
0.00%
Property taxes
17,873
0.01%
144,181
0.12%
142,304
0.12%
Bad debts
687,885
0.56%
831,572
0.69%
797,823
0.68%
Depreciation expense
4,206,533
3.43%
3,759,789
3.11%
3,537,525
3.01%
Accounting fees
223,534
0.18%
240,196
0.20%
241,817
0.21%
Total operating expenses-Allocated
8,061,488
6.58%
8,049,566
6.66%
7,703,286
6.55%
OPERATING EXPENSES-Direct
Salaries-Sales
12,579,213
10.26%
12,694,443
10.51%
12,343,793
10.49%
Wages Rental
–
–
–
Wages-Mechanics
–
–
–
Wages-Warehouse
4,006,809
3.27%
4,325,377
3.58%
4,433,082
3.77%
Garbage collection
–
–
–
Payroll benefits
2,039,389
1.66%
2,379,426
1.97%
2,344,248
1.99%
Rent- Warehouse
670,746
0.55%
623,389
0.52%
618,494
0.53%
Telephone
25,901
0.02%
36,045
0.03%
46,175
0.04%
Utilities
194,700
0.16%
216,266
0.18%
222,226
0.19%
Postage
77,924
0.06%
108,136
0.09%
122,519
0.10%
Linen service
14,126
0.01%
10,510
0.01%
13,685
0.01%
Repairs and maintenance
123,450
0.10%
117,538
0.10%
124,383
0.11%
Cleaning service
65,853
0.05%
66,085
0.05%
63,250
0.05%
Legal service
115,735
0.09%
131,334
0.11%
104,934
0.09%
Fuel
217,964
0.18%
276,343
0.23%
226,387
0.19%
Travel and entertainment
80,265
0.07%
84,103
0.07%
81,380
0.07%
Pension expense
187,891
0.15%
192,240
0.16%
102,872
0.09%
Office supplies
121,617
0.10%
120,149
0.10%
138,590
0.12%
Miscellaneous
57,147
0.05%
57,910
0.05%
78,729
0.07%
Total operating expenses-Direct
20,578,730
16.79%
21,439,294
17.74%
21,064,747
17.91%
Total operating expenses
28,640,218
23.36%
29,488,860
24.41%
28,768,033
24.45%
OPERATING INCOME
3,443,913
2.81%
3,311,168
2.74%
4,374,241
3.72%
* Details of manufacturing expenses are not
included in this schedule.
8-29
8-40 (continued)
(part of requirement e.)
Pinnacle Manufacturing Company
Income Statement – Solar-Electro Division
For the Year Ended December 31
2016
$ Value
2016
% of Div.
Sales
2015
$ Value
2015
% of Div.
Sales
2014
$ Value
2014
% of Div.
Sales
Sales
22,605,731
100.00%
21,680,289
100.00%
21,126,896
100.00%
Sales Returns and Allowances
43,825
0.19%
38,773
0.18%
37,756
0.18%
Cost of Sales*
17,008,377
75.24%
16,156,496
74.52%
15,507,635
73.40%
Gross Profit
5,553,529
24.57%
5,485,020
25.30%
5,581,505
26.42%
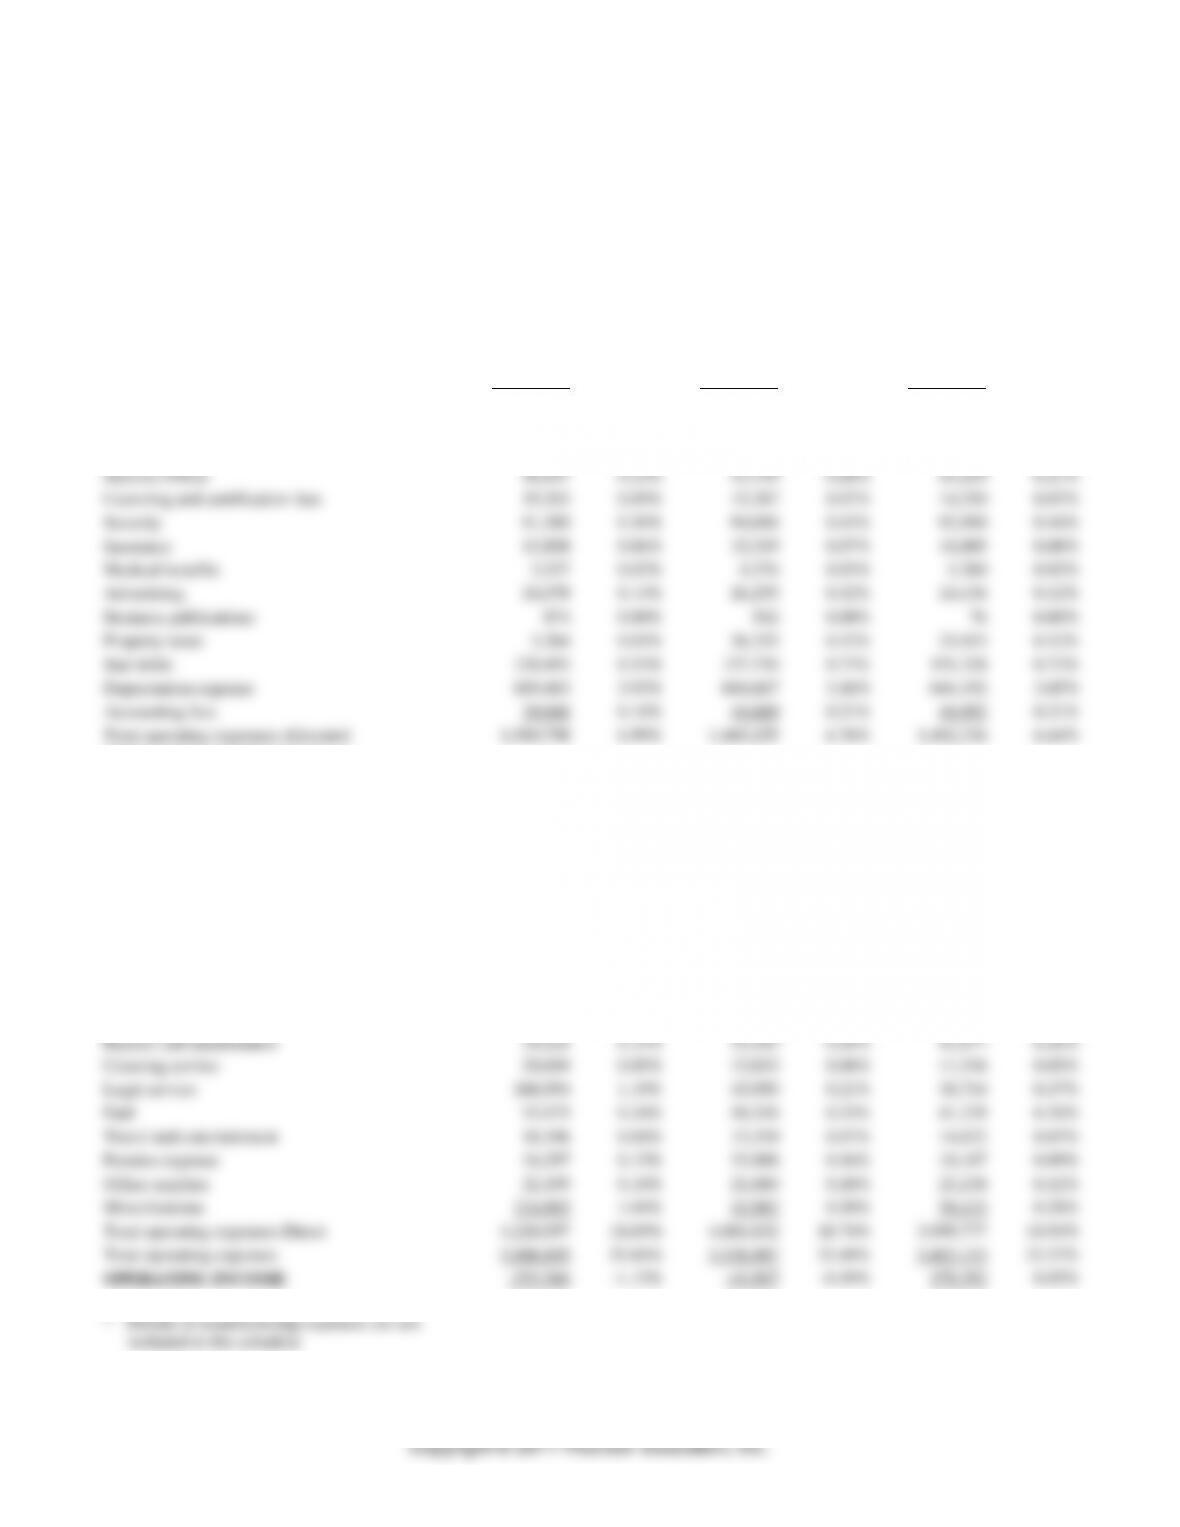
OPERATING EXPENSES-Allocated
Salaries-Management
338,015
1.50%
352,230
1.62%
338,525
1.60%
Salaries-Office
46,697
0.21%
43,759
0.20%
45,259
0.21%
Licensing and certification fees
19,303
0.09%
15,287
0.07%
14,350
0.07%
Security
81,580
0.36%
94,046
0.43%
92,980
0.44%
Insurance
13,808
0.06%
15,319
0.07%
16,005
0.08%
Medical benefits
3,537
0.02%
4,376
0.02%
4,280
0.02%
Advertising
24,078
0.11%
26,255
0.12%
24,436
0.12%
Business publications
874
0.00%
542
0.00%
76
0.00%
Property taxes
3,264
0.01%
26,255
0.12%
25,913
0.12%
Bad debts
120,493
0.53%
157,730
0.73%
151,328
0.72%
Depreciation expense
889,483
3.93%
684,667
3.16%
644,192
3.05%
Accounting fees
39,666
0.18%
44,689
0.21%
44,992
0.21%
Total operating expenses-Allocated
1,580,798
6.99%
1,465,155
6.76%
1,402,336
6.64%
OPERATING EXPENSES-Direct
Salaries-Sales
2,192,482
9.70%
2,402,414
11.08%
2,336,053
11.06%
Wages Rental
–
–
–
Wages-Mechanics
–
–
–
Wages-Warehouse
695,918
3.08%
787,698
3.63%
807,312
3.82%
Garbage collection
–
–
–
Payroll benefits
478,669
2.12%
433,321
2.00%
426,916
2.02%
Rent- Warehouse
103,983
0.46%
109,403
0.50%
108,544
0.51%
Telephone
4,730
0.02%
6,567
0.03%
8,412
0.04%
Utilities
53,278
0.24%
39,383
0.18%
40,468
0.19%
Postage
7,131
0.03%
19,695
0.09%
22,315
0.11%
Linen service
2,578
0.01%
1,490
0.01%
1,941
0.01%
Repairs and maintenance
34,121
0.15%
39,383
0.18%
41,677
0.20%
Cleaning service
20,694
0.09%
12,033
0.06%
11,516
0.05%
Legal service
268,954
1.19%
45,950
0.21%
36,714
0.17%
Fuel
53,975
0.24%
50,326
0.23%
41,229
0.20%
Travel and entertainment
18,196
0.08%
15,319
0.07%
14,822
0.07%
Pension expense
34,297
0.15%
33,988
0.16%
18,187
0.09%
Office supplies
22,199
0.10%
21,880
0.10%
25,238
0.12%
Miscellaneous
234,892
1.04%
42,982
0.20%
58,433
0.28%
Total operating expenses-Direct
4,226,097
18.69%
4,061,832
18.74%
3,999,777
18.93%
Total operating expenses
5,806,895
25.69%
5,526,987
25.49%
5,402,113
25.57%
OPERATING INCOME
-253,366
-1.12%
-41,967
-0.19%
179,392
0.85%
* Details of manufacturing expenses are not
included in this schedule.
8-30
8-40 (continued)
(part of requirement e.)
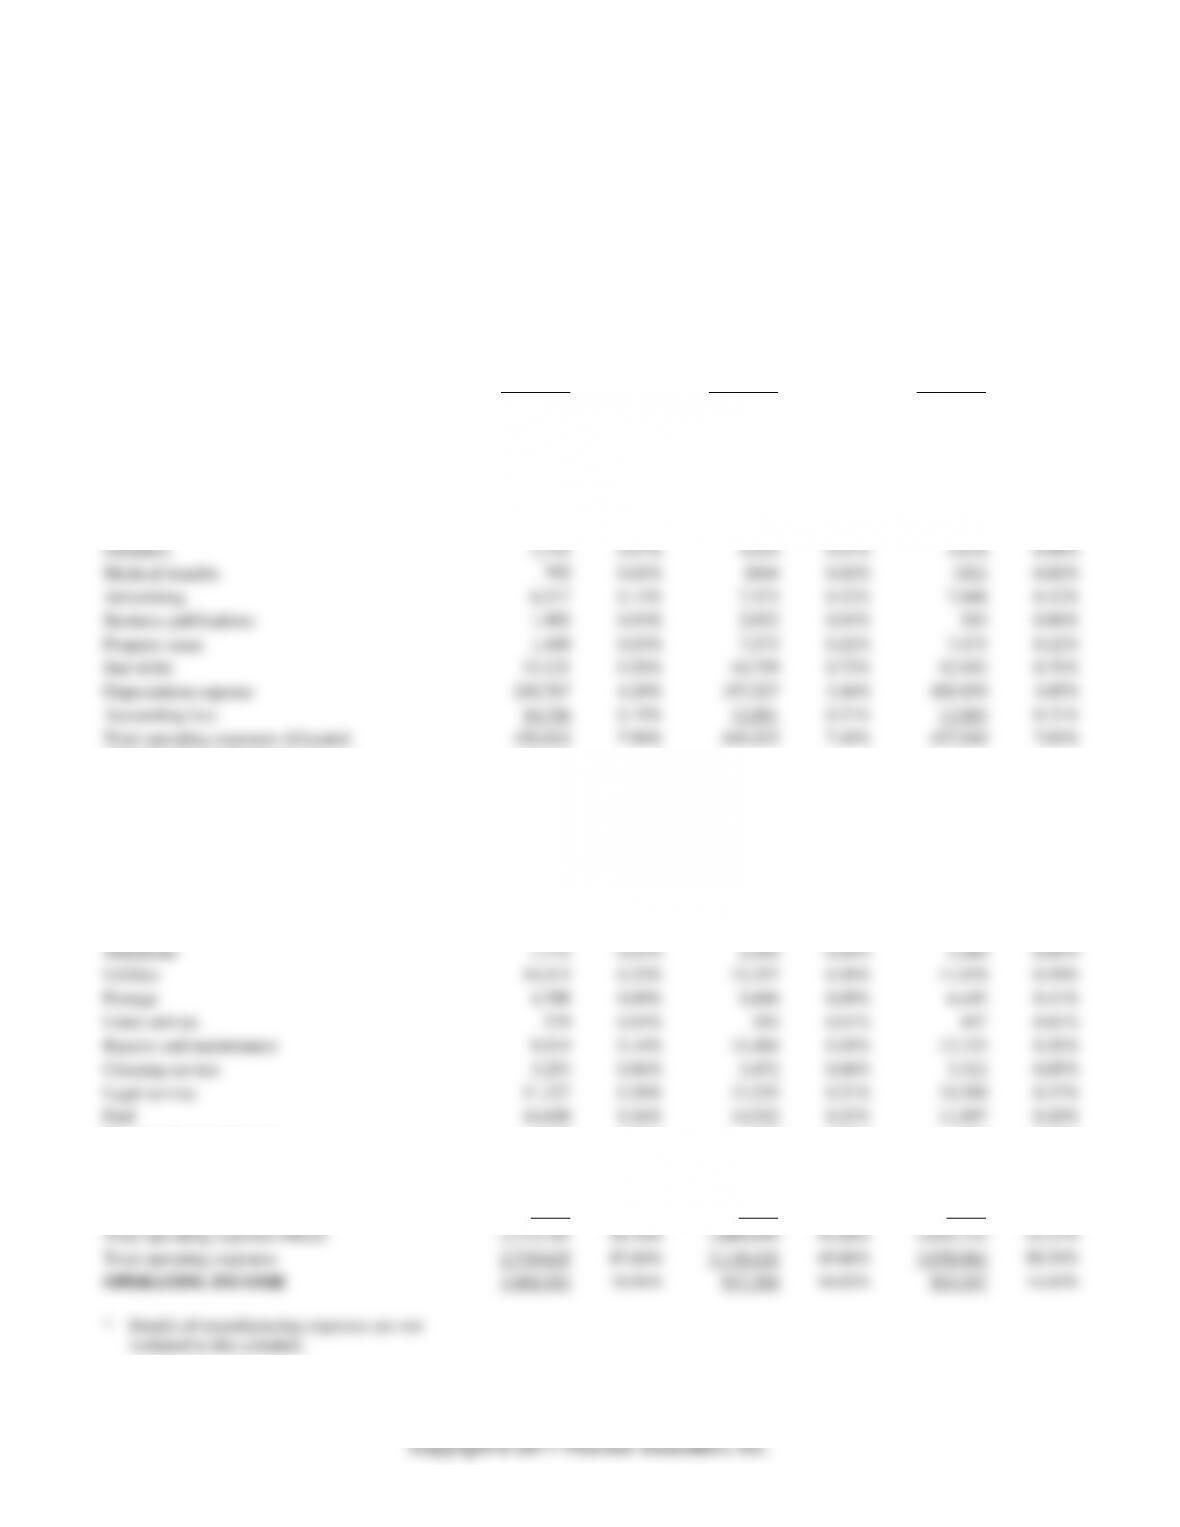
Pinnacle Manufacturing Company
Income Statement – Machine-Tech Division
For the Year Ended December 31
2016
$ Value
2016
% of Div.
Sales
2015
$ Value
2015
% of Div.
Sales
2014
$ Value
2014
% of Div.
Sales
Sales
5,727,487
100.00%
6,253,363
100.00%
6,093,878
100.00%
Sales Returns and Allowances
9,605
0.17%
14,770
0.24%
14,382
0.24%
Cost of Sales*
1,902,694
33.22%
2,193,103
35.07%
2,105,027
34.54%
Gross Profit
3,815,188
66.61%
4,045,490
64.69%
3,974,469
65.22%
OPERATING EXPENSES-Allocated
Salaries-Management
91,476
1.60%
101,595
1.62%
97,642
1.60%
Salaries-Office
12,638
0.22%
12,624
0.20%
13,057
0.21%
Licensing and certification fees
31,396
0.55%
29,937
0.48%
28,100
0.46%
Security
22,086
0.39%
27,128
0.43%
26,820
0.44%
Insurance
3,742
0.07%
4,420
0.07%
4,618
0.08%
Medical benefits
795
0.01%
1044
0.02%
1022
0.02%
Advertising
6,517
0.11%
7,573
0.12%
7,048
0.12%
Business publications
1,902
0.03%
2,032
0.03%
283
0.00%
Property taxes
1,448
0.03%
7,573
0.12%
7,475
0.12%
Bad debts
33,321
0.58%
44,759
0.72%
42,942
0.70%
Depreciation expense
240,767
4.20%
197,527
3.16%
185,850
3.05%
Accounting fees
10,756
0.19%
12,891
0.21%
12,983
0.21%
Total operating expenses-Allocated
456,844
7.98%
449,103
7.18%
427,840
7.02%
OPERATING EXPENSES-Direct
198978
Salaries-Sales
198,978
3.47%
230,922
3.69%
224,543
3.68%
Wages Rental
491,794
8.59%
595,389
9.52%
575,724
9.45%
Wages-Mechanics
1,113,539
19.44%
1,339,627
21.42%
1,333,411
21.88%
Wages-Warehouse
188,339
3.29%
227,196
3.63%
232,853
3.82%
Garbage collection
27,649
0.48%
29,771
0.48%
37,970
0.62%
Payroll benefits
139,832
2.44%
124,984
2.00%
123,136
2.02%
Rent- Warehouse
28,126
0.49%
31,554
0.50%
31,306
0.51%
Telephone
1,771
0.03%
2,560
0.04%
3,280
0.05%
Utilities
14,415
0.25%
11,357
0.18%
11,670
0.19%
Postage
4,708
0.08%
5,688
0.09%
6,445
0.11%
Linen service
579
0.01%
350
0.01%
457
0.01%
Repairs and maintenance
9,414
0.16%
11,484
0.18%
12,153
0.20%
Cleaning service
3,253
0.06%
3,472
0.06%
3,322
0.05%
Legal service
11,327
0.20%
13,255
0.21%
10,590
0.17%
Fuel
14,608
0.26%
14,522
0.23%
11,897
0.20%
Travel and entertainment
4,928
0.09%
4,420
0.07%
4,277
0.07%
Pension expense
6,368
0.11%
11,121
0.18%
5,951
0.10%
Office supplies
6,012
0.10%
6,312
0.10%
7,281
0.12%
Miscellaneous
8,141
0.14%
5,035
0.08%
6,856
0.11%
Total operating expenses-Direct
2,273,781
39.70%
2,669,019
42.68%
2,643,122
43.37%
Total operating expenses
2,730,625
47.68%
3,118,122
49.86%
3,070,962
50.39%
OPERATING INCOME
1,084,563
18.94%
927,368
14.83%
903,507
14.83%
* Details of manufacturing expenses are not
included in this schedule.
8-31
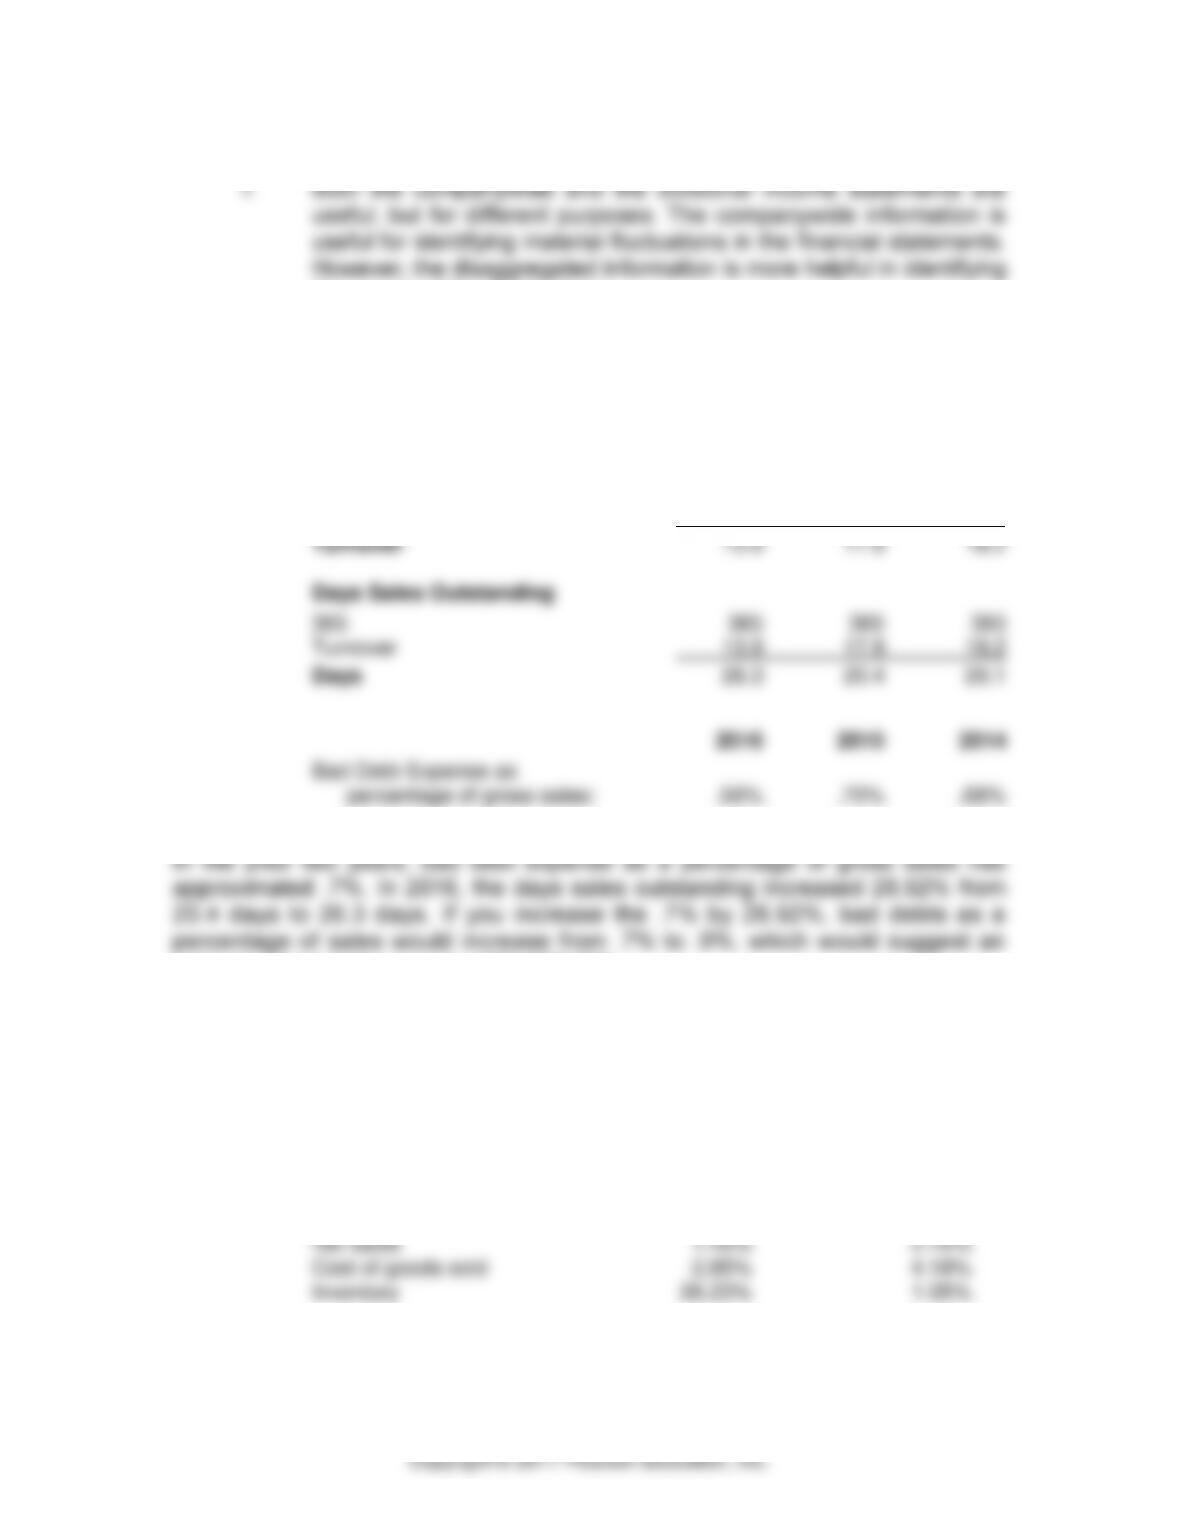
8–40 (continued)
the source of the fluctuations.
g. Estimate of Potential
Understatement in Allowance
2016 2015 2014
A/R Turnover
Sales 150,738 148,586 144,686
Average accounts receivable 10,831 8,278 7,936
estimated bad debt expense of $1,358,269.
The difference between recorded bad debt expense of $841,699 and the expected
bad debt expense of $1,358,269 would require an increase of $516,570 to bad
debt expense and the allowance for doubtful accounts.
Analysis of Inventory Balance
% Change % Change
Account Balance 2015-2016 2014-2015
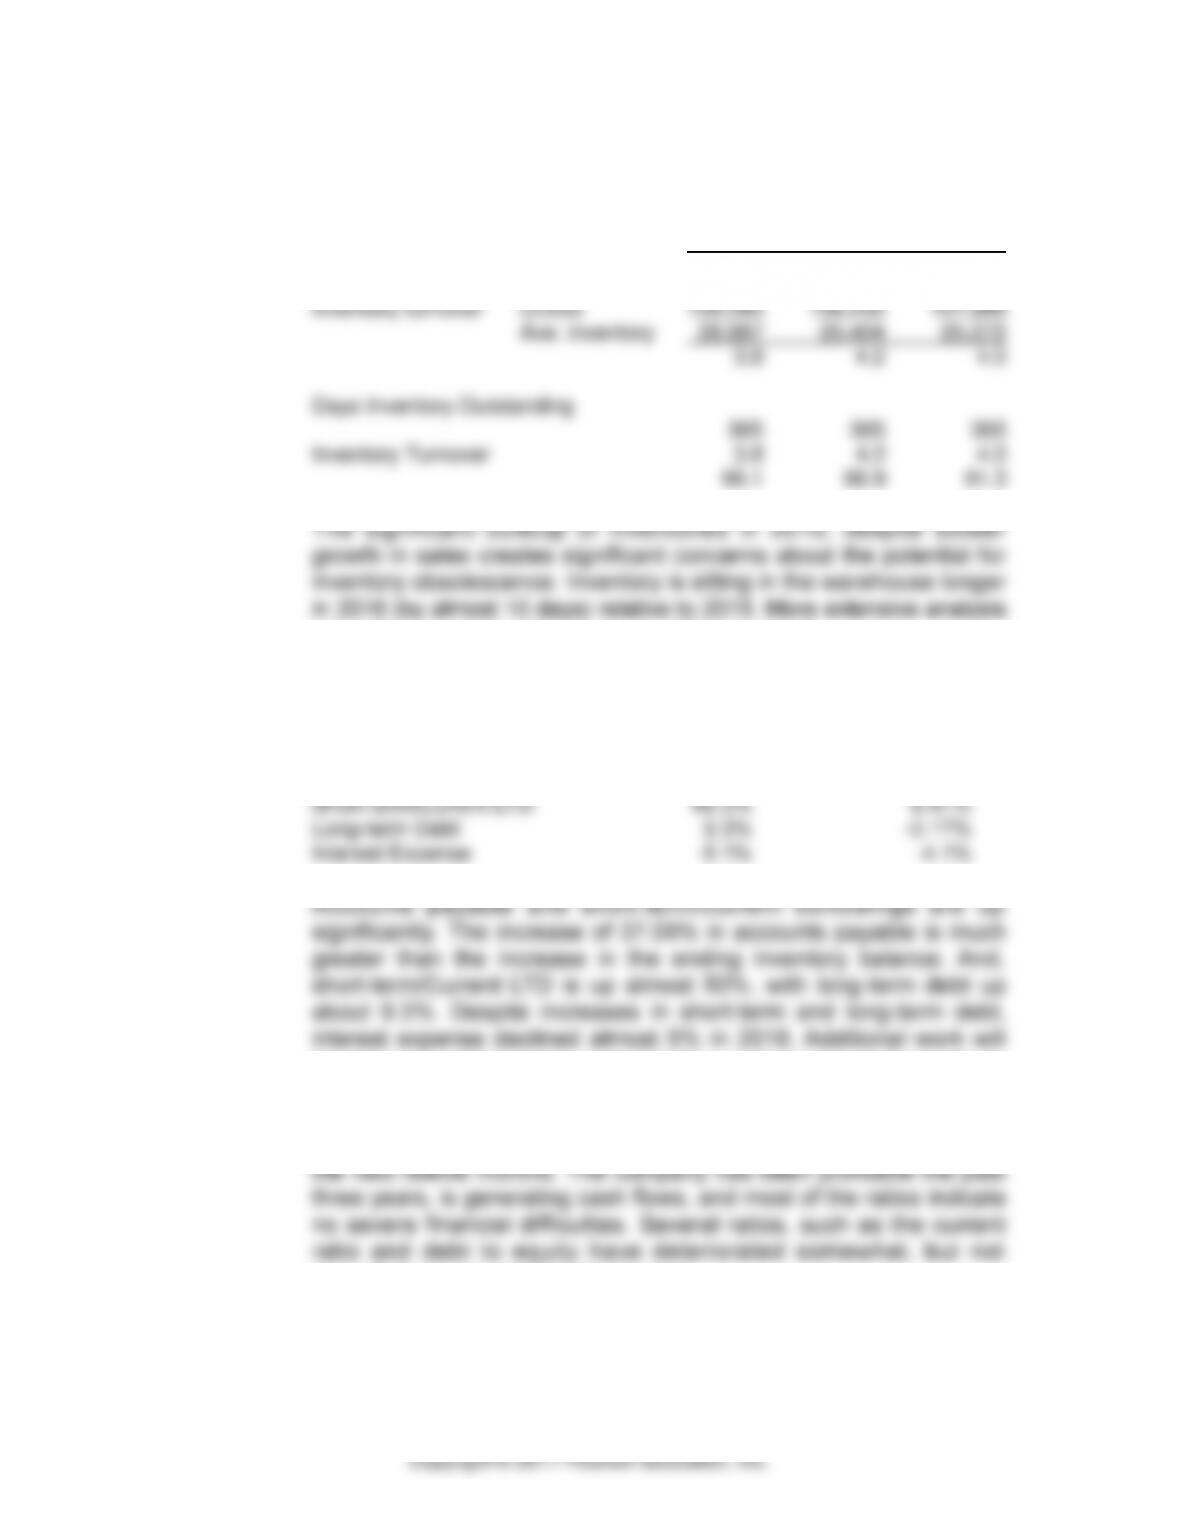
8-32
8-40 (continued)
Ratios 2016 2015 2014
Gross margin % Gross profit 41,453 42,331 42,698
Sales 150,738 148,586 144,686
27.5% 28.5% 29.5%
regarding inventory obsolescence will be needed.
Analysis of Short–Term and Long–Term Debt
% Change % Change
Account Balance 2015–2016 2014–2015
Accounts payable 37.09% 24.71%
be done to address the potential for material misstatements in
these accounts.
h. There is a low to moderate risk that Pinnacle will fail financially in
enough to cause significant concerns.
8-33
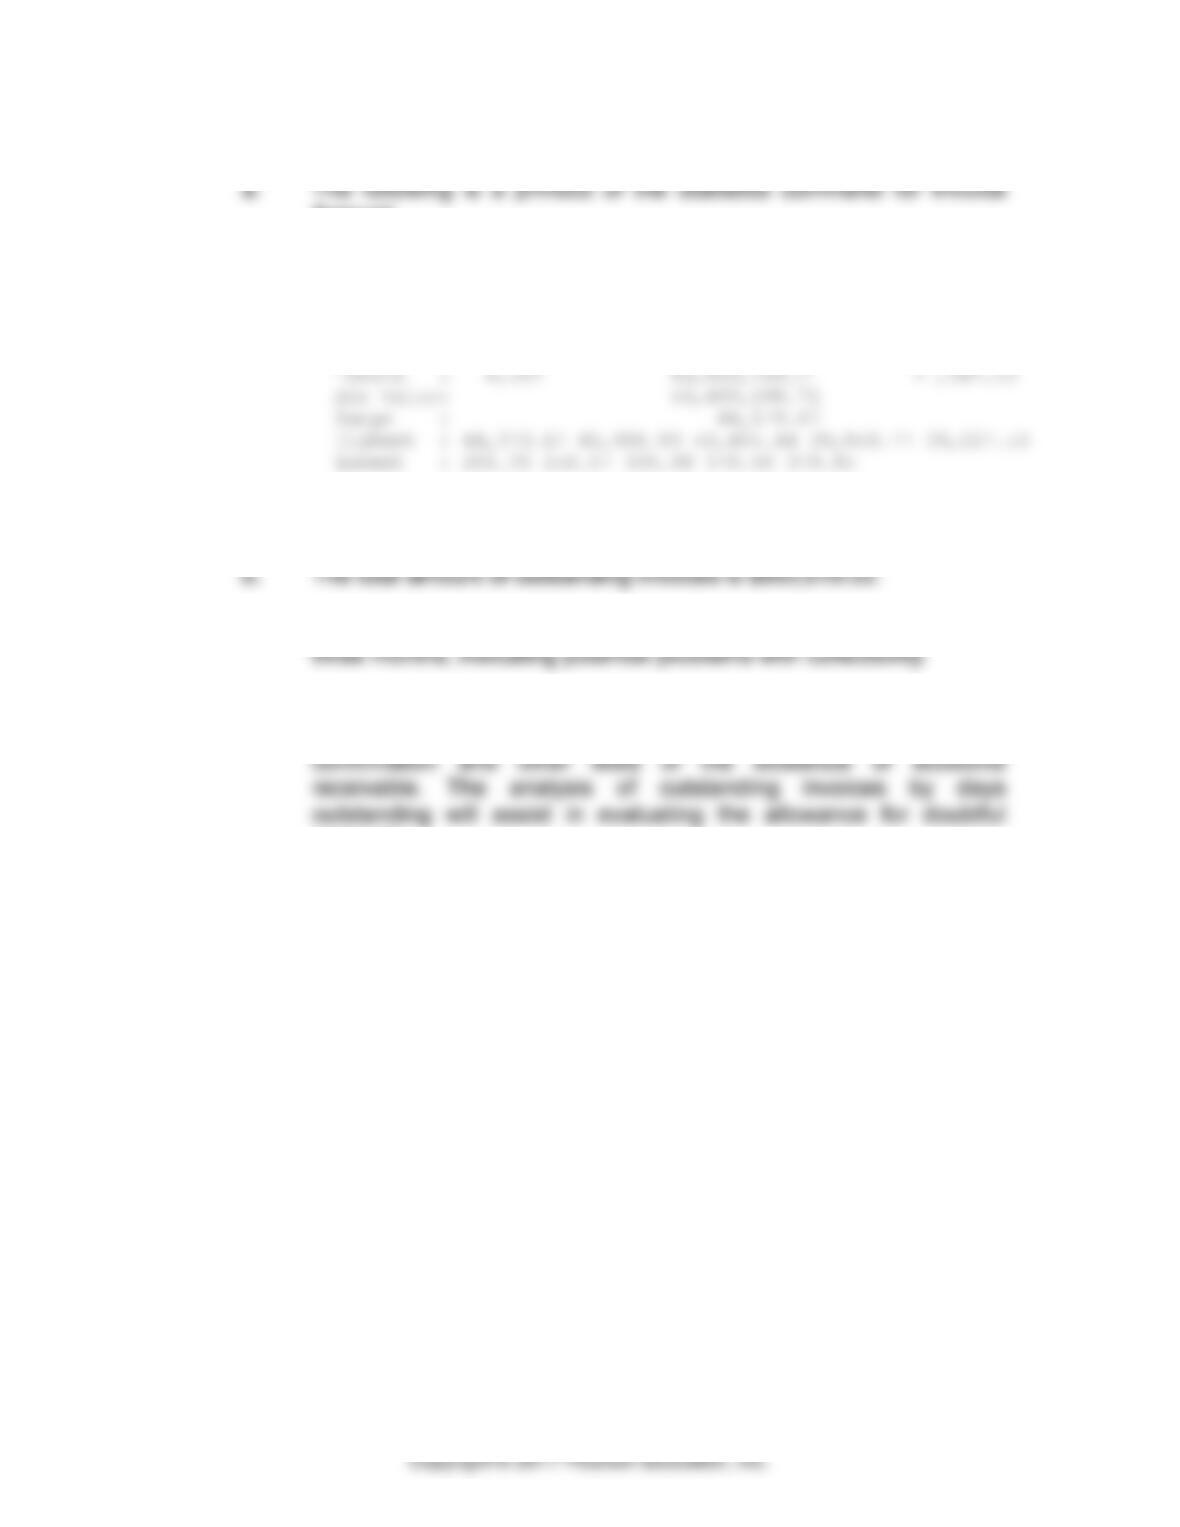
8–41 ACL Problem
Amount:
Field : invoice_amount
Number Total Average
Positive : 4,082 46,400,198.71 11,367.03
Zeros : 0
Negative : 0 0.00 0.00
There are no negative amounts.
c. A number of the invoices have been outstanding for more than
d. The statistical information will be useful in identifying the range of
invoice values, including outstanding invoices, to identify
accounts.