17–11
17–25 (continued)
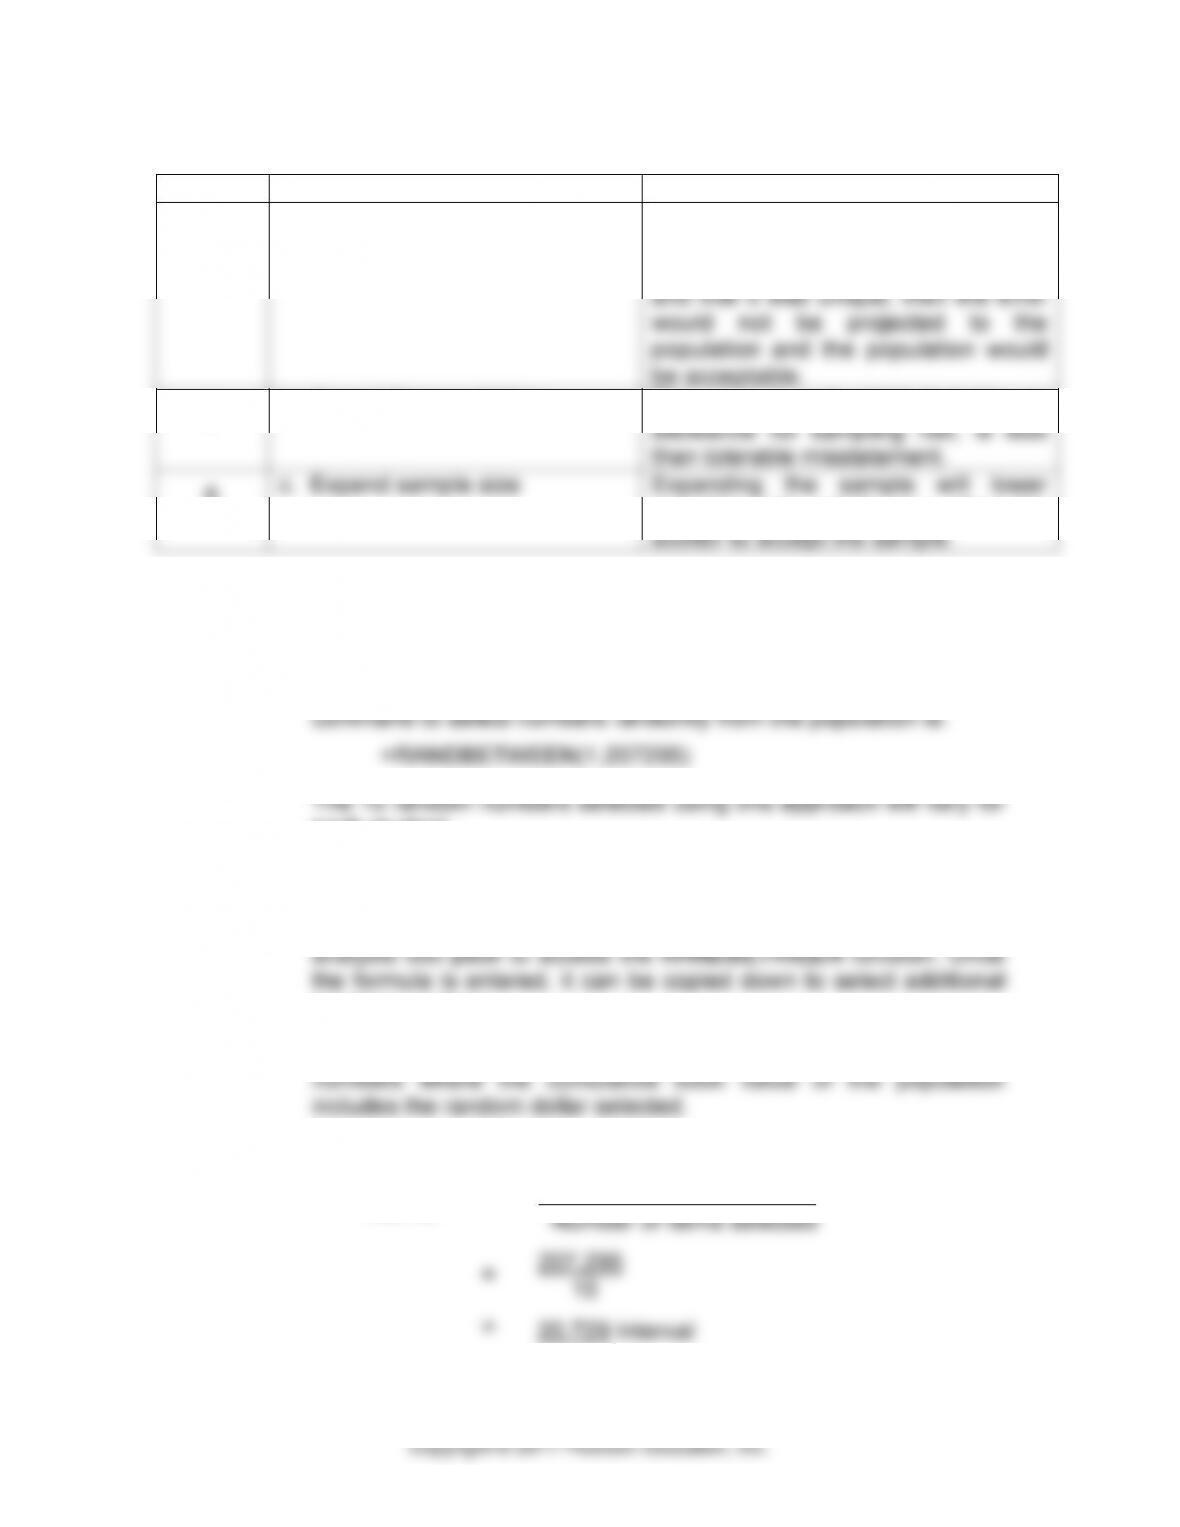
Sample
Response
Comment
4
e. Treat the error as an anomaly
that is not projected.
The single error related to a currency
adjustment. If the auditor performs
tests to verify the cause of the error
and that it was unique, then the error
would not be projected to the
population and the population would
be acceptable.
5
a. Accept the population
The upper bound, which includes an
allowance for sampling risk, is less
than tolerable misstatement.
6
c. Expand sample size
Expanding the sample will lower
sampling risk, which may allow the
auditor to accept the sample.
17–26 (see text Web site for Excel solution for part a. and b.- Filename
P1726.xls)
a. If random selection is performed using Excel (P1726.xls), the
each student.
The command for selecting the random numbers can be entered
directly onto the spreadsheet, or can be selected from the function
menu (math & trig) functions. It may be necessary to add the
random numbers.
NOTE: Random dollar items are matched with population item
b.
Interval
=
Population total
Number of items selected
=
207,295
10
=
20,729 Interval
17–12
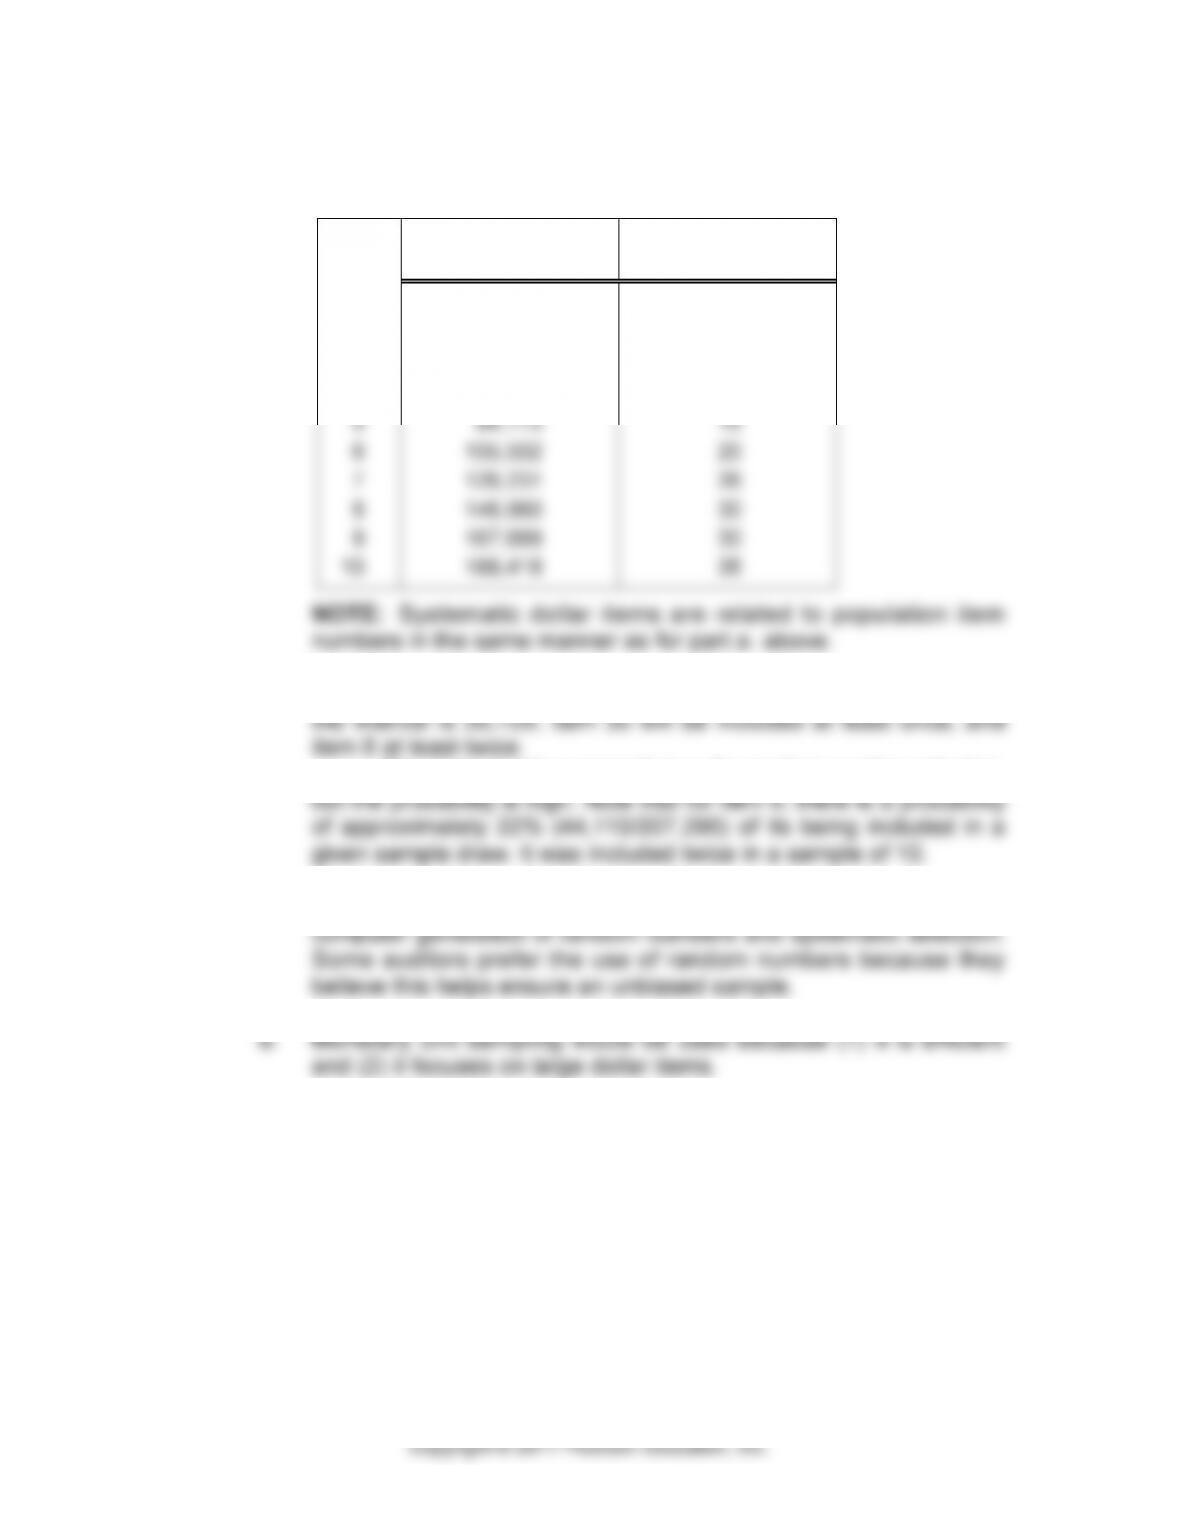
17–26 (continued)
Using 1857 as a starting point, we have:
SYSTEMATIC
DOLLAR
POPULATION
ITEM NO.
1
2
3
4
5
6
7
8
9
10
1,857
22,586
43,315
64,044
84,773
105,502
126,231
146,960
167,689
188,418
2
6
8
8
15
20
26
30
30
35
NOTE: Systematic dollar items are related to population item
numbers in the same manner as for part a. above.
c. All items larger than the interval will be automatically included. If
The same is not necessarily true for random number selection,
d. There is no significant difference in ease of selection between
17–13
Copyright © 2017 Pearson Education, Inc.
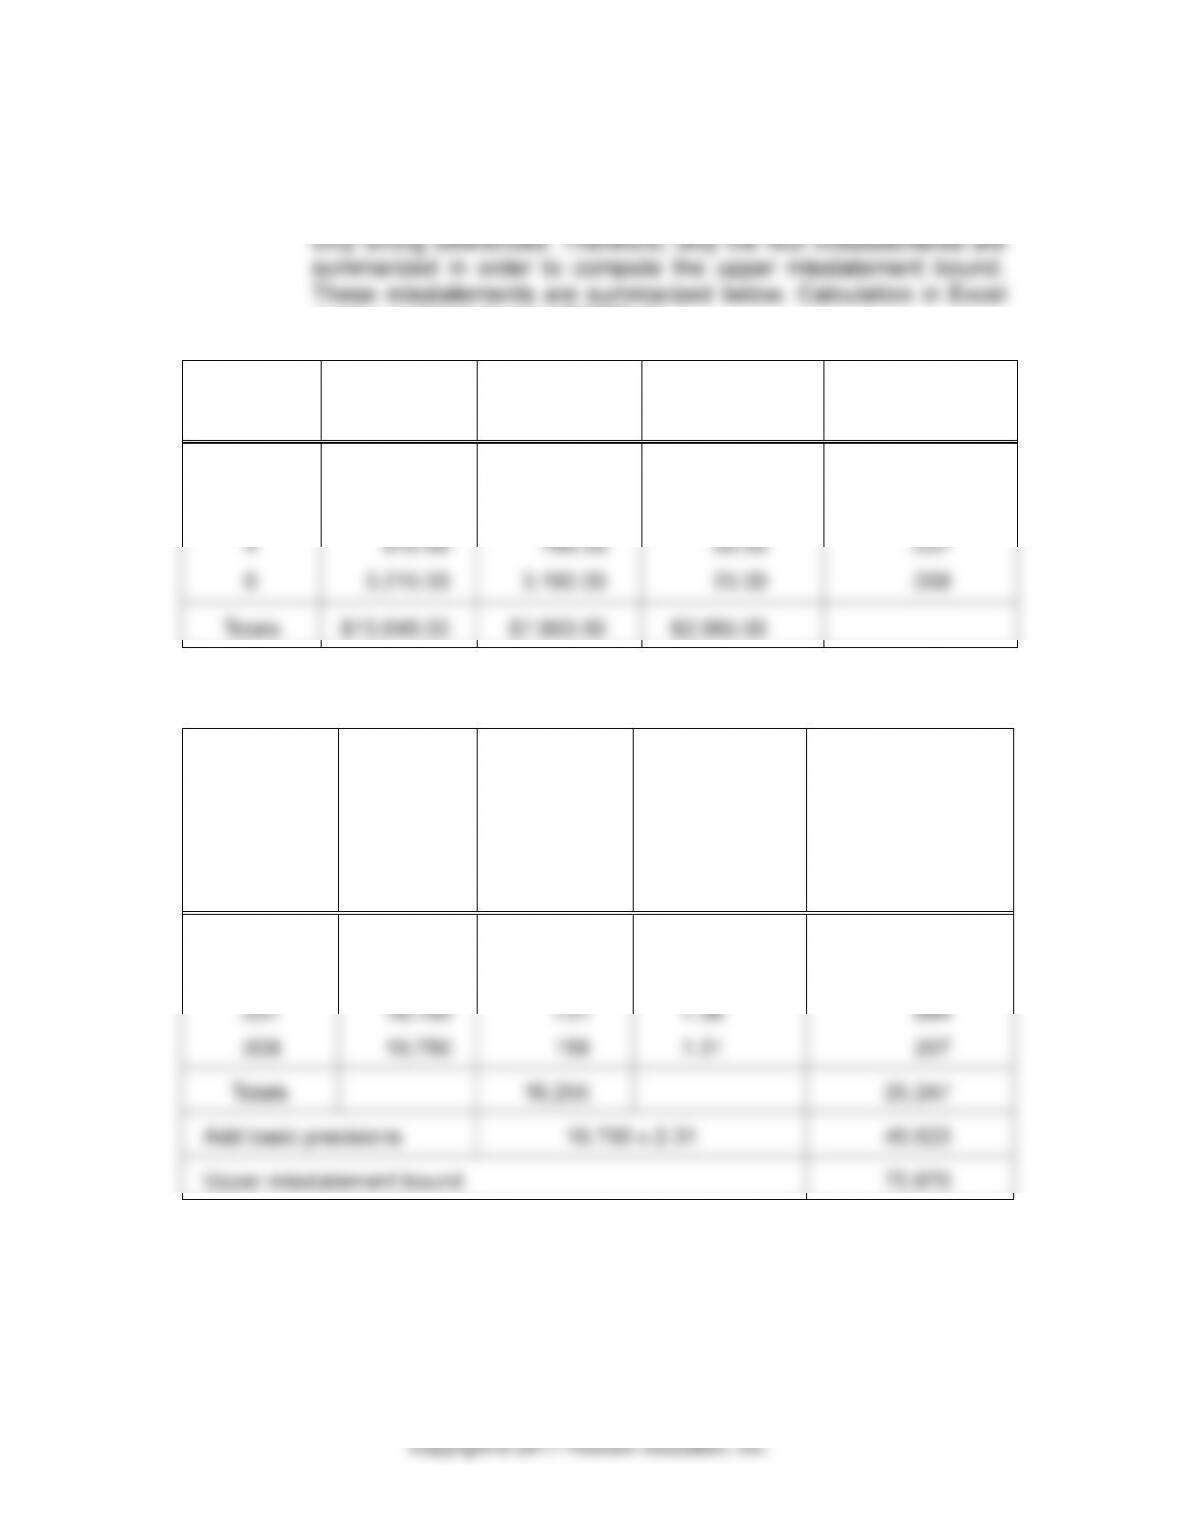
17–27 (see text Web site for Excel solution for part a. – Filename P1727.xls)
a. The differences that were uncovered include only four misstatements
rather than seven. Items 2, 5, and 7 are not misstatements, but
can be performed using P1727.xls.
ITEM
RECORDED
VALUE
AUDITED
VALUE
FACTUAL
MISSTATEMENT
MISSTATEMENT/
RECORDED
VALUE
1
3
4
6
$2,728.00
3,890.00
815.00
3,215.00
$2,498.00
1,190.00
785.00
3,190.00
$ 230.00
2,700.00
30.00
25.00
.084
.694
.037
.008
Totals
$10,648.00
$7,663.00
$2,985.00
The calculation of the misstatement bound is given below:
(a)
TAINTING
(b)
SAMPLING
INTERVAL
( c = a x b)
PROJECTED
MISSTATE–
MENT
(d)
INCREMENTAL
CHANGE IN
CONFIDENCE
FACTOR
(e = c x d)
PROJECTED
MISSTATEMENT
PLUS
INCREMENTAL
ALLOWANCE FOR
SAMPLING RISK
.694
.084
.037
.008
19,750
19,750
19,750
19,750
13,707
1,659
731
158
1.58
1.44
1.36
1.31
21,657
2,389
994
207
Totals
16,255
25,247
Add basic precisions
19,750 x 2.31
45,623
Upper misstatement bound
70,870
17–14
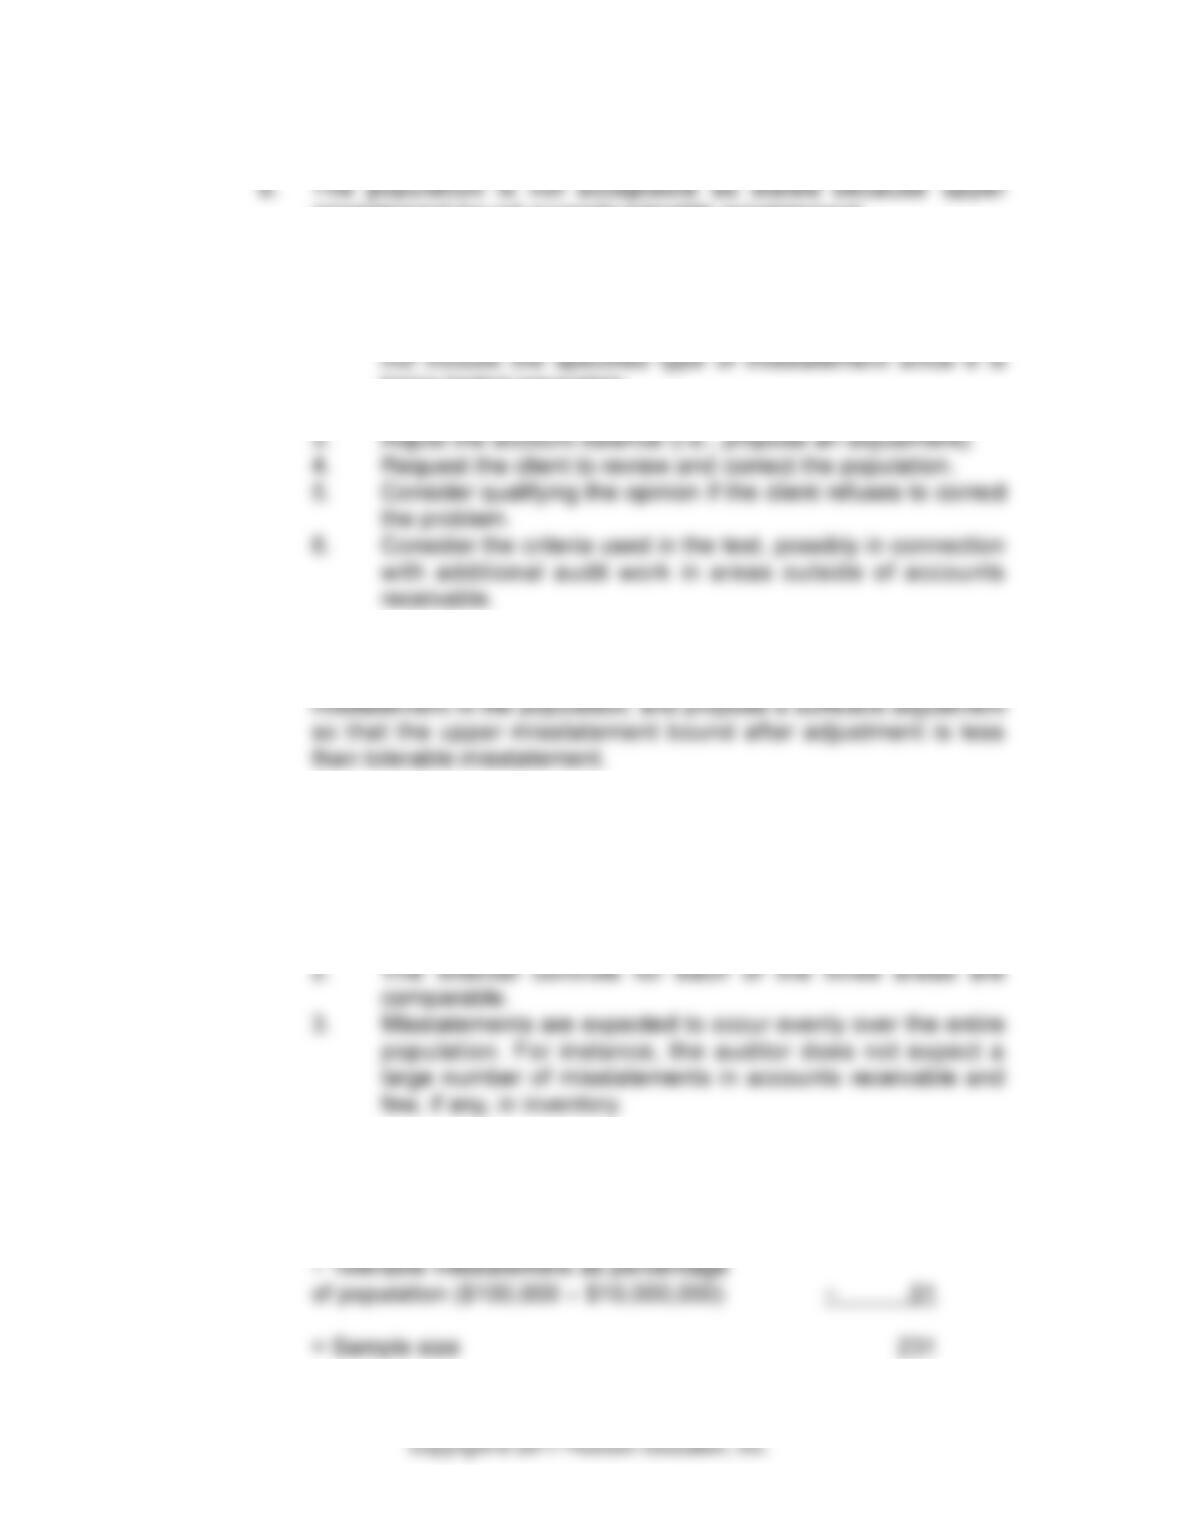
17–27 (continued)
misstatement bound exceeds tolerable misstatement.
In this situation, the auditor has the following options:
1. Segregate a specific type of misstatement and test it
separately (for the entire population). The sample would then
being tested separately.
2. Increase the sample size.
Of these options, the auditor is likely to increase the sample
size to obtain a better estimate of the likely amount of projected
17–28 a. The audit approach of testing all three account balances is acceptable.
This approach is also desirable when the following conditions are
present:
1. The auditor can obtain valid, reliable information to perform
the required tests in all of the areas.
b. The required sample size for all three accounts is:
Confidence factor (10% ARIA , no expected
misstatements 2.31
17–15
17–28 (continued)
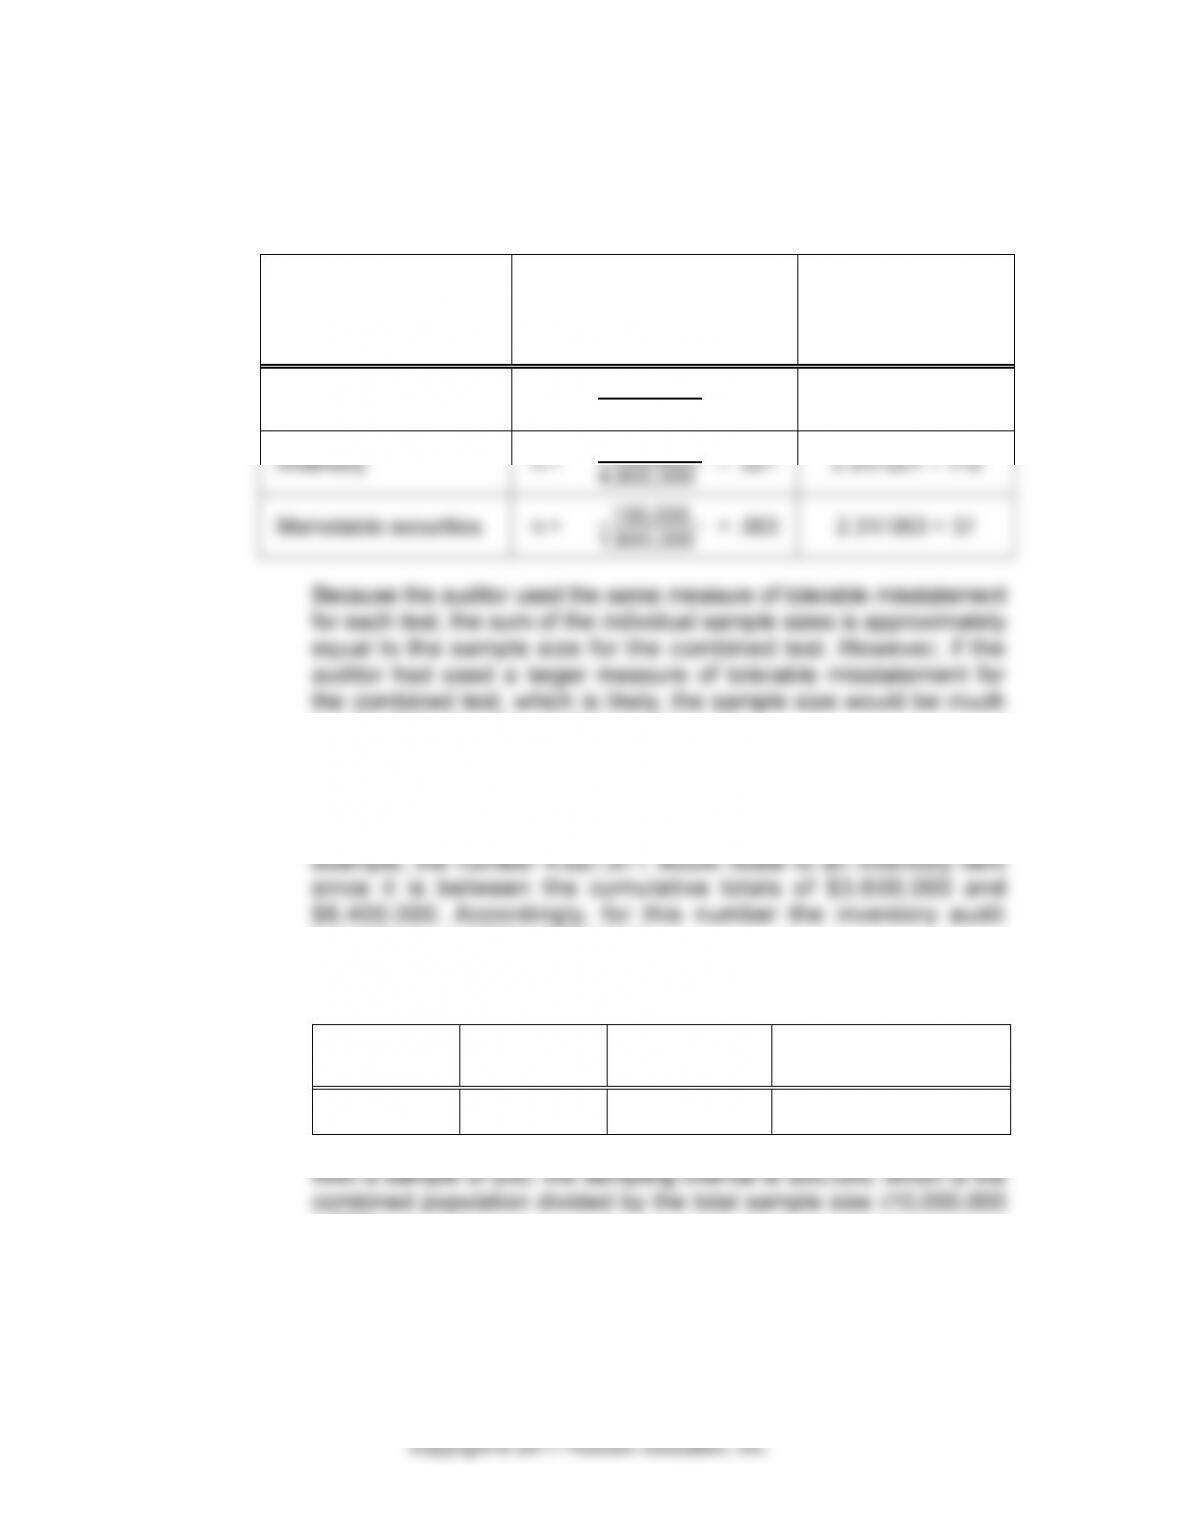
c. The required sample sizes if each account is tested separately
are:
ACCOUNT
TOLERABLE
MISSTATEMENT AS
PERCENTAGE OF
POPULATION
APPROX.
SAMPLE SIZE
Accounts receivable
n =
100,000
3,600,000
= .028
2.31/.028 = 83
Inventory
n =
100,000
4,800,000
= .021
2.31/.021 = 110
Marketable securities
n =
100,000
1,600,000
= .063
2.31/.063 = 37
Because the auditor used the same measure of tolerable misstatement
for each test, the sum of the individual sample sizes is approximately
equal to the sample size for the combined test. However, if the
auditor had used a larger measure of tolerable misstatement for
the combined test, which is likely, the sample size would be much
smaller following the combined approach.
d. The population would be arranged so that all accounts receivable
would be first, followed by inventory and marketable securities.
The items would be identified by the cumulative totals. In the
procedures would be performed.
e. The misstatement data are as follows:
RECORDED
AMOUNT
AUDITED
AMOUNT
DIFFERENCE
MISSTATEMENT/
RECORDED AMOUNT
$987.12
$887.12
$100.00
10.1%
÷ 200):
17–16
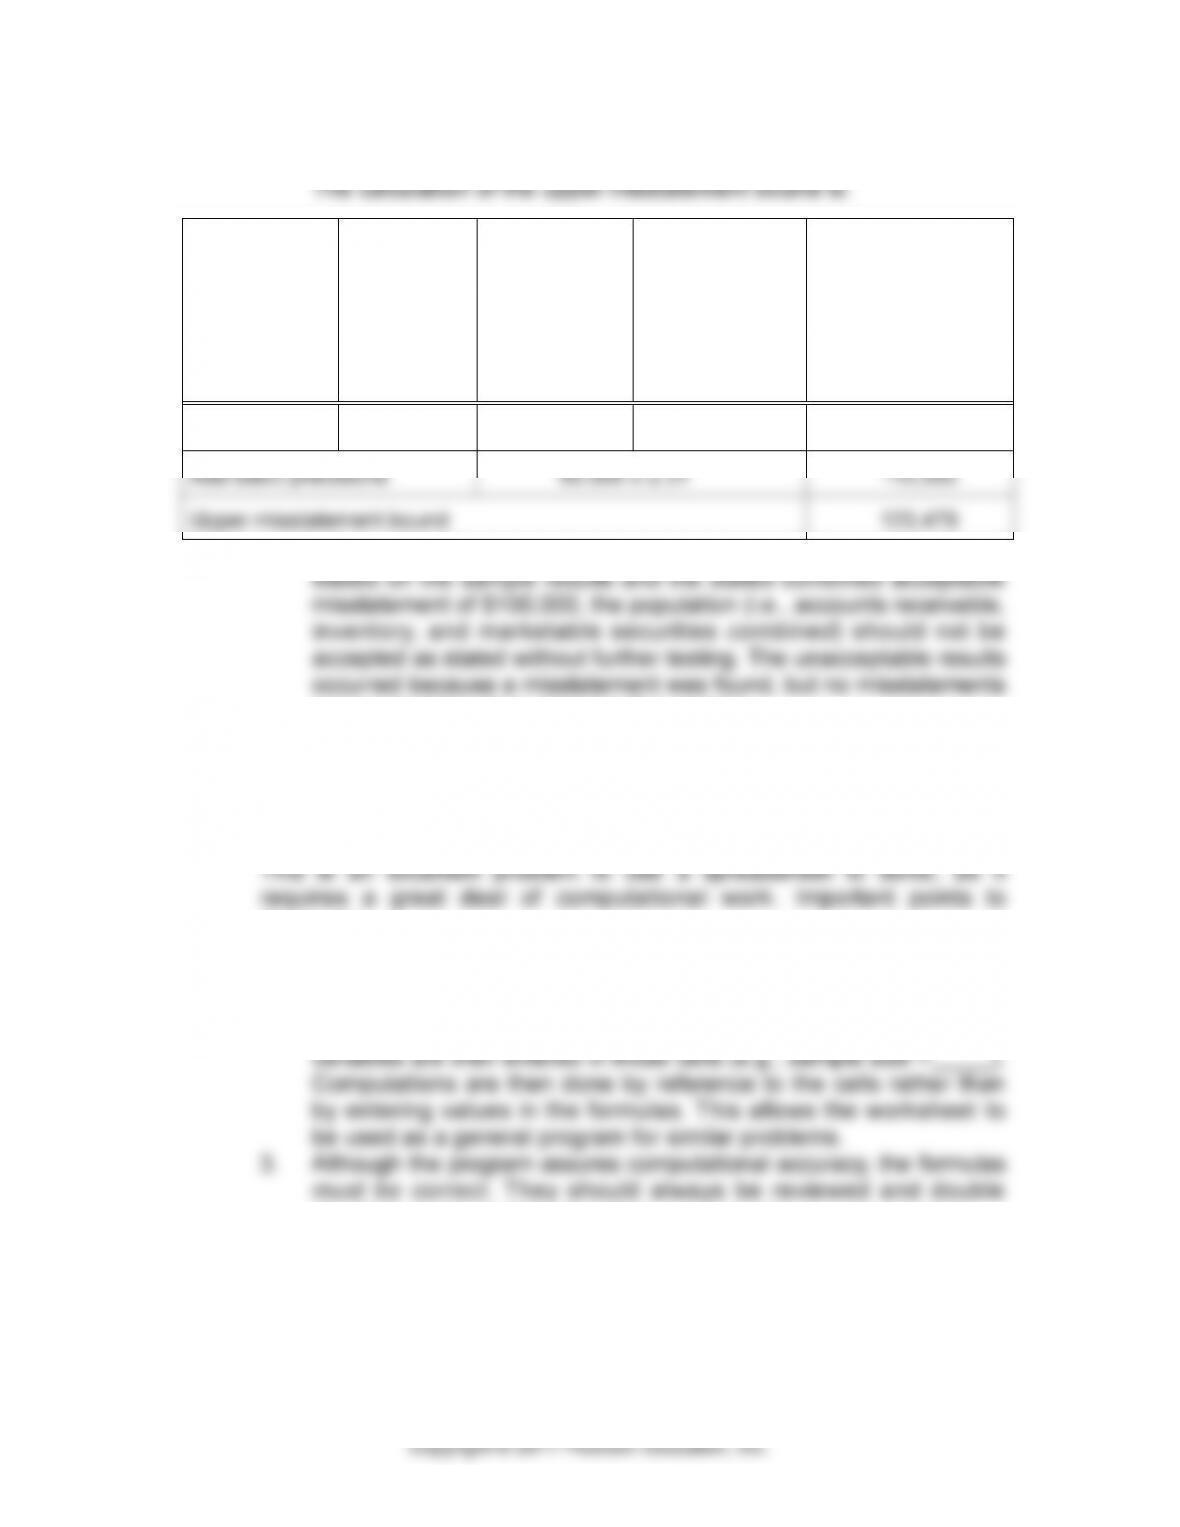
17–28 (continued)
(a)
TAINTING
(b)
SAMPLING
INTERVAL
( c = a x b)
PROJECTED
MISSTATE–
MENT
(d)
INCREMENTAL
CHANGE IN
CONFIDENCE
FACTOR
(e = c x d)
PROJECTED
MISSTATEMENT
PLUS
INCREMENTAL
ALLOWANCE FOR
SAMPLING RISK
.101
50,000
5,050
1.58
7,979
Add basic precisions
50,000 x 2.31
115,500
Upper misstatement bound
123,479
were expected when planning the sample.
17–29 1. (a) 2. (d) 3. (c) 4. (a) 5. (d)
17–30 (see text Web site for Excel solution for part a.– Filename P1730.xls)
stress are:
1. The spreadsheet program is set up in two sections: one for data
entry and one for computations.
2. Cells are set up for variables by name, and the values for the
checked, and test data should be processed to assure accuracy.
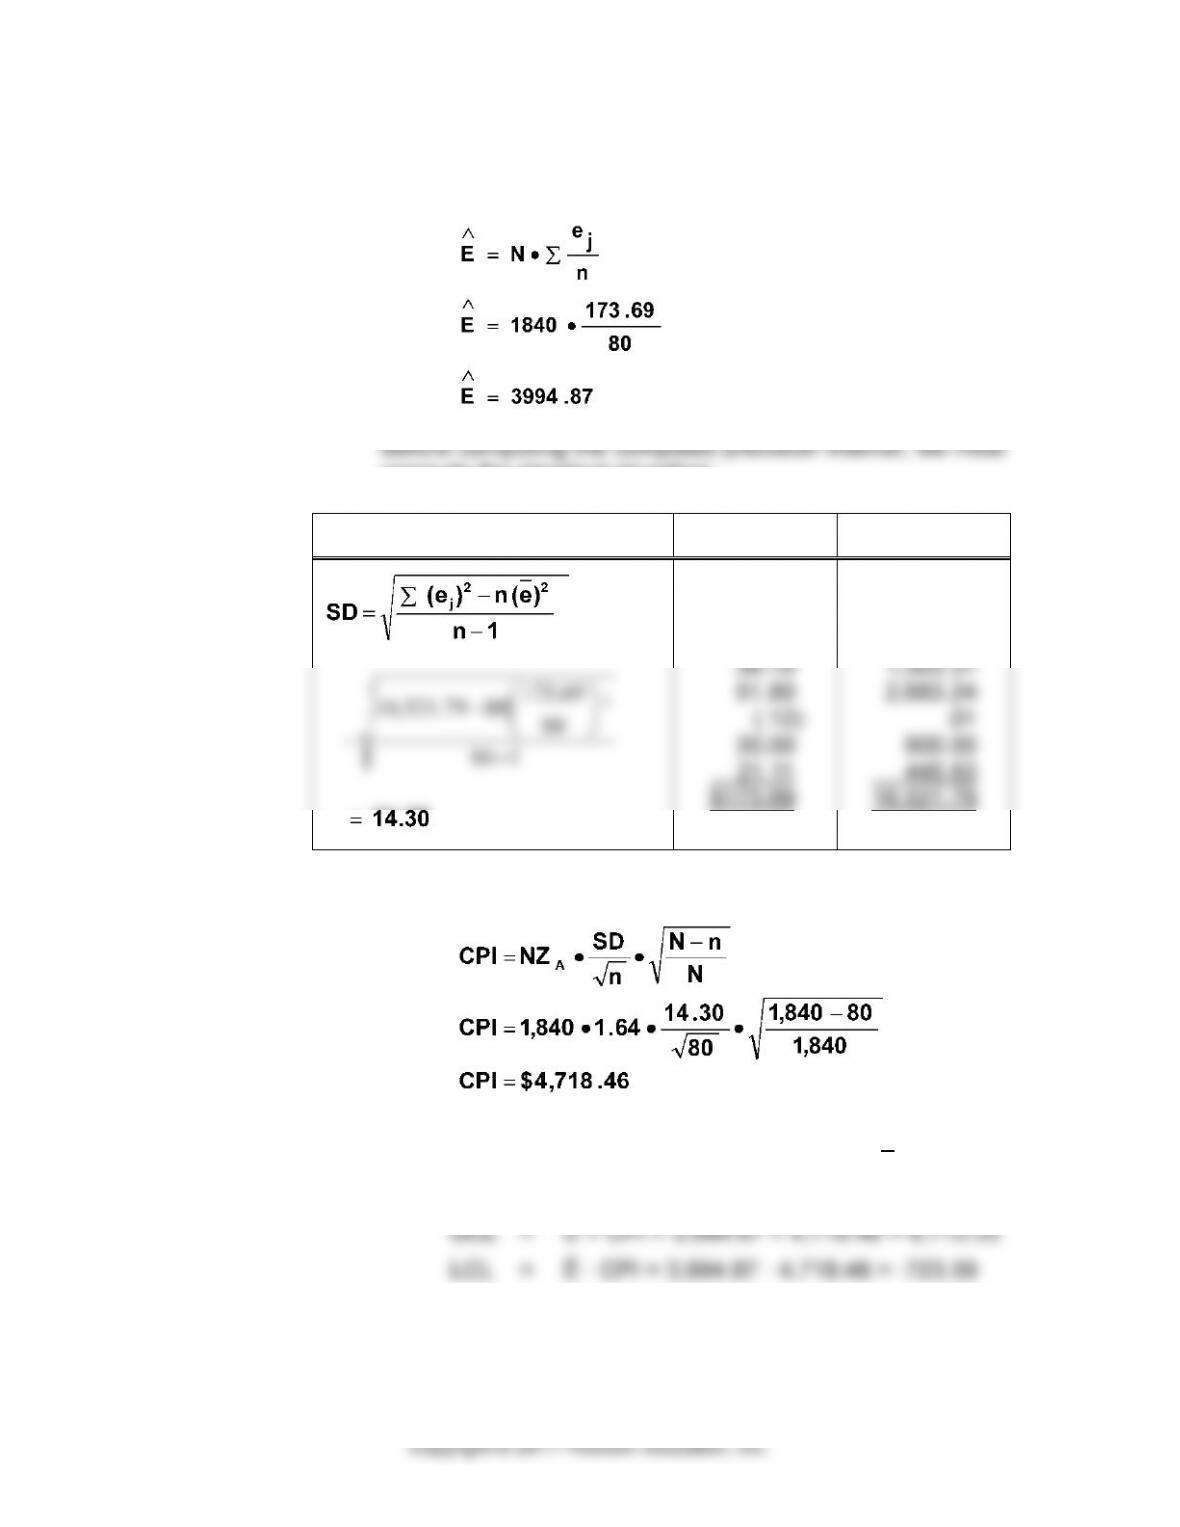
17–30 (continued)
a. Calculating the point estimate:
compute the standard deviation:
ej
(ej)2
$(72.00 )
65.70
41.10
36.10
51.80
(.12 )
30.00
21.11
$173.69
5,184.00
4,316.49
1,689.21
1,303.31
2,683.24
.01
900.00
445.63
16,521.79
Computed precision interval:
The confidence interval is expressed as 3,994.87 + 4,718.46.
To compute the confidence limits,
17–18
17–30 (continued)
$8,713.33.
c. The options available to the auditor at this point are:
1. Perform expanded audit tests in specific areas.
2. Increase the sample size.
Cases
a. Determination of ARIA – Note that there are many ways to estimate
ARIA. One method is as follows:
ARIA = AAR / (IR x CR x SAPR)
misstatement.
Tolerable misstatement as a percent:
= TM / Population
Confidence factor
(10% ARIA , no expected misstatements) 2.31