6-1
6-23 (45 min.) Budgeting: service company.
Sunshine Window Washers (SWW) provides window-washing services to commercial clients.
The company has enjoyed considerable growth in recent years due to a successful marketing
campaign and favorable reviews on service-rating Web sites. Sunshine owner Sam Davis makes
sales calls himself and quotes on jobs based on square footage of window surface. Sunshine hires
college students to drive the company vans to jobs and wash the windows. A part-time bookkeeper
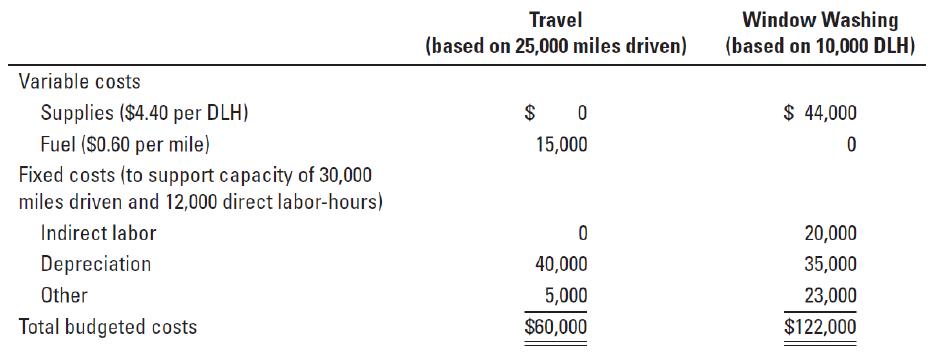
takes care of billing customers and other office tasks. Overhead is accumulated in two cost pools,
one for travel to jobs, allocated based on miles driven, and one for window washing, allocated
based on direct labor–hours (DLH).
Sam Davis estimates that his window washers will work a total of 2,000 jobs during the year
Each job averages 2,000 square feet of window surface and requires 5 direct labor-hours and 12.5
miles of travel. Davis pays his window washers $12 per hour. Taxes and benefits equal 20% of
wages. Wages, taxes, and benefits are considered direct labor costs. The following table presents
the budgeted overhead costs for the Travel and Window Washing cost pools:
Required:
1. Prepare a direct labor budget in both hours and dollars. Calculate the direct labor rate.
2. Calculate the budgeted overhead allocation rates for travel and window washing based on the
budgeted quantity of the cost drivers.
3. Calculate the budgeted total cost of all jobs for the year and the budgeted cost of an average
2,000-square-foot window-washing job.
4. Prepare a revenues budget for the year, assuming that Sunshine charges customers $0.10 per
square foot.
5. Calculate the budgeted operating income.
6. Davis believes that spending $15,000 in additional advertising will lead to a 20% increase in
the number of jobs. Recalculate the budgeted revenue and operating income assuming this
change is made. Calculate expenses by multiplying the existing budgeted cost per job
calculated in requirement 3 by the number of jobs and adding the $15,000 advertising cost.
Based on the change in budgeted operating income, would you recommend the investment?
7. Do you see any flaw in this analysis? How could the analysis be improved? Should SWW
spend $15,000 in additional advertising?
8. What is SWW’s profitability if sales should decline to 1,800 jobs annually? What actions can
Davis take to improve profitability?
SOLUTION
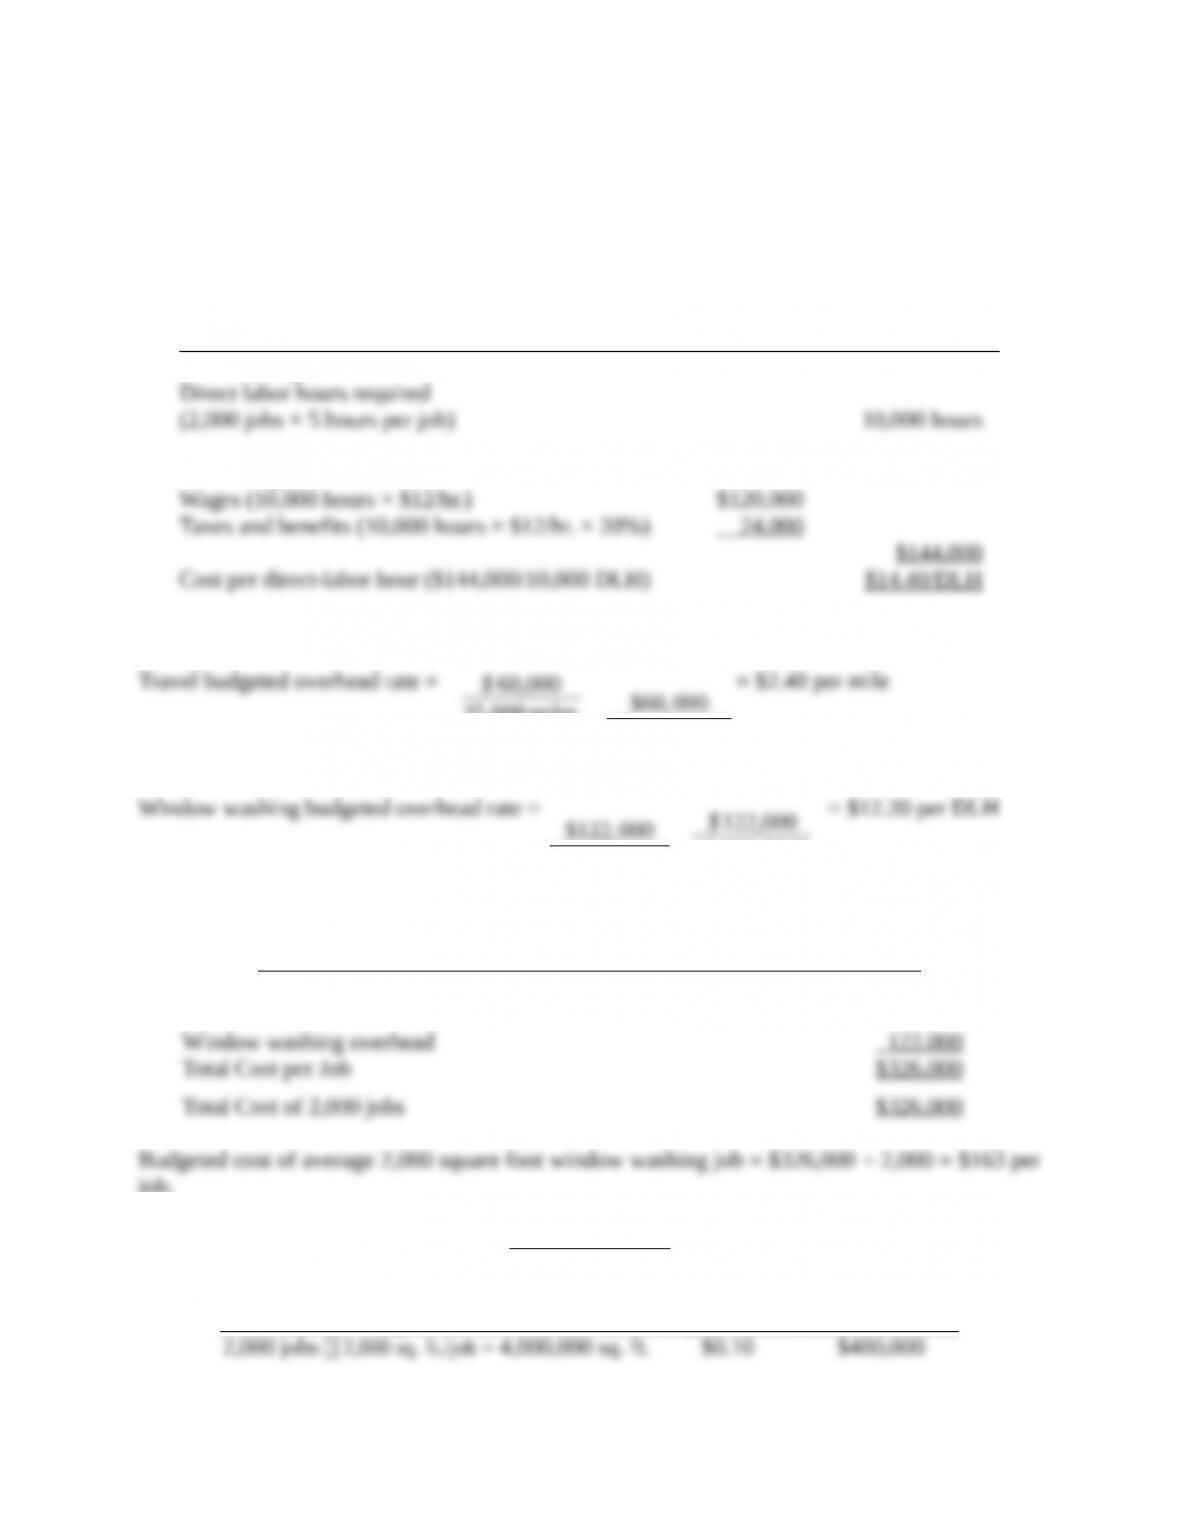
1.
Direct Labor Budget in Hours and Dollars
Total
Hours Budget
Direct labor hours required
(2,000 jobs × 5 hours per job)
10,000 hours
Cost Budget
Wages (10,000 hours × $12/hr.)
$120,000
Taxes and benefits (10,000 hours × $12/hr. × 20%)
24,000
$144,000
Cost per direct-labor hour ($144,000/10,000 DLH)
$14.40/DLH
2.
Travel budgeted overhead rate =
$60,000
25,000 miles
= $2.40 per mile
Window washing budgeted overhead rate =
$122,000
10,000 DLH
= $12.20 per DLH
3.
Budgeted Cost of Average 2,000 Square-Foot Window Washing Job
Direct labor
$144,000
Travel overhead
60,000
Window washing overhead
122,000
Total Cost per Job
$326,000
Total Cost of 2,000 jobs
$326,000
Budgeted cost of average 2,000 square foot window washing job = $326,000 ÷ 2,000 = $163 per
job.
Revenue Budget
Square Feet
Price per
Square Foot
Total Revenues
2,000 jobs 2,000 sq. ft./job = 4,000,000 sq. ft.
$0.10
$400,000
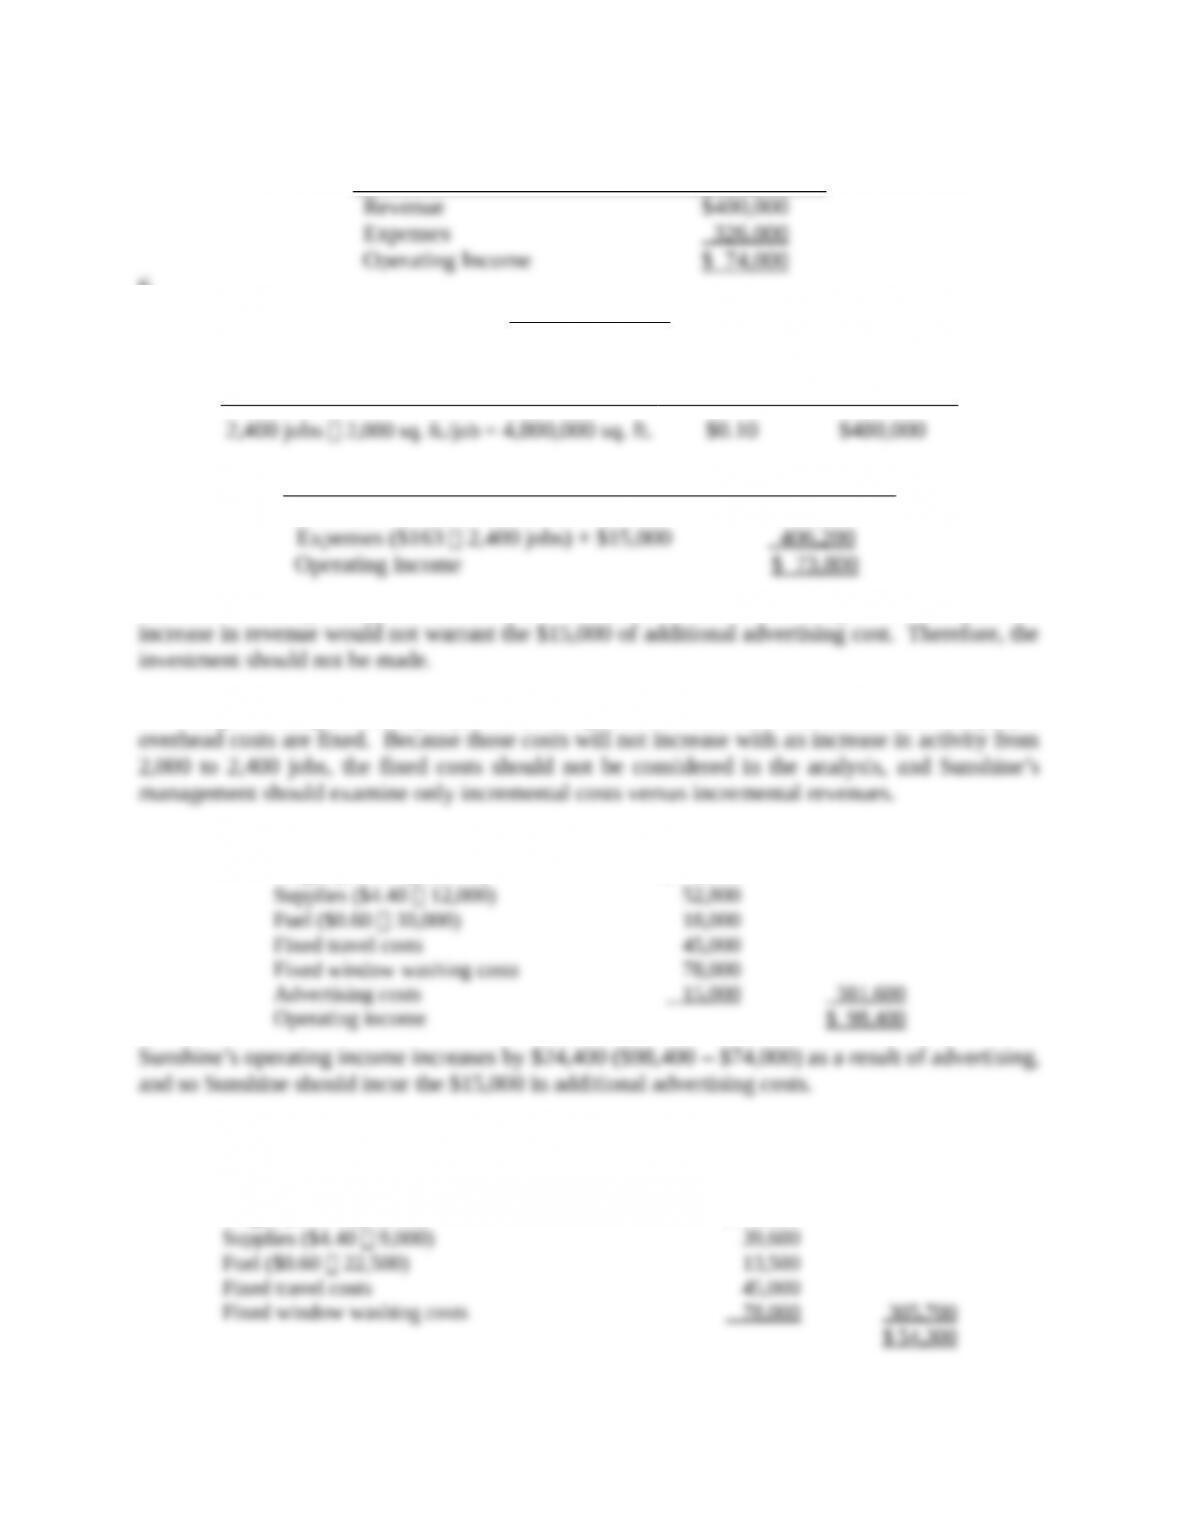
5.
2,000 jobs
Revenue
$400,000
6-3
Expenses
326,000
Operating Income
$ 74,000
6.
Revenue Budget
Square Feet
Price per
Square Foot
Total Revenues
2,400 jobs 2,000 sq. ft./job = 4,800,000 sq. ft.
$0.10
$480,000
2,400 jobs
Revenue
$480,000
Expenses ($163 2,400 jobs) + $15,000
406,200
Operating Income
$ 73,800
Decrease in net operating income: $74,000 – $73,800 = $200. According to this analysis, the
increase in revenue would not warrant the $15,000 of additional advertising cost. Therefore, the
investment should not be made.
7. Using the budgeted cost per job of $163 ignores the fact that $123,000 of the company’s
overhead costs are fixed. Because those costs will not increase with an increase in activity from
2,000 to 2,400 jobs, the fixed costs should not be considered in the analysis, and Sunshine’s
management should examine only incremental costs versus incremental revenues.
Revenues
$480,000
Wages ($14.40 12,000)
$172,800
Supplies ($4.40 12,000)
52,800
Fuel ($0.60 30,000)
18,000
Fixed travel costs
45,000
Fixed window washing costs
78,000
Advertising costs
15,000
381,600
Operating income
$ 98,400
Sunshine’s operating income increases by $24,400 ($98,400 – $74,000) as a result of advertising,
and so Sunshine should incur the $15,000 in additional advertising costs.
8. The following table shows Sunshine’s profitability if sales decline to 1,800 jobs.
Revenue (1,800 jobs 2,000 sq. ft. 0.10/sq. ft.
$360,000
Wages ($14.40 9,000)
$129,600
Supplies ($4.40 9,000)
39,600
Fuel ($0.60 22,500)
13,500
Fixed travel costs
45,000
Fixed window washing costs
78,000
305,700
$ 54,300
If revenue should fall to 1,800 jobs, Sunshine’s management should examine the company’s fixed
overhead costs to determine if any cuts are possible. Variable product costs will naturally decline
6-4
with a decline in jobs, but fixed costs will not decline without management taking action. While
depreciation cost is not likely something that management can reduce, the “other” fixed overhead
costs are significant and should be examined.
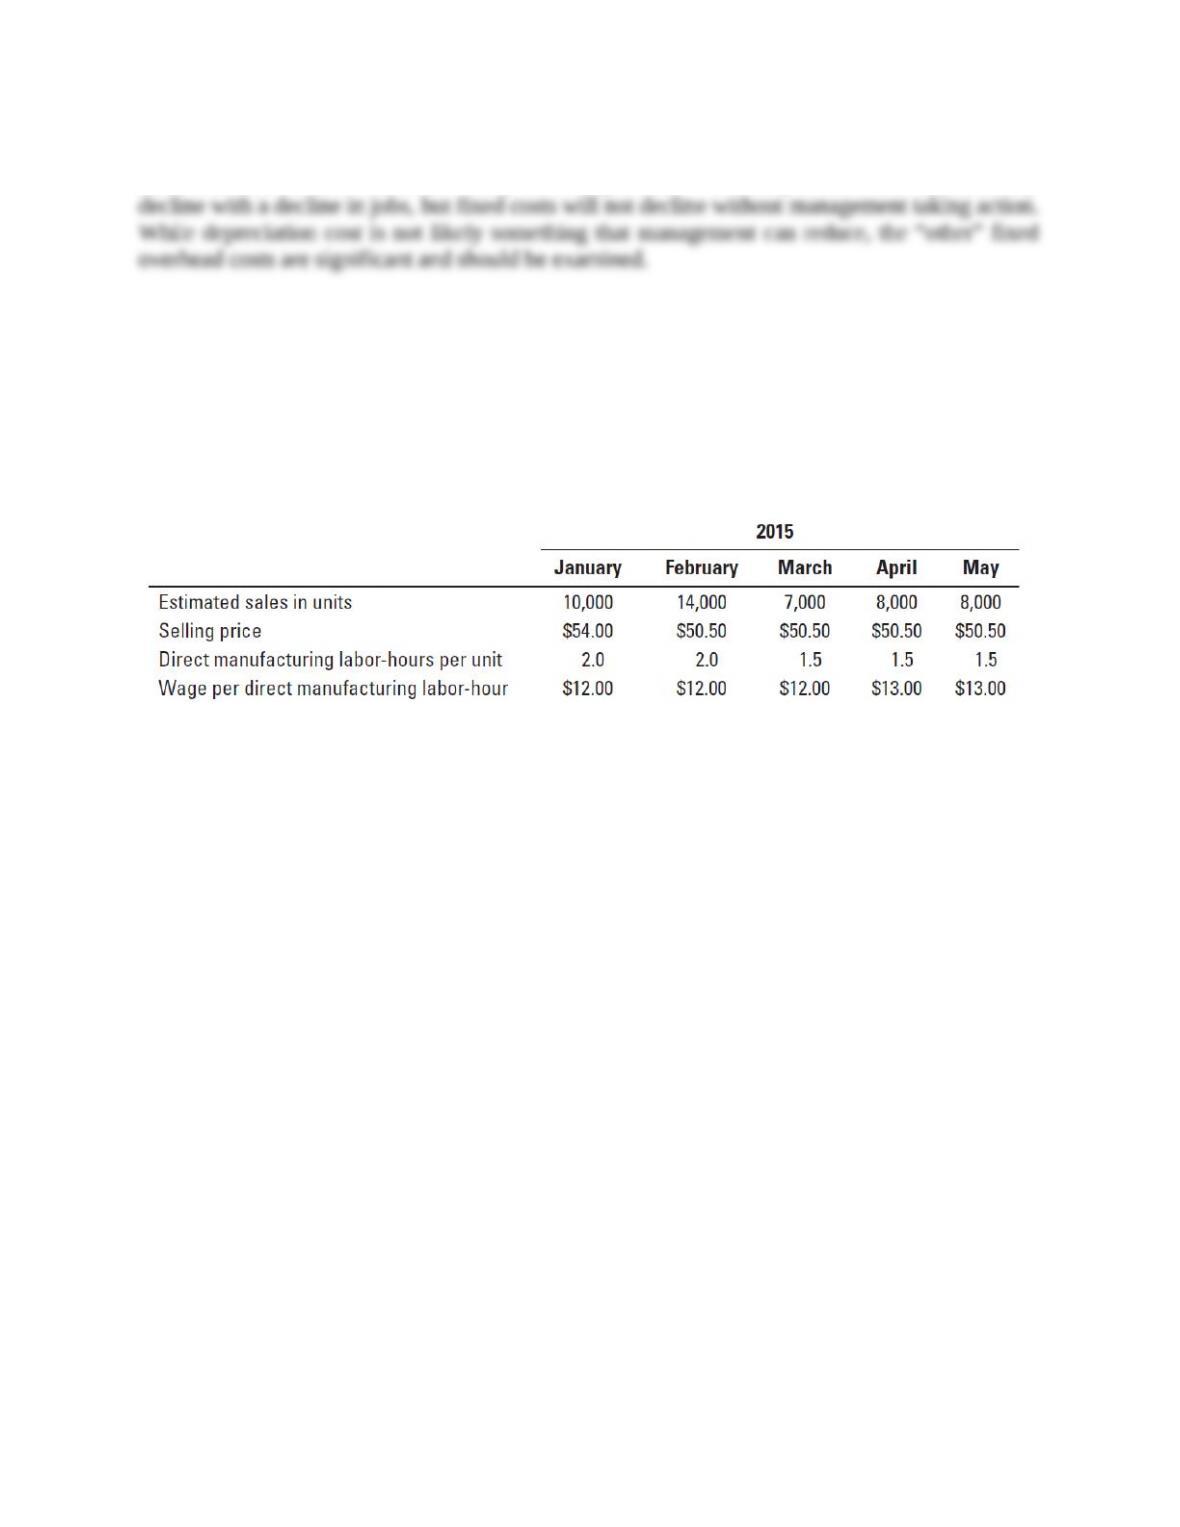
6-24 (15-25 min.) Budgets for production and direct manufacturing labor.
(CMA, adapted) Roletter Company makes and sells artistic frames for pictures of weddings,
graduations, and other special events. Bob Anderson, the controller, is responsible for preparing
Roletter’s master budget and has accumulated the following information for 2015:
In addition to wages, direct manufacturing labor-related costs include pension contributions of
$0.50 per hour, worker’s compensation insurance of $0.20 per hour, employee medical insurance
of $0.30 per hour, and Social Security taxes. Assume that as of January 1, 2015, the Social Security
tax rates are 7.5% for employers and 7.5% for employees. The cost of employee benefits paid by
Roletter on its employees is treated as a direct manufacturing labor cost.
Roletter has a labor contract that calls for a wage increase to $13 per hour on April 1, 2015.
New labor- saving machinery has been installed and will be fully operational by March 1, 2015.
Roletter expects to have 17,500 frames on hand at December 31, 2014, and it has a policy of
carrying an end–of-month inventory of 100% of the following month’s sales plus 50% of the
second following month’s sales.
Required:
1. Prepare a production budget and a direct manufacturing labor budget for Roletter Company by
month and for the first quarter of 2015. You may combine both budgets in one schedule. The
direct manufacturing labor budget should include labor-hours and show the details for each
labor cost category.
2. What actions has the budget process prompted Roletter’s management to take?
3. How might Roletter’s managers use the budget developed in requirement 1 to better manage
the company?
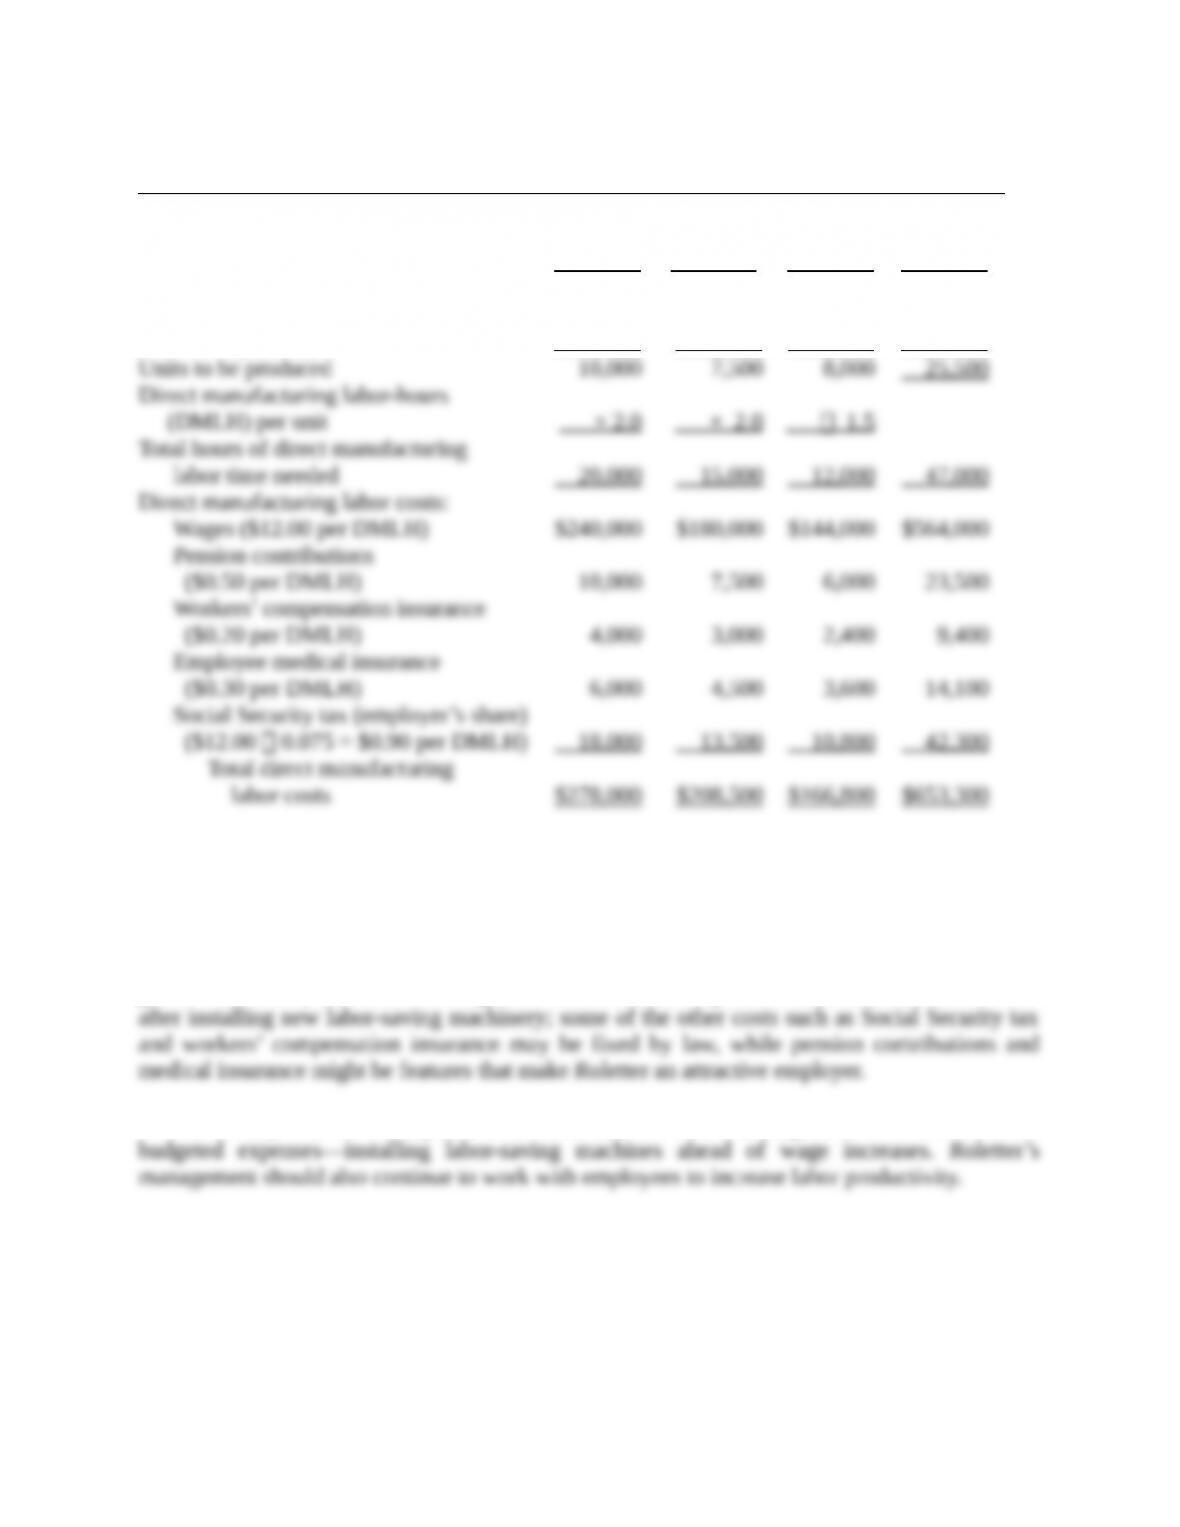
SOLUTION Roletter Company
Budget for Production and Direct Manufacturing Labor
for the Quarter Ended March 31, 2015
January February March Quarter
6-5
Budgeted sales (units) 10,000 14,000 7,000 31,000
Add target ending finished goods
inventorya (units) 17,500 11,000 12,000 12,000
Total requirements (units) 27,500 25,000 19,000 43,000
Deduct beginning finished goods
inventory (units) 17,500 17,500 11,000 17,500
Units to be produced 10,000 7,500 8,000 25,500
Direct manufacturing labor-hours
(DMLH) per unit × 2.0 × 2.0 1.5
Total hours of direct manufacturing
labor time needed 20,000 15,000 12,000 47,000
Direct manufacturing labor costs:
Wages ($12.00 per DMLH) $240,000 $180,000 $144,000 $564,000
Pension contributions
($0.50 per DMLH) 10,000 7,500 6,000 23,500
Workers’ compensation insurance
($0.20 per DMLH) 4,000 3,000 2,400 9,400
Employee medical insurance
($0.30 per DMLH) 6,000 4,500 3,600 14,100
Social Security tax (employer’s share)
($12.00 0.075 = $0.90 per DMLH) 18,000 13,500 10,800 42,300
Total direct manufacturing
labor costs $278,000 $208,500 $166,800 $653,300
a100% of the first following month’s sales plus 50% of the second following month’s sales.
Note that the employee Social Security tax of 7.5% is irrelevant. Such taxes are withheld from employees’
wages and paid to the government by the employer on behalf of the employees; therefore, the 7.5% amounts are not
additional costs to the employer.
2. The budget process would prompt Roletter’s management to look for ways to reduce finished
goods inventories, the manufacturing labor hours needed to produce each unit both before and
after installing new labor–saving machinery; some of the other costs such as Social Security tax
and workers’ compensation insurance may be fixed by law, while pension contributions and
medical insurance might be features that make Roletter an attractive employer.
3. We already see one example of a decision that Roletter’s management took based on the
budgeted expenses—installing labor-saving machines ahead of wage increases. Roletter’s
management should also continue to work with employees to increase labor productivity.
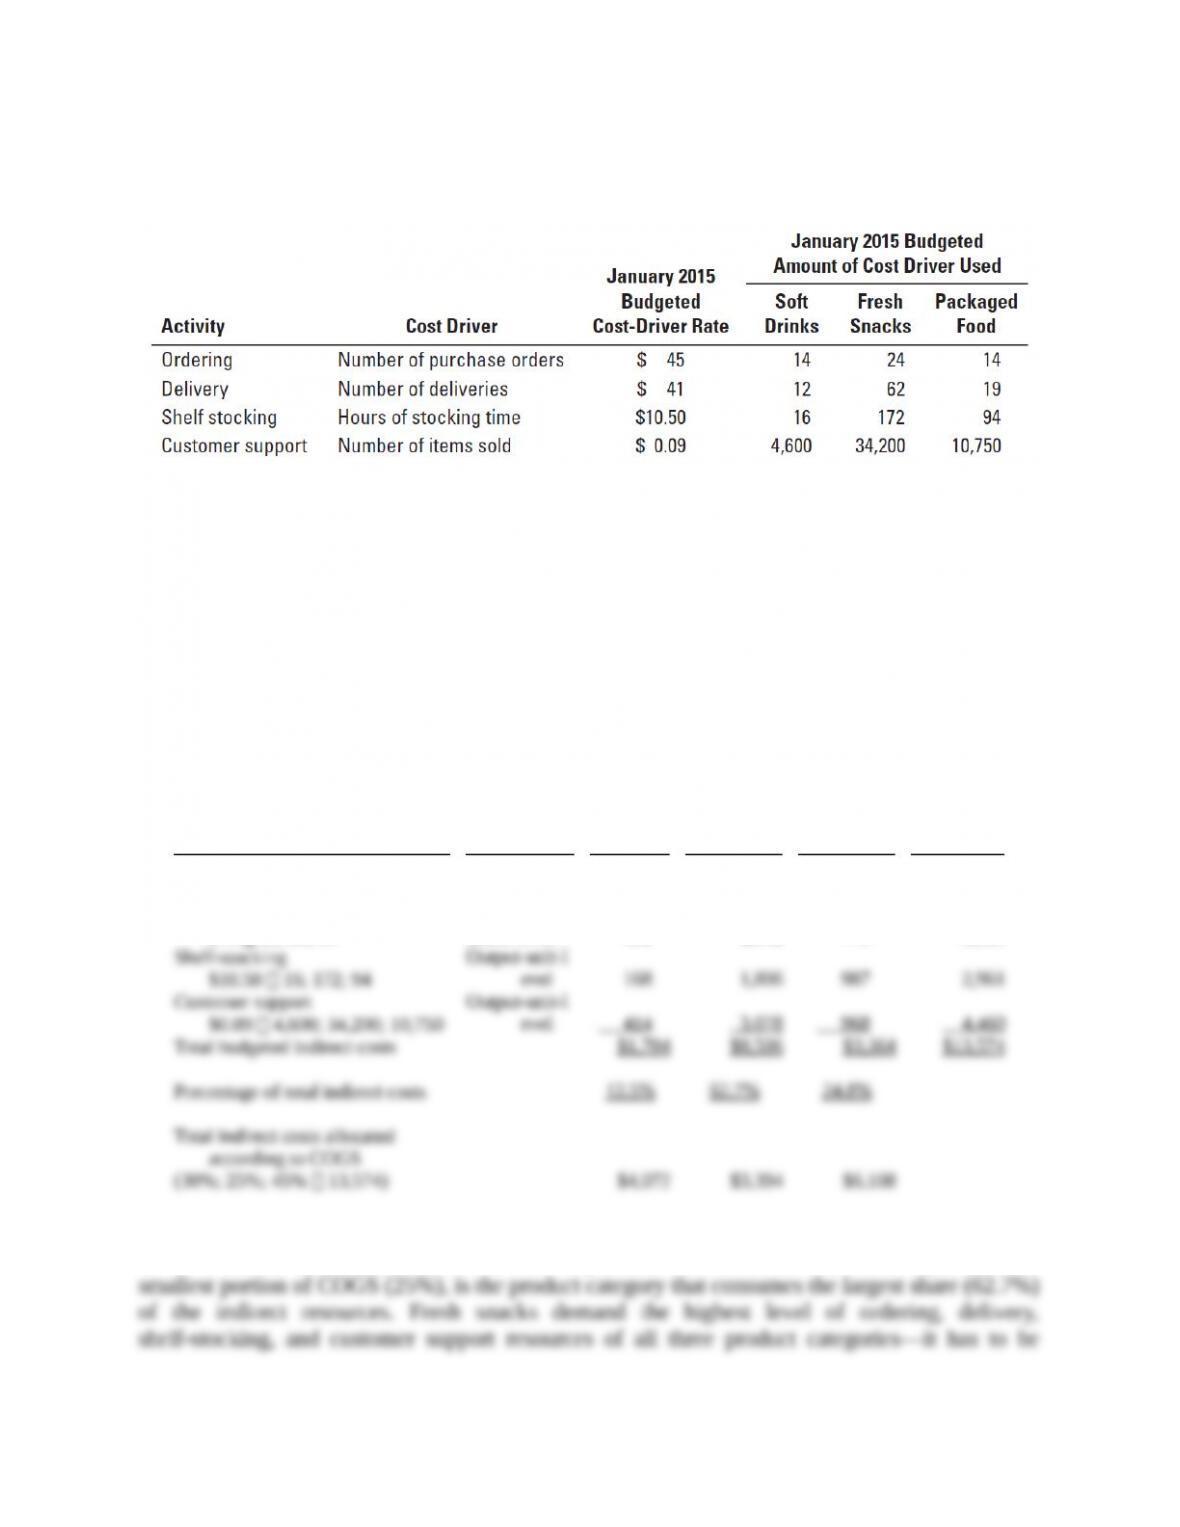
6-25 (20–30 min.) Activity-based budgeting.
The Jerico store of Jiffy Mart, a chain of small neighborhood convenience stores, is preparing its
activity-based budget for January 2015. Jiffy Mart has three product categories: soft drinks (35%
of cost of goods sold [COGS]), fresh produce (25% of COGS), and packaged food (40% of
COGS). The following table shows the four activities that consume indirect resources at the Jerico
store, the cost drivers and their rates, and the cost-driver amount budgeted to be consumed by each
activity in January 2015.
6-6
Required:
1. What is the total budgeted indirect cost at the Jerico store in January 2015? What is the total
budgeted cost of each activity at the Jerico store for January 2015? What is the budgeted
indirect cost of each product category for January 2015?
2. Which product category has the largest fraction of total budgeted indirect costs?
3. Given your answer in requirement 2, what advantage does Jiffy Mart gain by using an activity–
based approach to budgeting over, say, allocating indirect costs to products based on cost of
goods sold?
SOLUTION
1.
Activity
Cost
Hierarchy
Soft
Drinks
Fresh
Snacks
Packaged
Food
Total
Ordering
$45 14; 24; 14
Delivery
$41 12; 62; 19
Shelf-stocking
$10.50 16; 172; 94
Customer support
$0.09 4,600; 34,200; 10,750
Total budgeted indirect costs
Percentage of total indirect costs
Batch-level
Batch-level
Output-unit-
level
Output-unit-
level
$ 630
492
168
414
$1,704
12.5%
$1,080
2,542
1,806
3,078
$8,506
62.7%
$ 630
779
987
968
$3,364
24.8%
$ 2,340
3,813
2,961
4,460
$13,574
Total indirect costs allocated
according to COGS
(30%; 25%; 45% 13,574)
$4,072
$3,394
$6,108
2. Refer to the last row of the table in requirement 1. Fresh snacks, which represents the
smallest portion of COGS (25%), is the product category that consumes the largest share (62.7%)
of the indirect resources. Fresh snacks demand the highest level of ordering, delivery, shelf–
stocking, and customer support resources of all three product categories—it has to be ordered,
delivered, and stocked in small, perishable batches, and convenience store customers often require
more assistance when purchasing.
6-7
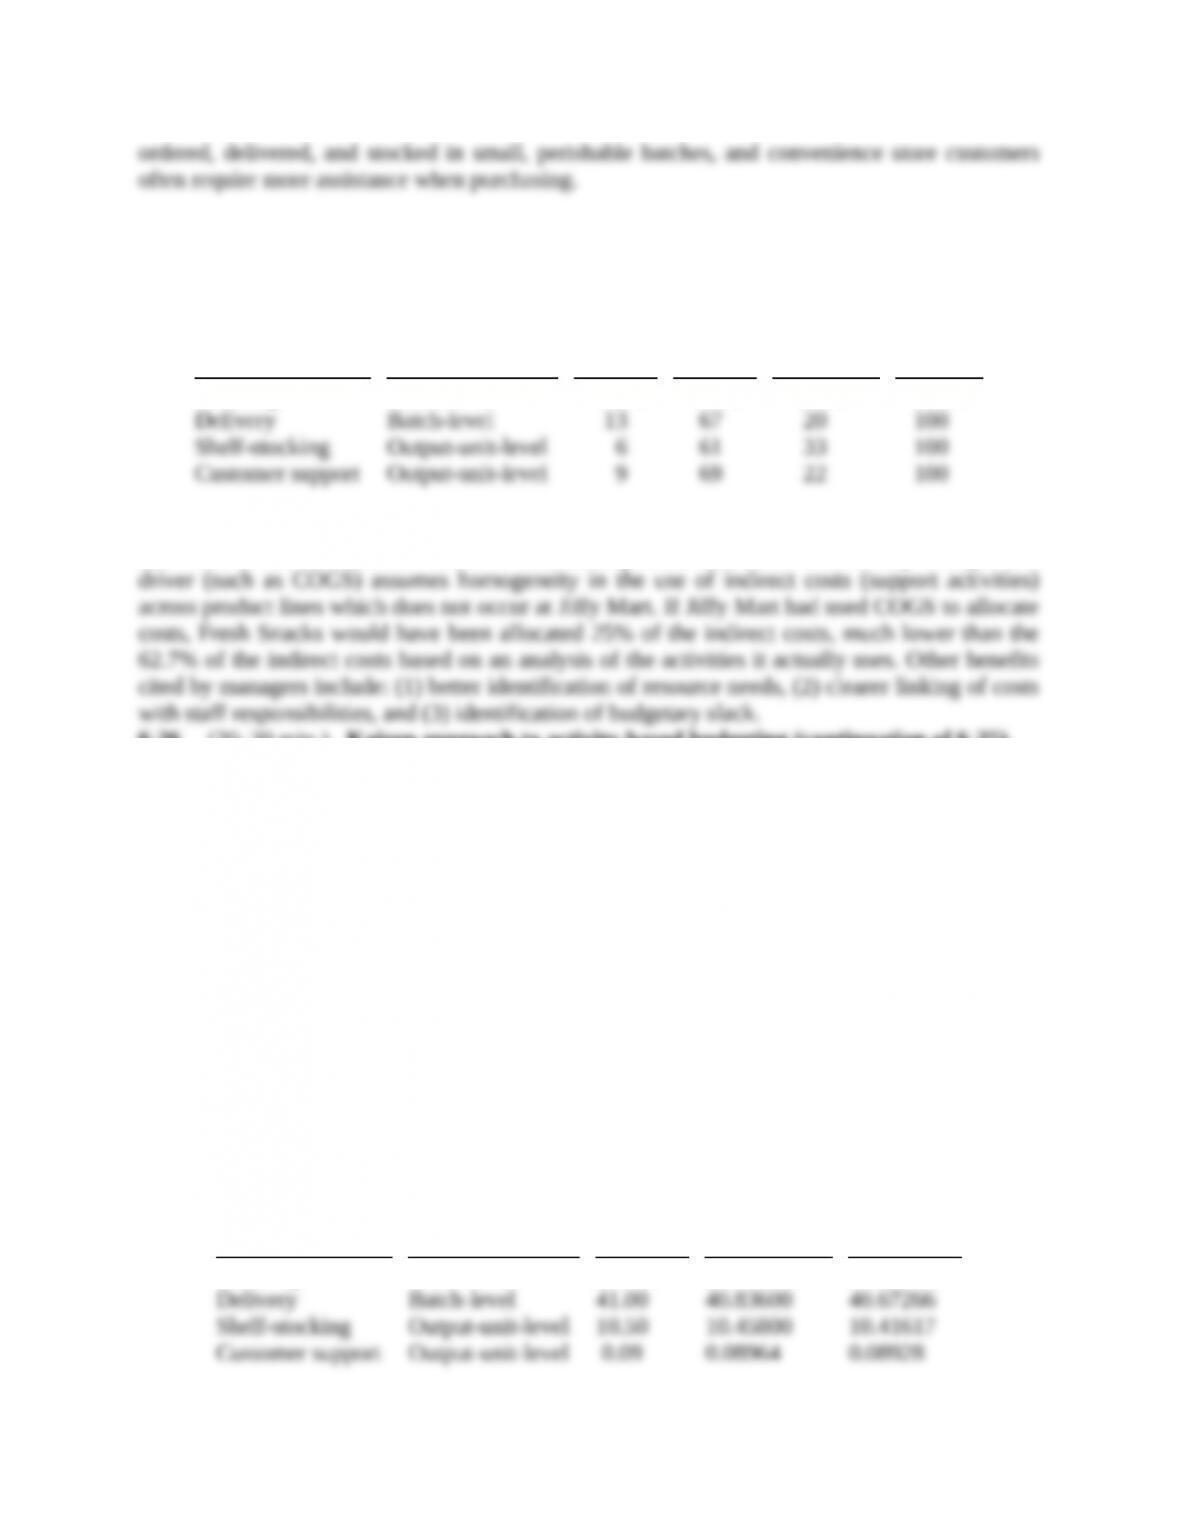
3. An ABB approach recognizes how different products require different mixes of support
activities. The relative percentage of how each product area uses the cost driver at each activity
area is:
Activity
Cost
Hierarchy
Soft
Drinks
Fresh
Snacks
Packaged
Food
Total
Ordering
Delivery
Shelf-stocking
Customer support
Batch-level
Batch-level
Output-unit-level
Output-unit-level
27%
13
6
9
46%
67
61
69
27%
20
33
22
100%
100
100
100
By recognizing these differences, Jiffy Mart’s managers are better able to budget for different unit
sales levels and different mixes of individual product-line items sold. Using a single cost driver
(such as COGS) assumes homogeneity in the use of indirect costs (support activities) across
product lines which does not occur at Jiffy Mart. If Jiffy Mart had used COGS to allocate costs,
Fresh Snacks would have been allocated 25% of the indirect costs, much lower than the 62.7% of
the indirect costs based on an analysis of the activities it actually uses. Other benefits cited by
managers include: (1) better identification of resource needs, (2) clearer linking of costs with staff
responsibilities, and (3) identification of budgetary slack.
6-26 (20–30 min.) Kaizen approach to activity-based budgeting (continuation of 6-25).
Jiffy Mart has a Kaizen (continuous improvement) approach to budgeting monthly activity costs
for each month of 2015. Each successive month, the budgeted cost-driver rate decreases by 0.4%
relative to the preceding month. So, for example, February’s budgeted cost-driver rate is 0.996
times January’s budgeted cost–driver rate, and March’s budgeted cost-driver rate is 0.996 times
the budgeted February rate. Jiffy Mart assumes that the budgeted amount of cost-driver usage
remains the same each month.
Required:
1. What are the total budgeted cost for each activity and the total budgeted indirect cost for March
2015?
2. What are the benefits of using a Kaizen approach to budgeting? What are the limitations of
this approach, and how might Jiffy Mart management overcome them?
SOLUTION
1.
Budgeted Cost-Driver Rates
Activity
Cost Hierarchy
January
February
March
Ordering
Delivery
Shelf-stocking
Customer support
Batch-level
Batch-level
Output-unit-level
Output-unit-level
$45.00
41.00
10.50
0.09
$44.82000
40.83600
10.45800
0.08964
$44.64072
40.67266
10.41617
0.08928
The March 2015 rates can be used to compute the total budgeted cost for each activity area in
March 2015:
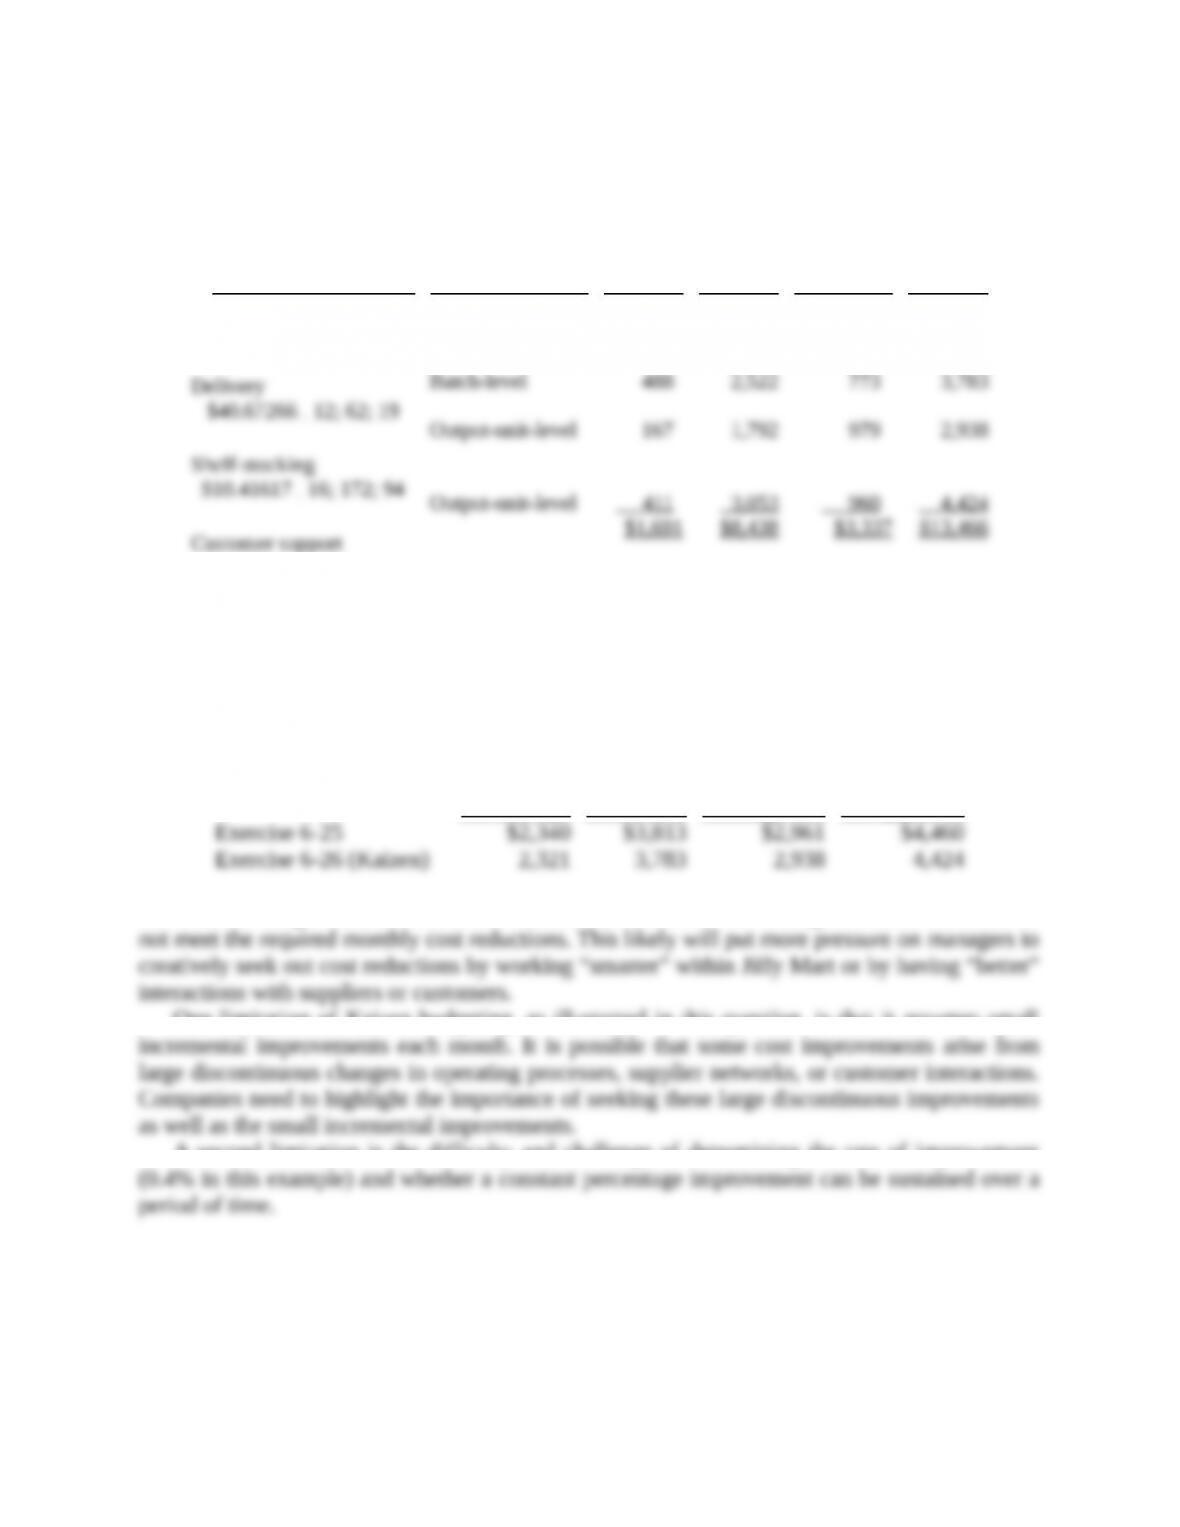
6-8
Activity
Cost
Hierarchy
Soft
Drinks
Fresh
Produce
Packaged
Food
Total
Ordering
$44.64072
14; 24; 14
Delivery
$40.67266
12; 62; 19
Shelf-stocking
$10.41617
16; 172; 94
Customer support
$0.08928
4,600;
34,200; 10,750
Total
Batch-level
Batch-level
Output-unit-level
Output-unit-level
$ 625
488
167
411
$1,691
$1,071
2,522
1,792
3,053
$8,438
$ 625
773
979
960
$3,337
$ 2,321
3,783
2,938
4,424
$13,466
2. A Kaizen budgeting approach signals management’s commitment to systematic cost
reduction. Compare the budgeted costs from Question 6-25 and 6-26.
Ordering
Delivery
Shelf-
Stocking
Customer
Support
Exercise 6-25
$2,340
$3,813
$2,961
$4,460
Exercise 6-26 (Kaizen)
2,321
3,783
2,938
4,424
The Kaizen budget number will show unfavorable variances for managers whose activities do not
meet the required monthly cost reductions. This likely will put more pressure on managers to
creatively seek out cost reductions by working “smarter” within Jiffy Mart or by having “better”
interactions with suppliers or customers.
One limitation of Kaizen budgeting, as illustrated in this question, is that it assumes small
incremental improvements each month. It is possible that some cost improvements arise from large
discontinuous changes in operating processes, supplier networks, or customer interactions.
Companies need to highlight the importance of seeking these large discontinuous improvements
as well as the small incremental improvements.
A second limitation is the difficulty and challenge of determining the rate of improvement
(0.4% in this example) and whether a constant percentage improvement can be sustained over a
period of time.
6-27 (15 min.) Responsibility and controllability.
Consider each of the following independent situations for Tropical Hot Tubs. Tropical
manufactures and sells hot tubs. The company also contracts to service both its own and other
brands of hot tubs. Tropical has a manufacturing plant, a supply warehouse that supplies both the
manufacturing plant and the service technicians (who often need parts to repair hot tubs), and 10
service vans. The service technicians drive to customer sites to service the hot tubs. Tropical owns
the vans, pays for the gas, and supplies hot tub parts, but the technicians own their own tools.
1. In the manufacturing plant, the production manager is not happy with the motors that the
purchasing manager has been purchasing. In May, the production manager stops requesting
6-9
motors from the supply warehouse and starts purchasing them directly from a different motor
manufacturer. Actual materials costs in May are higher than budgeted.
2. Overhead costs in the manufacturing plant for June are much higher than budgeted.
Investigation reveals a utility rate hike in effect that was not figured into the budget.
3. Gasoline costs for each van are budgeted based on the service area of the van and the amount
of driving expected for the month. The driver of van 3 routinely has monthly gasoline costs
exceeding the budget for van 3. After investigating, the service manager finds that the driver
has been driving the van for personal use.
4. Cascades Resort and Spa, one of Tropical’s hot tub service customers, calls the service people
only for emergencies and not for routine maintenance. Thus, the materials and labor costs for
these service calls exceeds the monthly budgeted costs for a contract customer.
5. Tropical’s service technicians are paid an hourly wage, with overtime pay if they exceed 40
hours per week, excluding driving time. Fred Friendly, one of the technicians, frequently
exceeds 40 hours per week. Service customers are happy with Fred’s work, but the service
manager talks to him constantly about working more quickly. Fred’s overtime causes the actual
costs of service to exceed the budget almost every month.
6. The cost of gasoline has increased by 50% this year, which caused the actual gasoline costs to
greatly exceed the budgeted costs for the service vans.
Required:
For each situation described, determine where (that is, with whom) (a) responsibility and (b)
controllability lie. Suggest ways to solve the problem or to improve the situation.
SOLUTION
1. (a) Production manager
(b) Purchasing Manager
The purchasing manager has control of the cost to the extent that he/she is doing the purchasing
and can seek or contract for the best price. The production manager should work with the
purchasing manager. They can, together, possibly find a combination of better motor and better
price for the motor than the production manager has found.
2. (a) Production Manager
(b) External Forces
In the case of the utility rate hike, the production manager would be responsible for the costs, but
they are hard to control. The rates are fixed by the utility company, and there is usually no choice
of which utility company is used. The production manager can try to reduce waste (turn off lights
when not in use, turn of machines when not running, don’t leave water running, etc.) but other than
conservation measures, the manager has no say in the utility rates. The manager might consider
purchasing more energy-efficient machines.
3. (a) Van 3 driver
(b) Service manager
6-10
The driver of each van has the responsibility to stay within budget for the costs of the service
vehicle. The service manager should set policies to which the drivers must adhere, including not
using the van for personal use. The service manager could install GPS in the vans to make sure
they are where they are supposed to be, and can also fire the driver of Van 3 for misusing company
property. (Using the van for personal driving affects the tax deductibility of the van for the firm as
well).
4. (a) Tropical’s service manager
(b) Cascades manager
Because Cascades has a maintenance contract with Tropical, both the hotel manager and Tropical’s
service manager should work together to make sure routine maintenance is scheduled for the
hotel’s hot tubs. This will decrease the number and cost of the repair emergencies. The manager
should also consider the average cost of these service calls over the months where there were no
calls.
5. (a) Service manager
(b) This depends…
The answer to this question really depends on why Fred Friendly works so slowly. If it is because
Fred is chatting with the customers (which may be why they like him), then the service manager
should tell him to only bill for actual time worked. If it is because Fred works intentionally slowly
to get the overtime, then the service manager should consider disciplining him unless he is too
valuable in other ways. If it is because he does not have adequate training, then HR should be
involved, and the service manager should work with Fred to get him more training and with HR
to make sure future hires are adequately trained.
6. (a) Service manager
(b) External forces
Like the cost of utilities, the cost of gasoline is determined externally. However, unlike the case
of utilities, it is possible that the service manager can contract with a gasoline company to buy gas
at a fixed price over a period of time. The advantage for Tropical is that the price is set, and the
advantage for the gasoline company is that they are certain to have a long-term customer even if
the price is lower than for a random customer.
6-28 (15 min.) Responsibility, controllability, and stretch targets.
Consider each of the following independent situations for Happy Tours, a company owned by
Jason Haslett that sells motor coach tours to schools and other groups. Happy Tours owns a fleet
of 10 motor coaches and employs 12 drivers, 1 maintenance technician, 3 sales representatives,
and an office manager. Happy Tours pays for all fuel and maintenance on the coaches. Drivers are
paid $0.50 per mile while in transit, plus $15 per hour while idle (time spent waiting while tour
groups are visiting their destinations). The maintenance technician and office manager are both
full-time salaried employees. The sales representatives work on straight commission.