21-1
1. Modernizing alternative:
Present Value
Discount Factors Net Cash Present
Year At 10% Flow Value
Jan. 1, 2015 1.000 $(36,800000) $(36,800,000)
Dec. 31, 2015 0.909 10,432,500 9,483,143
Dec. 31, 2016 0.826 11,700000 9,664,200
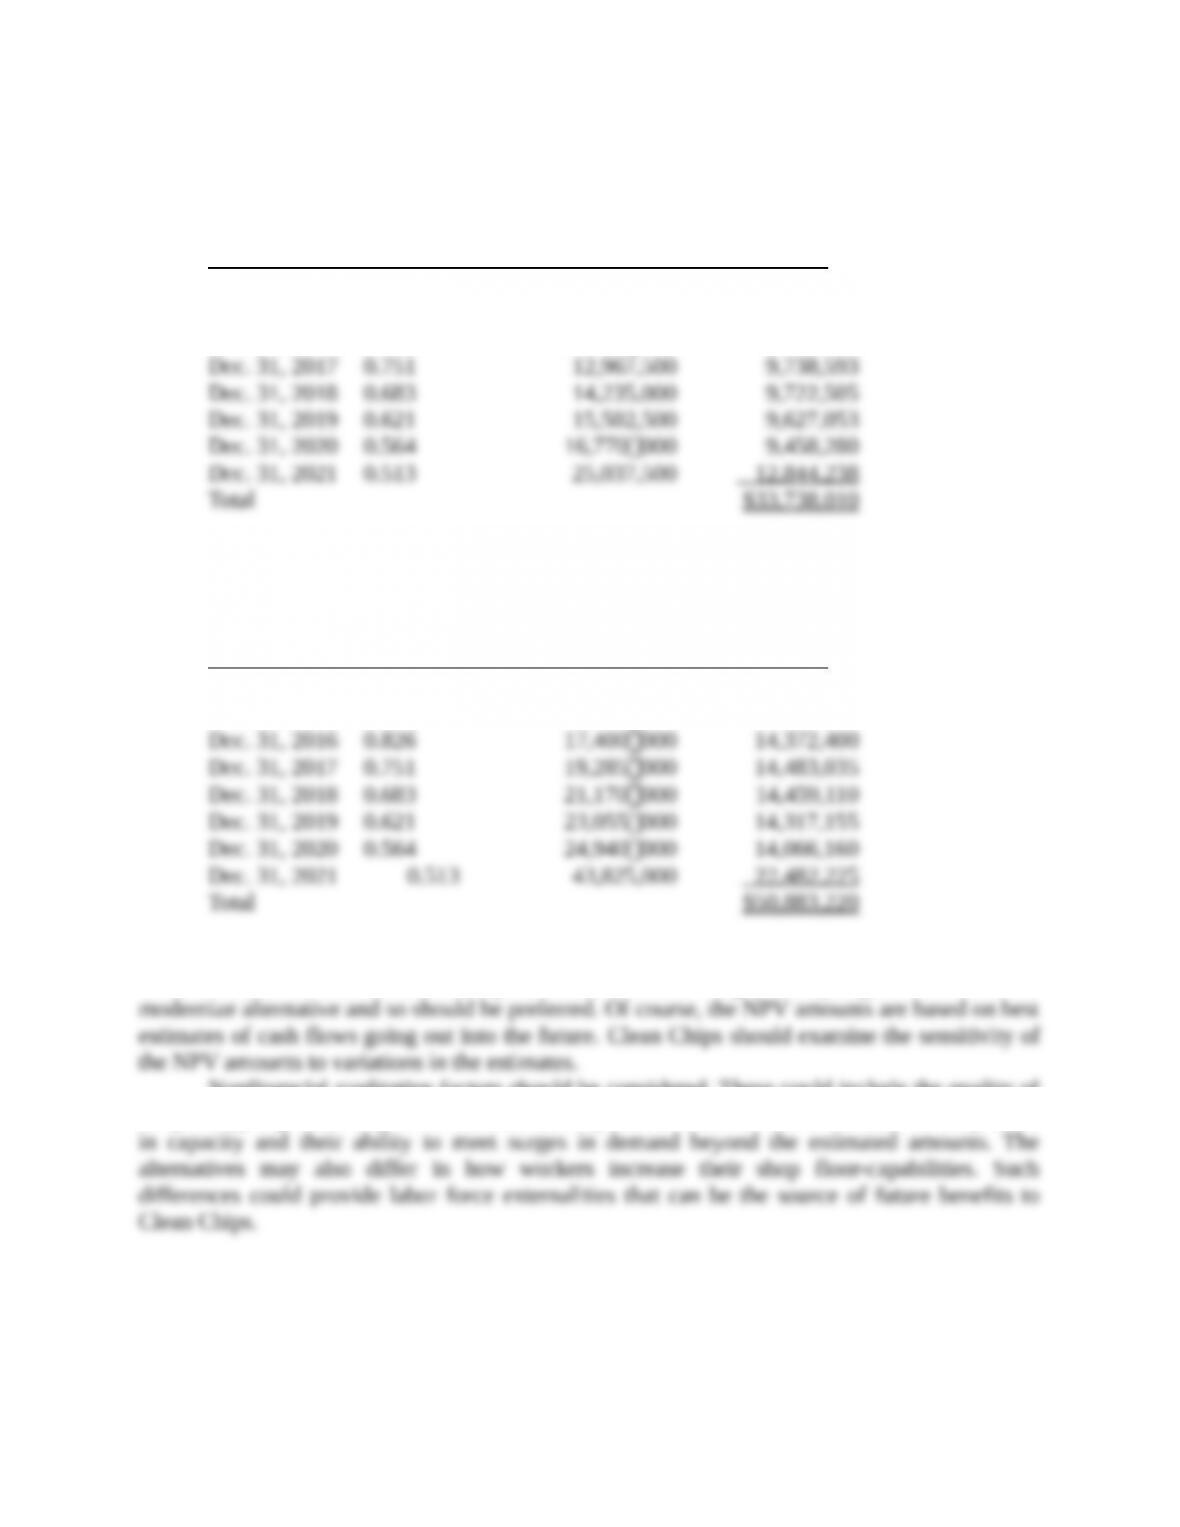
Dec. 31, 2017 0.751 12,967,500 9,738,593
Dec. 31, 2018 0.683 14,235,000 9,722,505
Dec. 31, 2019 0.621 15,502,500 9,627,053
Dec. 31, 2020 0.564 16,770000 9,458,280
Dec. 31, 2021 0.513 25,037,500 12,844,238
Total $33,738,010
Replace Alternative:
Present Value
Discount Factors Net Cash Present
Year At 10% Flow Value
Jan. 1, 2015 1.000 $(57,400000) $(57,400,000)
Dec. 31, 2015 0.909 15,515000 14,103,135
Dec. 31, 2016 0.826 17,400000 14,372,400
Dec. 31, 2017 0.751 19,285000 14,483,035
Dec. 31, 2018 0.683 21,170000 14,459,110
Dec. 31, 2019 0.621 23,055000 14,317,155
Dec. 31, 2020 0.564 24,940000 14,066,160
Dec. 31, 2021 0.513 43,825,000 22,482,225
Total $50,883,220
4. Using the payback period, the modernize alternative is preferred to the replace alternative.
On the other hand, the replace alternative has a significantly higher NPV than the modernize
alternative and so should be preferred. Of course, the NPV amounts are based on best estimates of
cash flows going out into the future. Clean Chips should examine the sensitivity of the NPV
amounts to variations in the estimates.
Nonfinancial qualitative factors should be considered. These could include the quality of
the prototypes produced by the modernize and replace alternatives. These alternatives may differ
in capacity and their ability to meet surges in demand beyond the estimated amounts. The
alternatives may also differ in how workers increase their shop floor-capabilities. Such differences
could provide labor force externalities that can be the source of future benefits to Clean Chips.
21-2
21-30 (40 min.) Equipment replacement, income taxes (continuation of 21-29).
Assume the same facts as in Problem 21-29, except that the plant is located in Austin, Texas. Clean
Chips has no special waiver on income taxes. It pays a 30% tax rate on all income. Proceeds from
sales of equipment above book value are taxed at the same 30% rate.
Required:
1. Sketch the after-tax cash inflows and outflows of the modernize and replace alternatives over
the 2015–2021 period.
2. Calculate the net present value of the modernize and replace alternatives.
3. Suppose Clean Chips is planning to build several more plants. It wants to have the most
advantageous tax position possible. Clean Chips has been approached by Spain, Malaysia, and
Australia to construct plants in their countries. Use the data in Problem 21-29 and this problem
to briefly describe in qualitative terms the income tax features that would be advantageous to
Clean Chips.
SOLUTION
1. & 2. Income tax rate = 30%
Modernize Alternative
Annual depreciation:
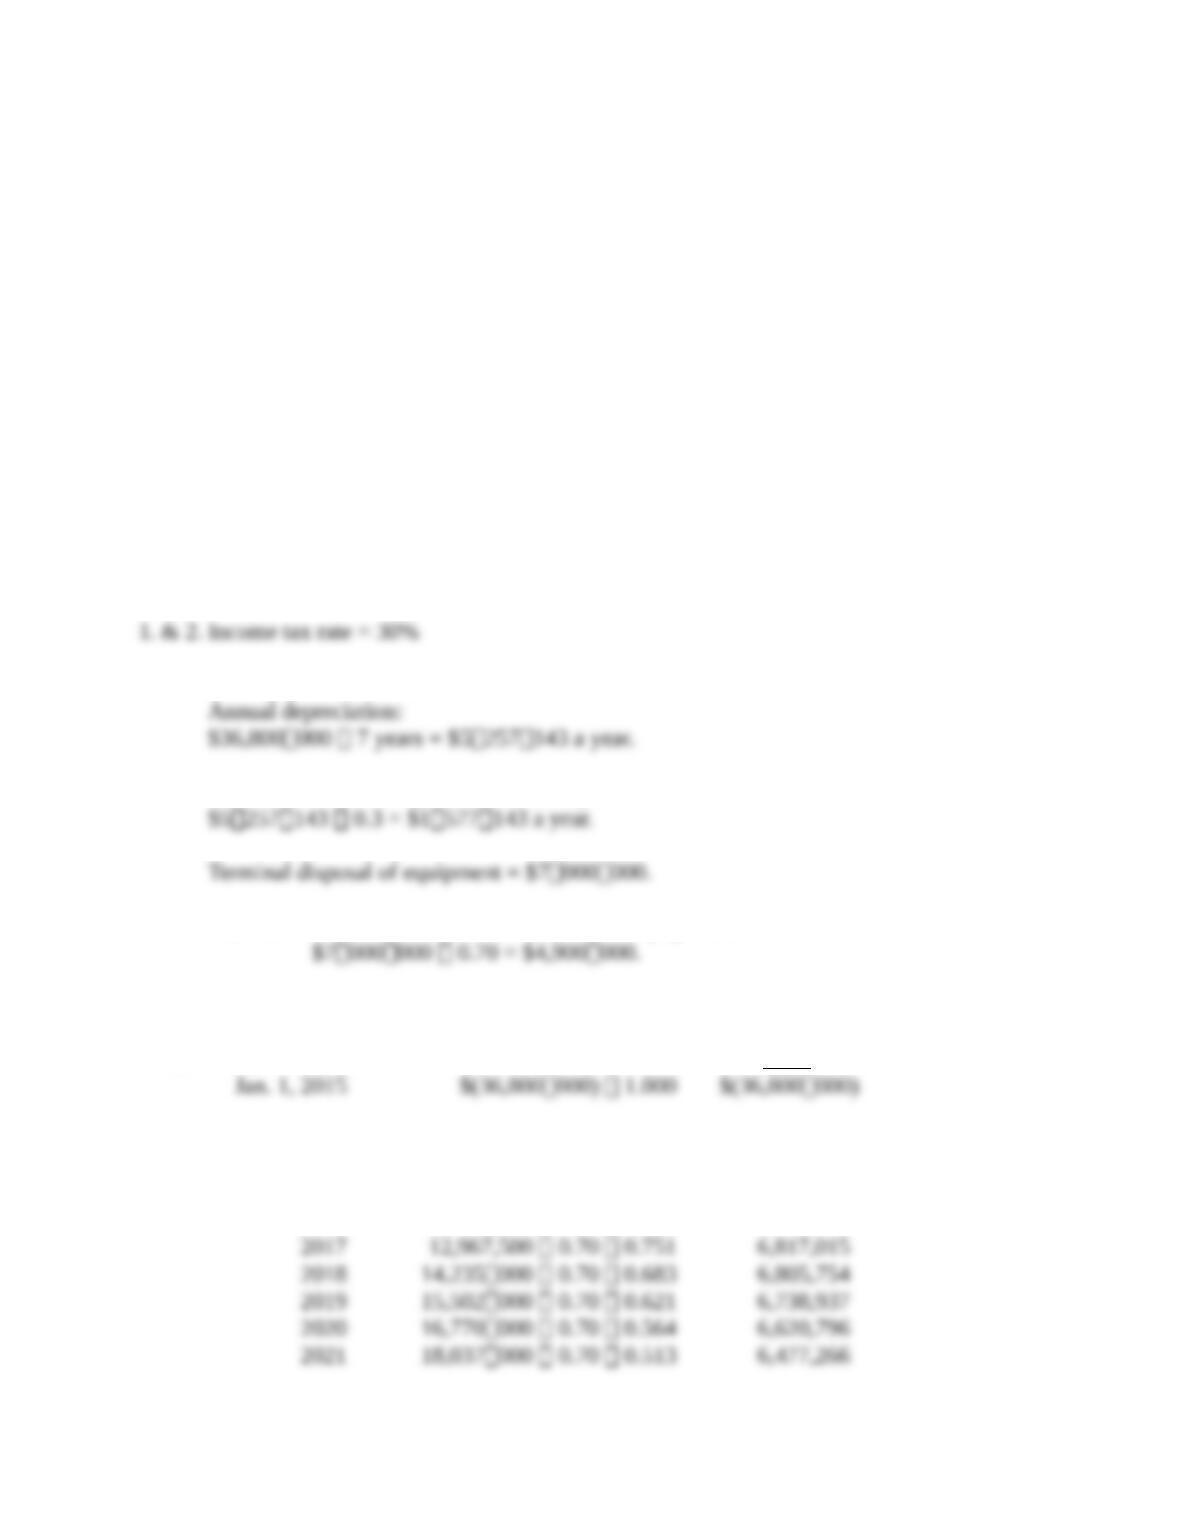
$36,800000 7 years = $5257143 a year.
Income tax cash savings from annual depreciation deductions:
$5257143 0.3 = $1577143 a year.
Terminal disposal of equipment = $7000000.
After-tax cash flow from terminal disposal of equipment:
$7000000 0.70 = $4,900000.
The NPV components are:
a. Initial investment: NPV
Jan. 1, 2015 $(36,800000) 1.000 $(36,800000)
b. Annual after-tax cash flow from operations
(excluding depreciation):
Dec. 31, 2015 10,432500 0.70 0.909 $6,638,200
2016 11,700000 0.70 0.826 6,764,940
2017 12,967,500 0.70 0.751 6,817,015
2018 14,235000 0.70 0.683 6,805,754
2019 15,502000 0.70 0.621 6,738,937
2020 16,770000 0.70 0.564 6,620,796
2021 18,037000 0.70 0.513 6,477,266
21-3
c. Income tax cash savings from annual depreciation
deductions ($1577143 each year for 7 years):
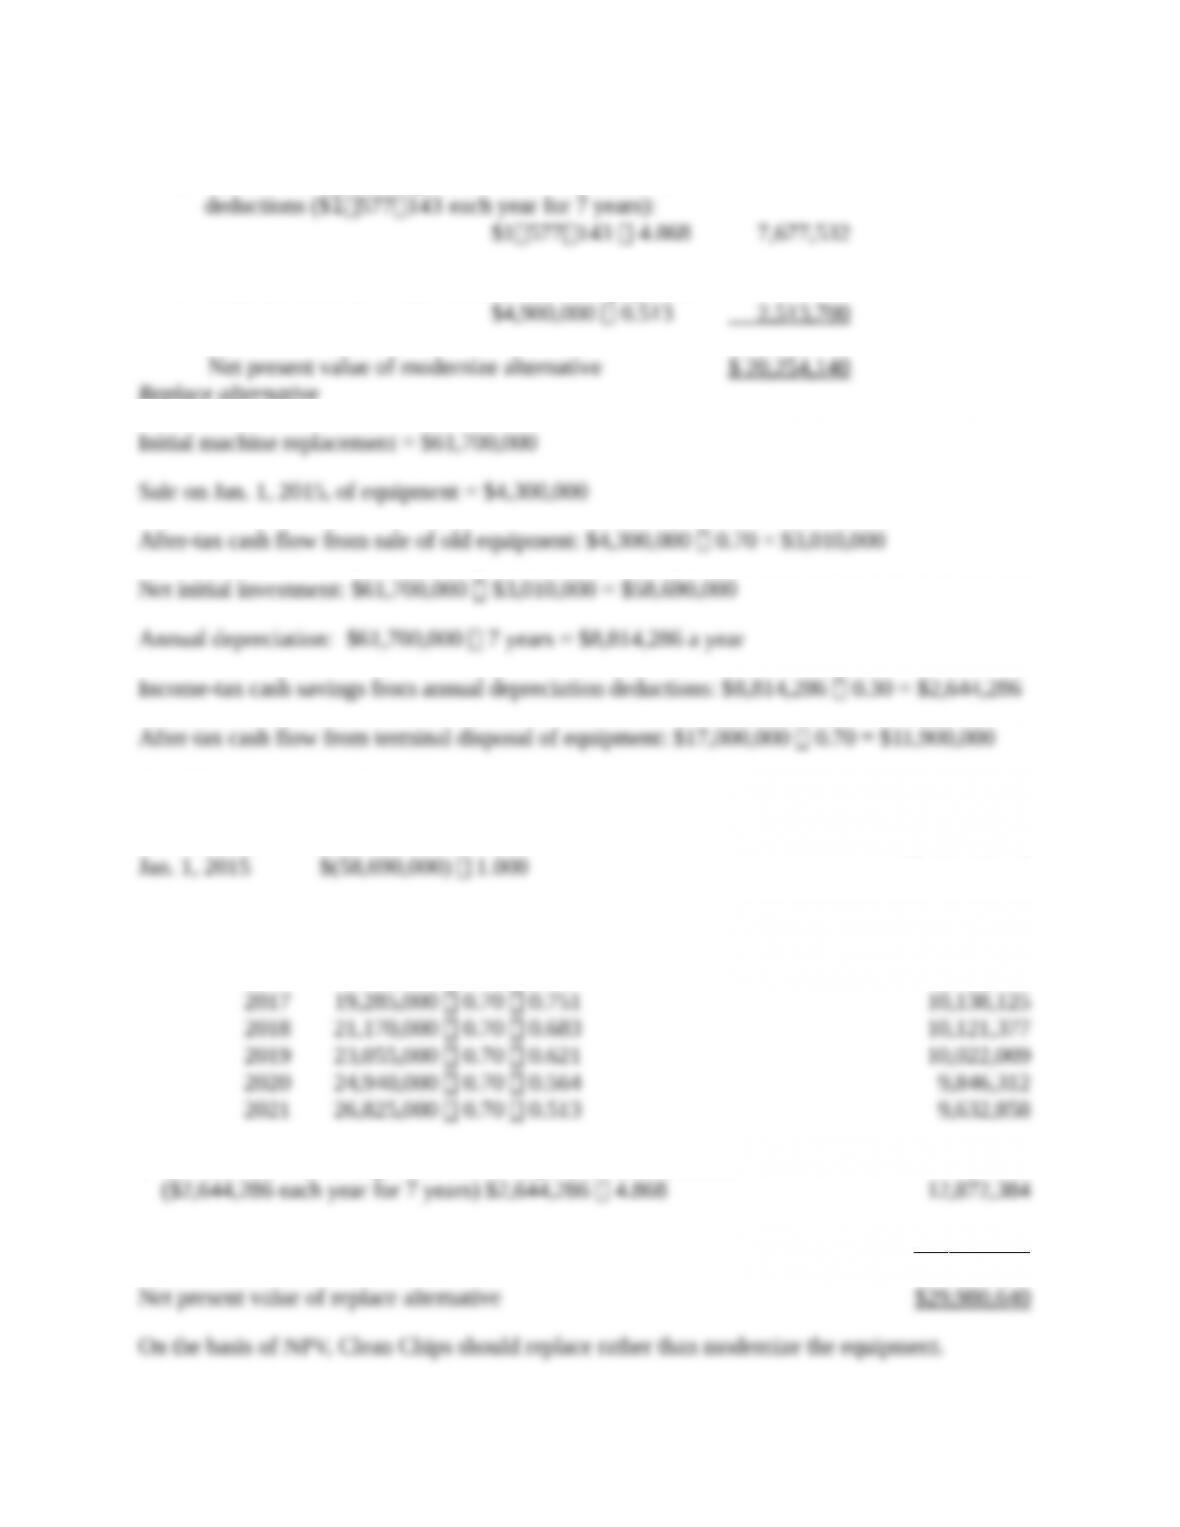
$1577143 4.868 7,677,532
d. After-tax cash flow from terminal sale of equipment:
$4,900,000 0.513 2,513,700
Net present value of modernize alternative $ 20,254,140
Replace alternative
Initial machine replacement = $61,700,000
Sale on Jan. 1, 2015, of equipment = $4,300,000
After-tax cash flow from sale of old equipment: $4,300,000 0.70 = $3,010,000
Net initial investment: $61,700,000 − $3,010,000 = $58,690,000
Annual depreciation: $61,700,000 7 years = $8,814,286 a year
Income-tax cash savings from annual depreciation deductions: $8,814,286 0.30 = $2,644,286
After-tax cash flow from terminal disposal of equipment: $17,000,000 0.70 = $11,900,000
The NPV components of the replace alternative are:
a. Net initial investment
Jan. 1, 2015 $(58,690,000) 1.000
$(58,690,000)
b. Annual after-tax cash flow from operations (excluding depreciation)
Dec. 31,
2015
$15,515,000 0.70 0.909
$ 9,872,195
2016
17,400,000 0.70 0.826
10,060,680
2017
19,285,000 0.70 0.751
10,138,125
2018
21,170,000 0.70 0.683
10,121,377
2019
23,055,000 0.70 0.621
10,022,009
2020
24,940,000 0.70 0.564
9,846,312
2021
26,825,000 0.70 0.513
9,632,858
c. Income tax cash savings from annual depreciation deductions
($2,644,286 each year for 7 years) $2,644,286 4.868
12,872,384
d. After-tax cash flow from terminal sale of equipment, $11,900,000 0.513
6,104,700
Net present value of replace alternative
$29,980,640
On the basis of NPV, Clean Chips should replace rather than modernize the equipment.
21-4
3. Clean Chips would prefer to:
a. have lower tax rates,
b. have revenue exempt from taxation,
c. recognize taxable revenues in later years rather than earlier years,
d. recognize taxable cost deductions greater than actual outlay costs, and
e. recognize cost deductions in earlier years rather than later years (including
accelerated amounts in earlier years).
21-31 (20 min.) DCF, sensitivity analysis, no income taxes.
(CMA, adapted) Invigor Corporation is an international manufacturer of fragrances for women.
Management at Invigor is considering expanding the product line to men’s fragrances. From the
best estimates of the marketing and production managers, annual sales (all for cash) for this new
line are 1,200,000 units at $50 per unit; cash variable cost is $20 per unit; and cash fixed costs are
$8,000,000 per year. The investment project requires $70,000,000 of cash outflow and has a
project life of 8 years.
At the end of the 8-year useful life, there will be no terminal disposal value. Assume all cash
flows occur at year-end except for initial investment amounts.
Men’s fragrance is a new market for Invigor, and management is concerned about the reliability
of the estimates. The controller has proposed applying sensitivity analysis to selected factors.
Ignore income taxes in your computations. Invigor’s required rate of return on this project is 12%.
Required:
1. Calculate the net present value of this investment proposal.
2. Calculate the effect on the net present value of the following two changes in assumptions.
(Treat each item independently of the other.)
a. 10% reduction in the selling price
b. 10% increase in the variable cost per unit
3. Discuss how management would use the data developed in requirements 1 and 2 in its
consideration of the proposed capital investment.
SOLUTION
The present value of an annuity of $1 per year for 8 years discounted at 12% = 4.968.
1. Revenues, $50 × 1,200,000 $60,000,000
Variable cash costs, $20 × 1,200,000 24,000,000
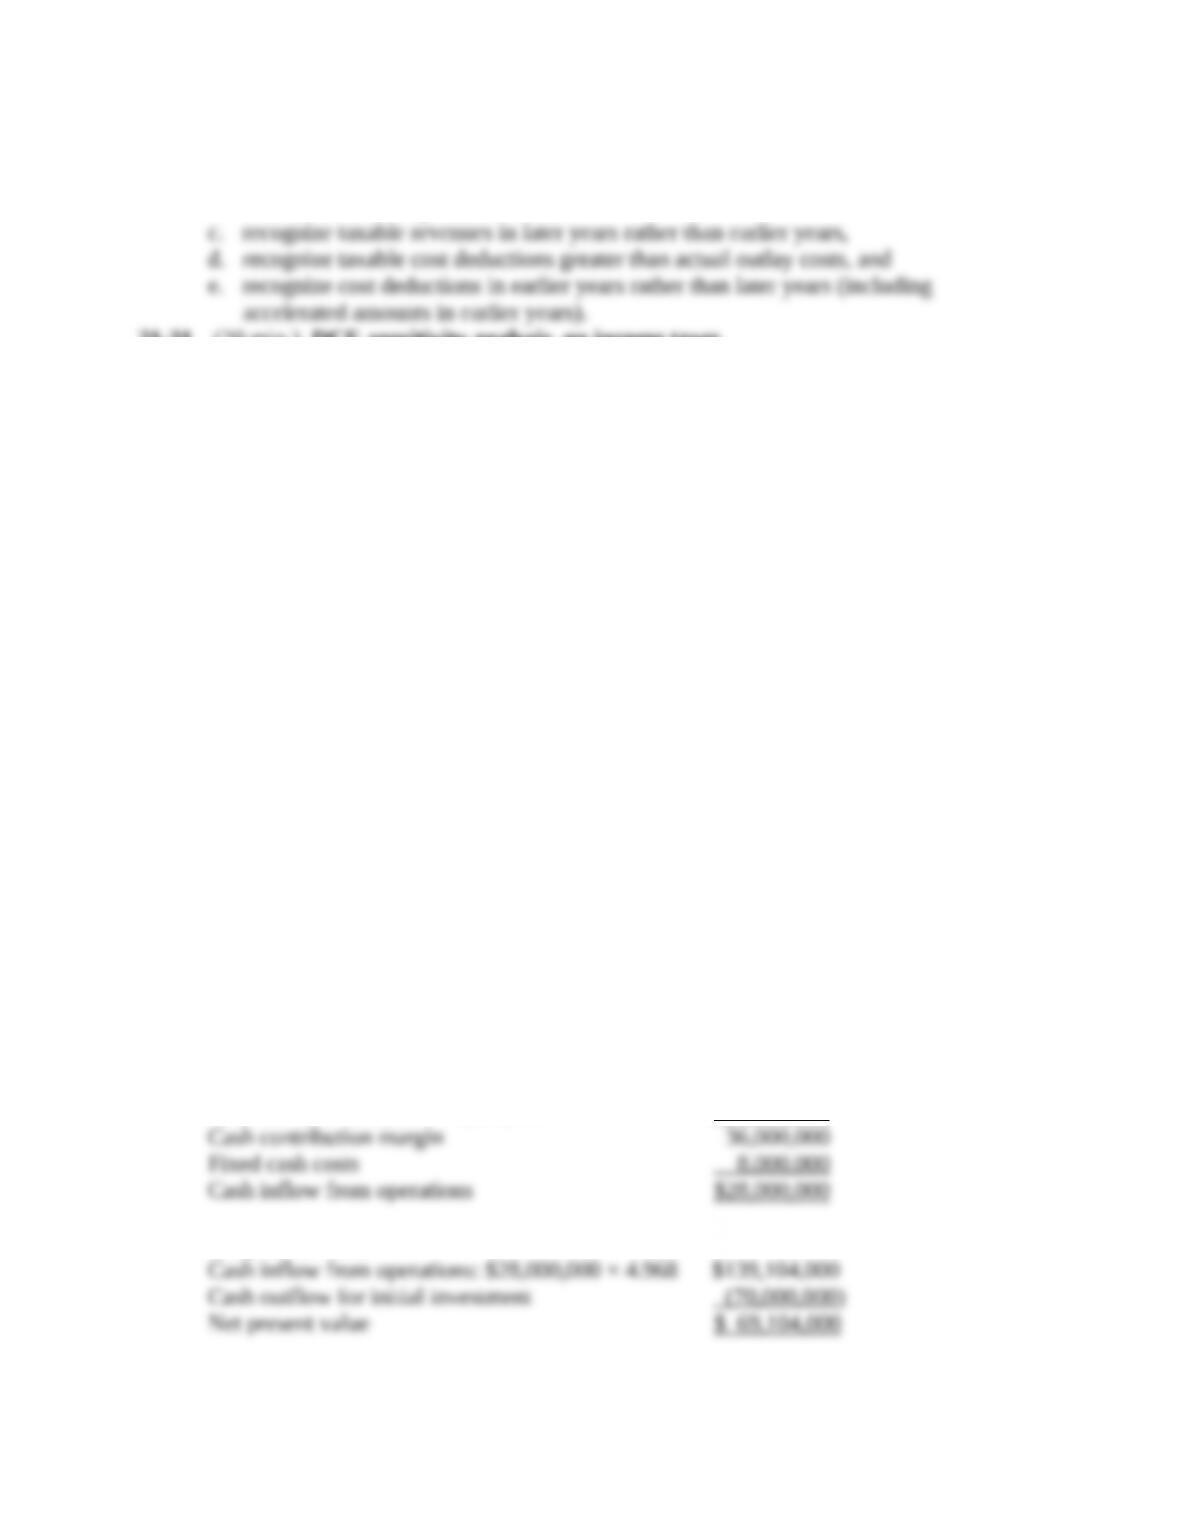
Cash contribution margin 36,000,000
Fixed cash costs 8,000,000
Cash inflow from operations $28,000,000
Net present value:
Cash inflow from operations: $28,000,000 × 4.968 $139,104,000
Cash outflow for initial investment (70,000,000)
Net present value $ 69,104,000
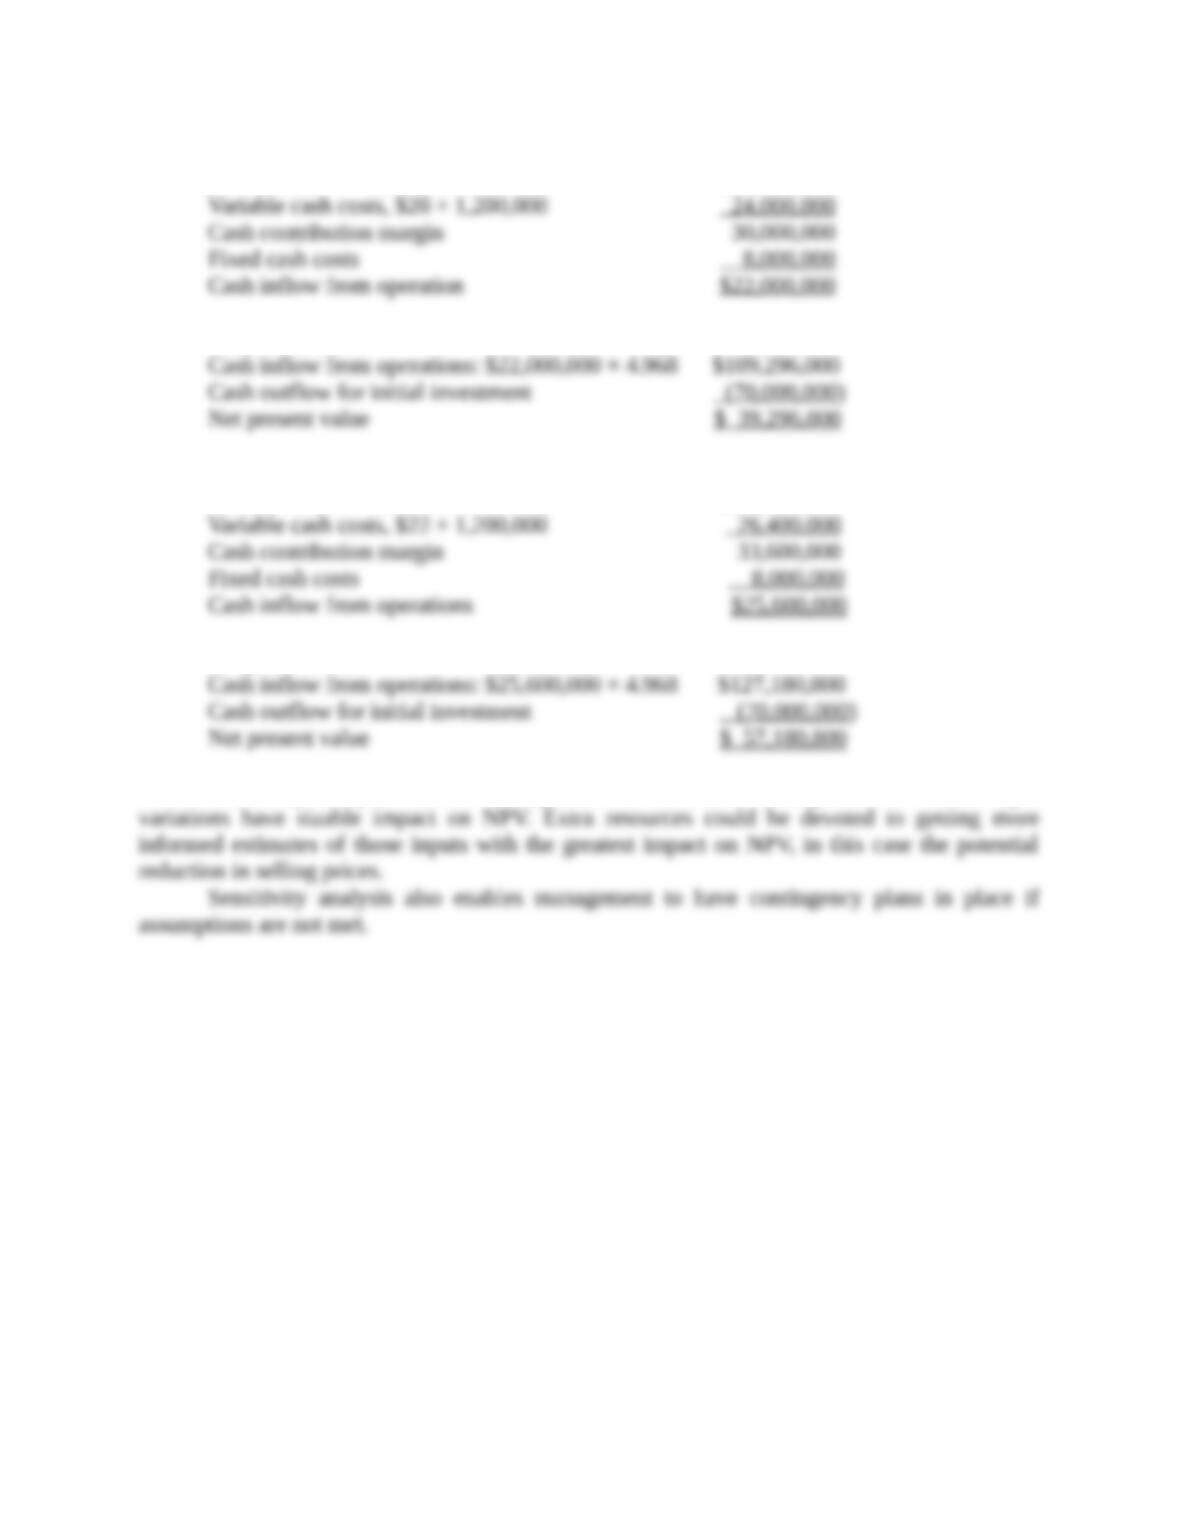
2a. 10% reduction in selling prices:
21-5
Revenues, $45 × 1,200,000 $54,000,000
Variable cash costs, $20 × 1,200,000 24,000,000
Cash contribution margin 30,000,000
Fixed cash costs 8,000,000
Cash inflow from operation $22,000,000
Net present value:
Cash inflow from operations: $22,000,000 × 4.968 $109,296,000
Cash outflow for initial investment (70,000,000)
Net present value $ 39,296,000
b. 10% increase in the variable cost per unit:
Revenues, $50 × 1,200,000 $60,000,000
Variable cash costs, $22 × 1,200,000 26,400,000
Cash contribution margin 33,600,000
Fixed cash costs 8,000,000
Cash inflow from operations $25,600,000
Net present value:
Cash inflow from operations: $25,600,000 × 4.968 $127,180,800
Cash outflow for initial investment (70,000,000)
Net present value $ 57,180,800
3. Sensitivity analysis enables management to see those assumptions for which input
variations have sizable impact on NPV. Extra resources could be devoted to getting more informed
estimates of those inputs with the greatest impact on NPV, in this case the potential reduction in
selling prices.
Sensitivity analysis also enables management to have contingency plans in place if
assumptions are not met.
21-32 (30–35 min.) NPV and AARR, goal-congruence issues.
Eric Ishton, a manager of the Plate Division for the Stone Ware Manufacturing company, has the
opportunity to expand the division by investing in additional machinery costing $430,000. He
would depreciate the equipment using the straight-line method and expects it to have no residual
value. It has a useful life of 8 years. The firm mandates a required after-tax rate of return of 12%
on investments. Eric estimates annual net cash inflows for this investment of $110,000 before taxes
and an investment in working capital of $7,500. The tax rate is 30%.
Required:
1. Calculate the net present value of this investment.
2. Calculate the accrual accounting rate of return based on net initial investment for this project.
3. Should Eric accept the project? Will Eric accept the project if his bonus depends on achieving
an accrual accounting rate of return of 12%? How can this conflict be resolved?
SOLUTION
21-6
1.
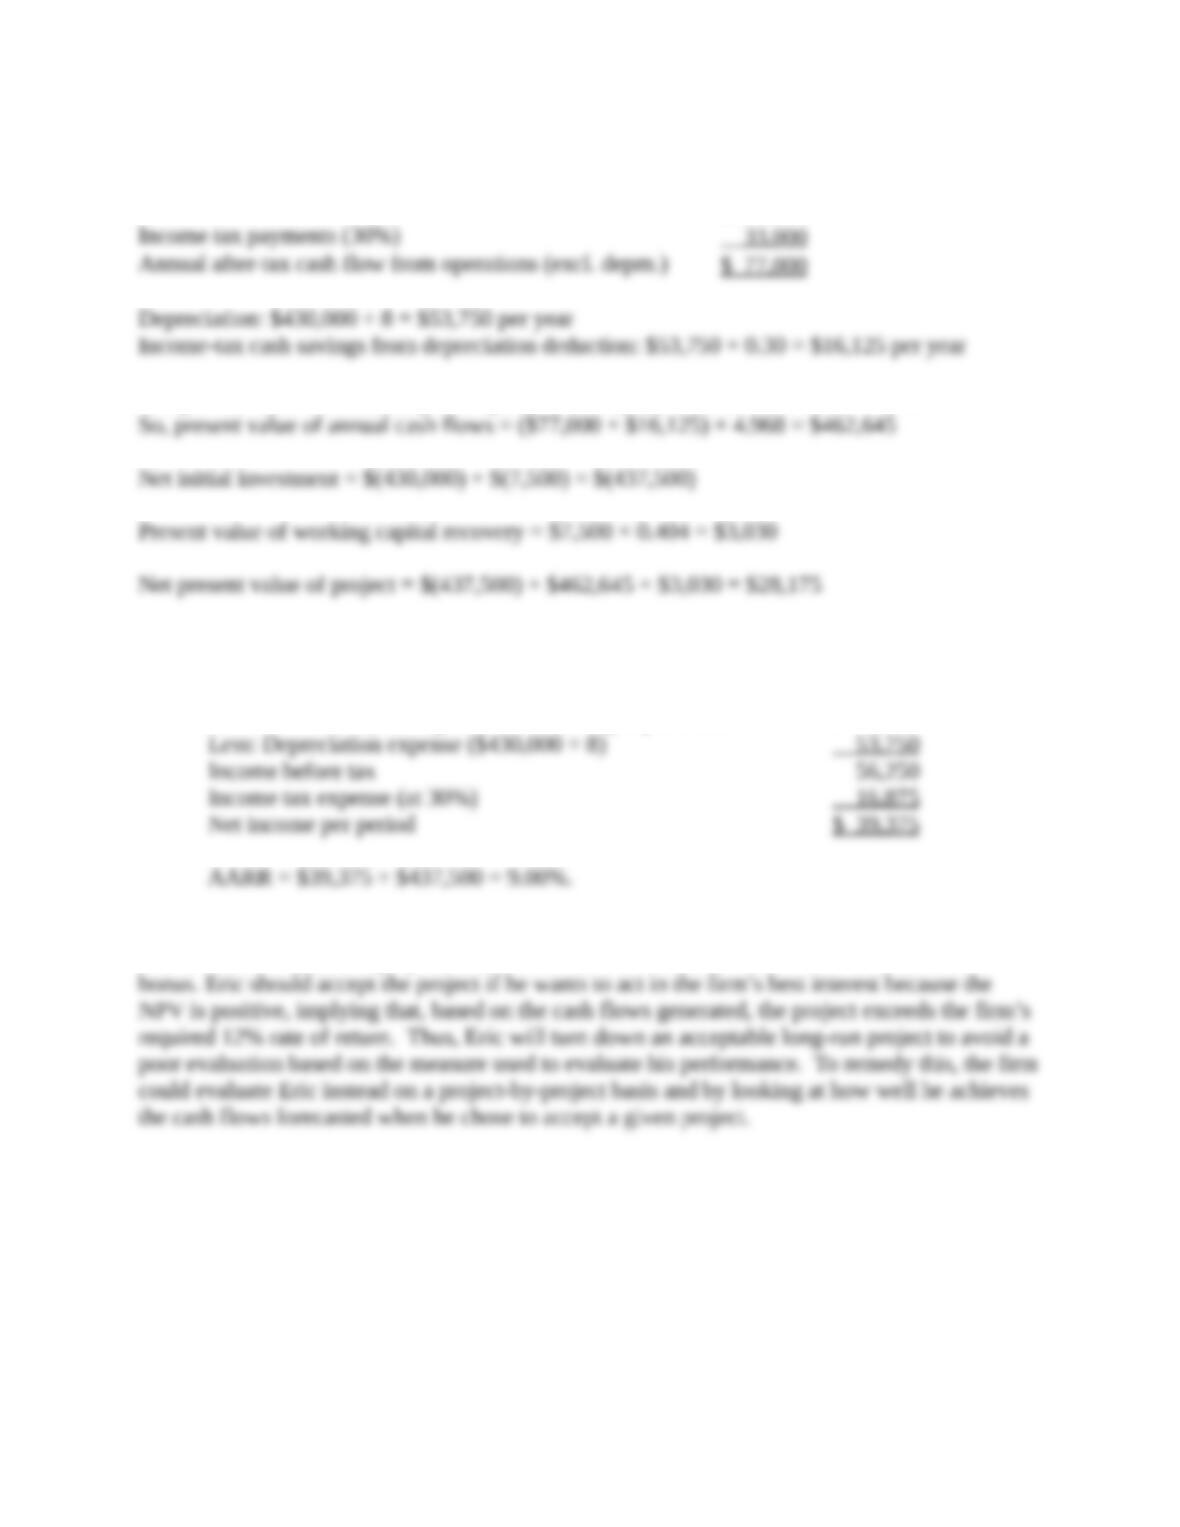
Annual cash flow from operations
$110,000
Income tax payments (30%)
33,000
Annual after-tax cash flow from operations (excl. deprn.)
$ 77,000
Depreciation: $430,000 ÷ 8 = $53,750 per year
Income-tax cash savings from depreciation deduction: $53,750 × 0.30 = $16,125 per year
The present value of an annuity of $1 per year for 8 years discounted at 12% = 4.968.
So, present value of annual cash flows = ($77,000 + $16,125) × 4.968 = $462,645
Net initial investment = $(430,000) + $(7,500) = $(437,500)
Present value of working capital recovery = $7,500 × 0.404 = $3,030
Net present value of project = $(437,500) + $462,645 + $3,030 = $28,175
2. Accrual accounting rate of return (AARR): The accrual accounting rate of return takes
the annual accrual net income after tax and divides by the initial investment to get a return.
Incremental net operating income excluding depreciation $110,000
Less: Depreciation expense ($430,000 ÷ 8) 53,750
Income before tax 56,250
Income tax expense (at 30%) 16,875
Net income per period $ 39,375
AARR = $39,375 ÷ $437,500 = 9.00%.
3. Eric will not accept the project if he is being evaluated on the basis of accrual accounting
rate of return because the project does not meet the 12% threshold above which Eric earns a
bonus. Eric should accept the project if he wants to act in the firm’s best interest because the
NPV is positive, implying that, based on the cash flows generated, the project exceeds the firm’s
required 12% rate of return. Thus, Eric will turn down an acceptable long-run project to avoid a
poor evaluation based on the measure used to evaluate his performance. To remedy this, the firm
could evaluate Eric instead on a project-by-project basis and by looking at how well he achieves
the cash flows forecasted when he chose to accept a given project.
21-33 (30 min.) Payback methods, even and uneven cash flows.
Cardinal Laundromat is trying to enhance the services it provides to customers, mostly college
students. It is looking into the purchase of new high- efficiency washing machines that will allow
for the laundry’s status to be checked via smartphone.
Cardinal estimates the cost of the new equipment at $186,000. The equipment has a useful life
of 9 years. Cardinal expects cash fixed costs of $82,000 per year to operate the new machines, as
well as cash variable costs in the amount of 5% of revenues. Cardinal evaluates investments using
a cost of capital of 6%.
Required:
1. Calculate the payback period and the discounted payback period for this investment, assuming
Cardinal expects to generate $180,000 in revenues every year from the new machines.
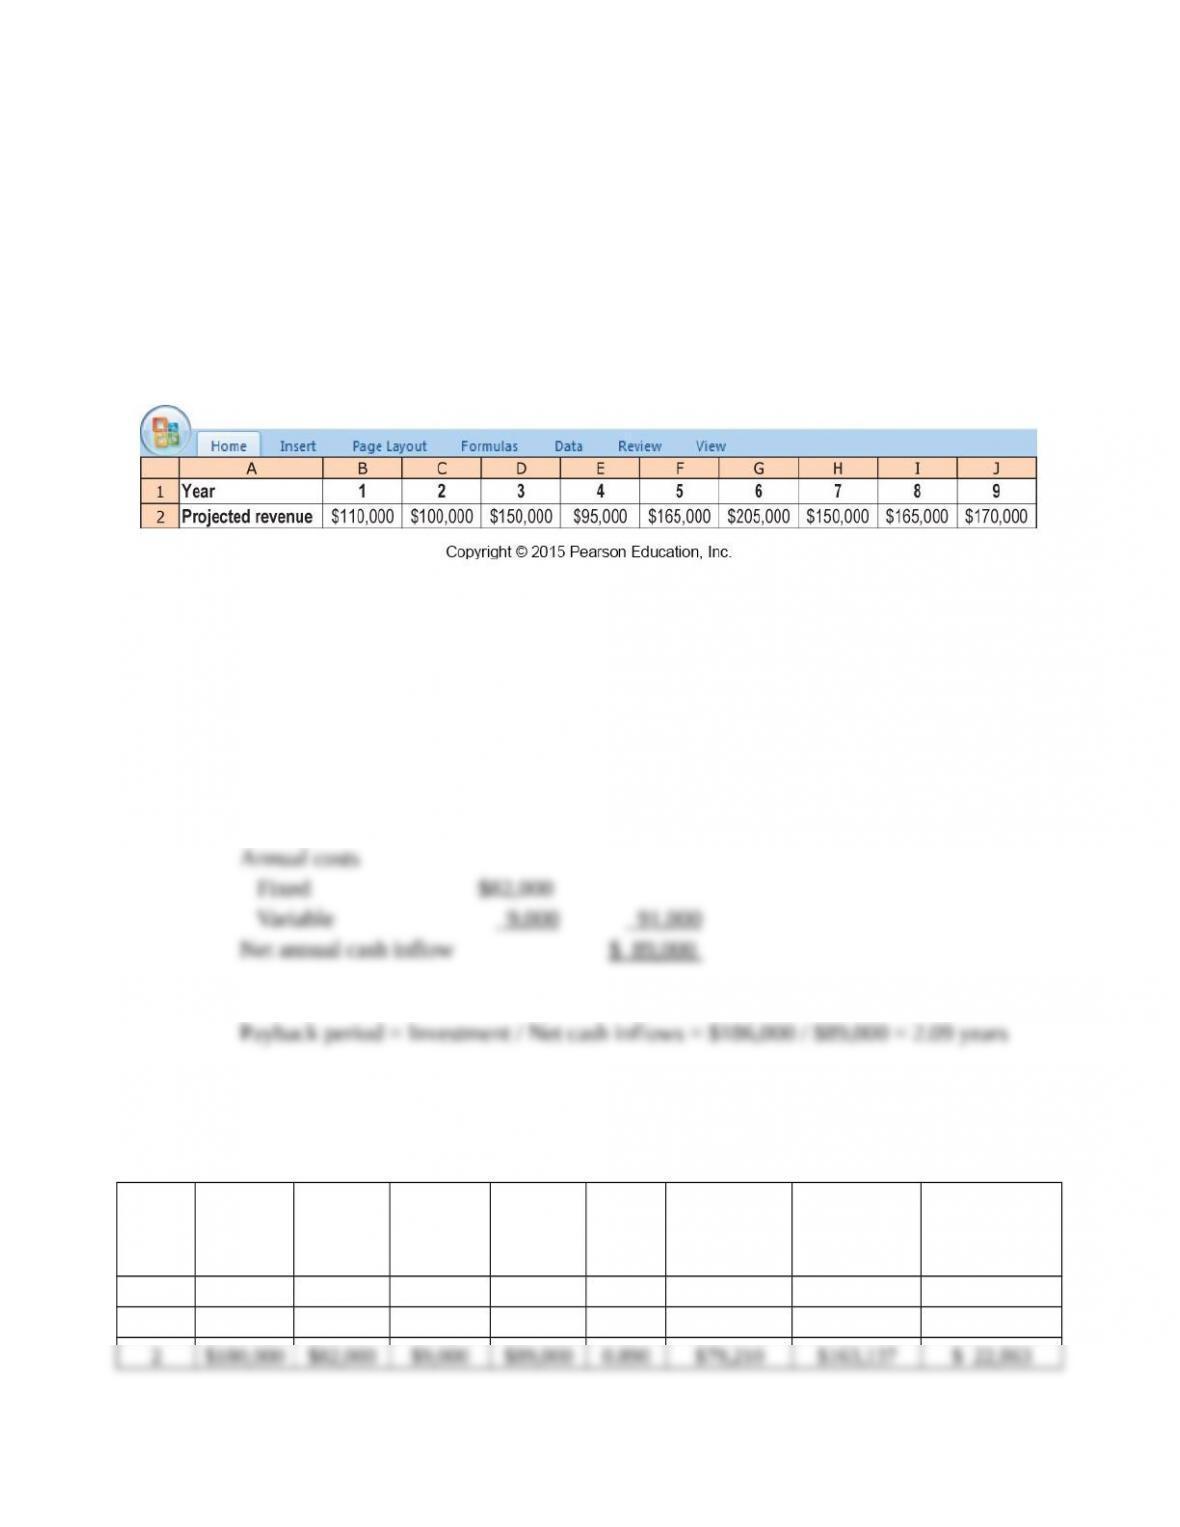
2. Assume instead that Cardinal expects the following uneven stream of cash revenues from
installing the new washing machines:
Based on this estimated revenue stream, what are the payback and discounted payback periods for
the investment?
SOLUTION
Payback problem:
1.
Annual revenue
$180,000
Annual costs
Fixed
$82,000
Variable
9,000
91,000
Net annual cash inflow
$ 89,000
Payback period = Investment / Net cash inflows = $186,000 / $89,000 = 2.09 years
Discounted Payback Period with even cash flows:
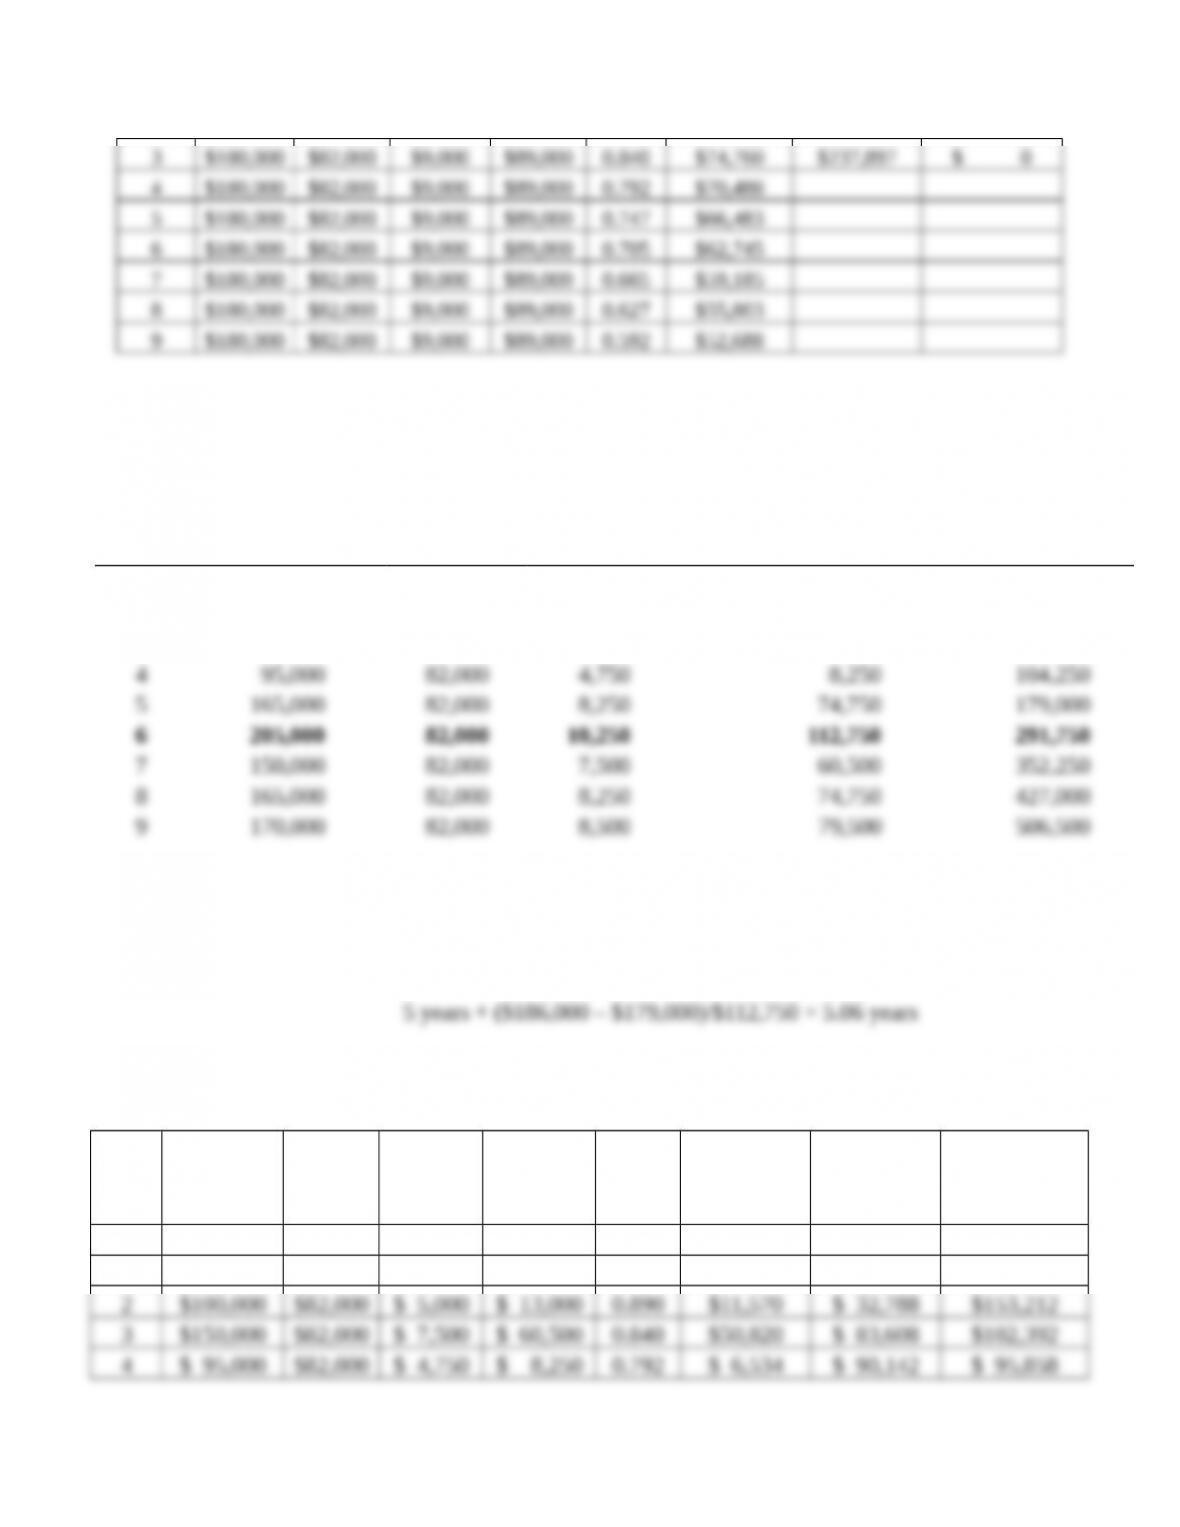
$22,863/$74,760 = 0.31
Discounted Payback Period = 2.31 years
2.
Year
Revenue
(1)
Cash Fixed
Costs
(2)
Cash
Variable Costs
(3)
Net Cash Inflows
(4) = (1) − (2) − (3)
Cumulative
Amounts
1
$110,000
$ 82,000
$ 5,500
$ 22,500
$ 22,500
2
100,000
82,000
5,000
13,000
35,500
3
150,000
82,000
7,500
60,500
96,000
4
95,000
82,000
4,750
8,250
104,250
5
165,000
82,000
8,250
74,750
179,000
6
205,000
82,000
10,250
112,750
291,750
7
150,000
82,000
7,500
60,500
352,250
8
165,000
82,000
8,250
74,750
427,000
9
170,000
82,000
8,500
79,500
506,500
The cumulative amount exceeds the initial $186,000 investment for the first time at the end of year
6. So, payback happens in year 6.
Using linear interpolation, a more precise measure is that payback happens at:
5 years + ($186,000 – $179,000)/$112,750 = 5.06 years
Discounted Payback Period with uneven cash flows:
Period
Year
Cash
Revenues
Fixed
Costs
Variable
Costs
Net Cash
Inflows
Disc
Factor
(6%)
Discounted
Cash Savings
Cumulative
Disc. Cash
Savings
Unrecovered
Investment
0
$186,000
1
$180,000
$82,000
$9,000
$89,000
0.943
$83,927
$ 83,927
$102,073
2
$180,000
$82,000
$9,000
$89,000
0.890
$79,210
$163,137
$ 22,863
3
$180,000
$82,000
$9,000
$89,000
0.840
$74,760
$237,897
$ 0
4
$180,000
$82,000
$9,000
$89,000
0.792
$70,488
5
$180,000
$82,000
$9,000
$89,000
0.747
$66,483
6
$180,000
$82,000
$9,000
$89,000
0.705
$62,745
7
$180,000
$82,000
$9,000
$89,000
0.665
$59,185
8
$180,000
$82,000
$9,000
$89,000
0.627
$55,803
9
$180,000
$82,000
$9,000
$89,000
0.592
$52,688
21-9
Year
Cash
Revenues
Fixed
Costs
Variable
Costs
Net Cash
Inflows
Disc
Factor
(6%)
Discounted
Cash
Savings
Cumulative
Disc. Cash
Savings
Unrecovered
Investment
0
$186,000
1
$110,000
$82,000
$ 5,500
$ 22,500
0.943
$21,218
$ 21,218
$164,782
2
$100,000
$82,000
$ 5,000
$ 13,000
0.890
$11,570
$ 32,788
$153,212
3
$150,000
$82,000
$ 7,500
$ 60,500
0.840
$50,820
$ 83,608
$102,392
4
$ 95,000
$82,000
$ 4,750
$ 8,250
0.792
$ 6,534
$ 90,142
$ 95,858
5
$165,000
$82,000
$ 8,250
$ 74,750
0.747
$55,838
$145,980
$ 40,020
6
$205,000
$82,000
$10,250
$112,750
0.705
$79,489
$225,469
$ 0
7
$150,000
$82,000
$ 7,500
$ 60,500
0.665
$40,233
$265,702
8
$165,000
$82,000
$ 8,250
$ 74,750
0.627
$46,868
$312,570
9
$170,000
$82,000
$ 8,500
$ 79,500
0.592
$47,064
$359,634
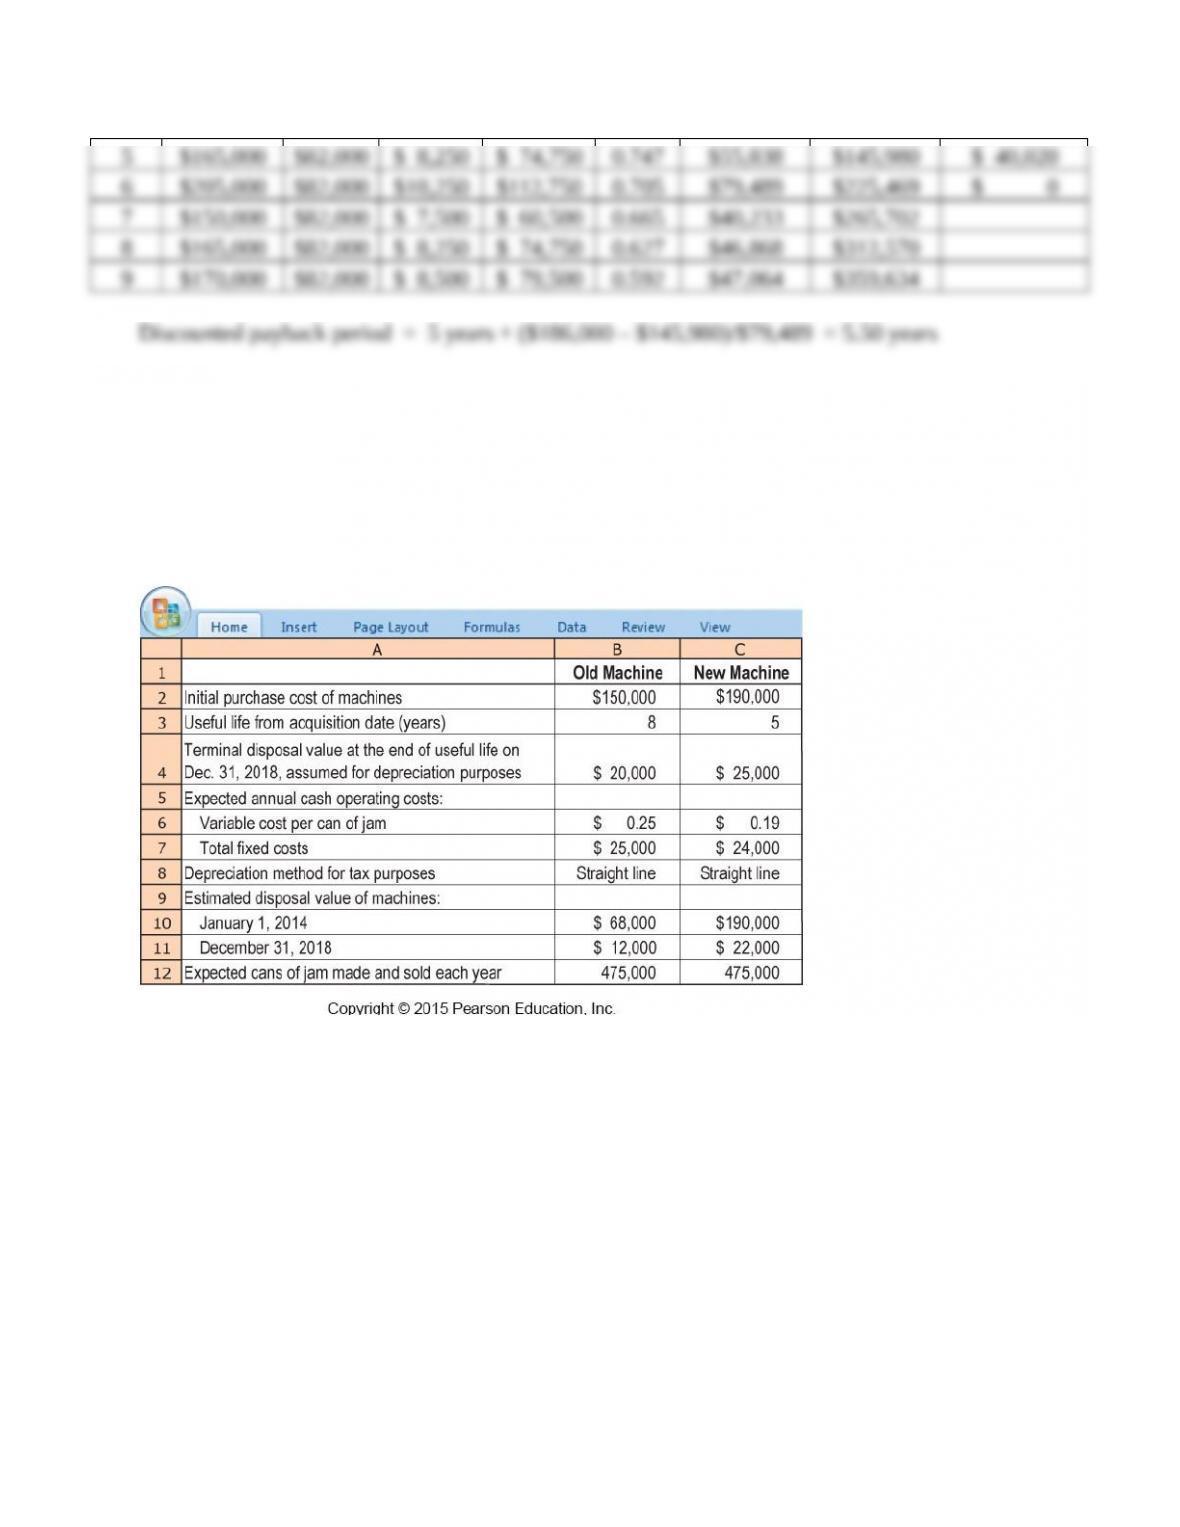
Discounted payback period = 5 years + ($186,000 – $145,980)/$79,489 = 5.50 years
21-34 (40 min.) Replacement of a machine, income taxes, sensitivity.
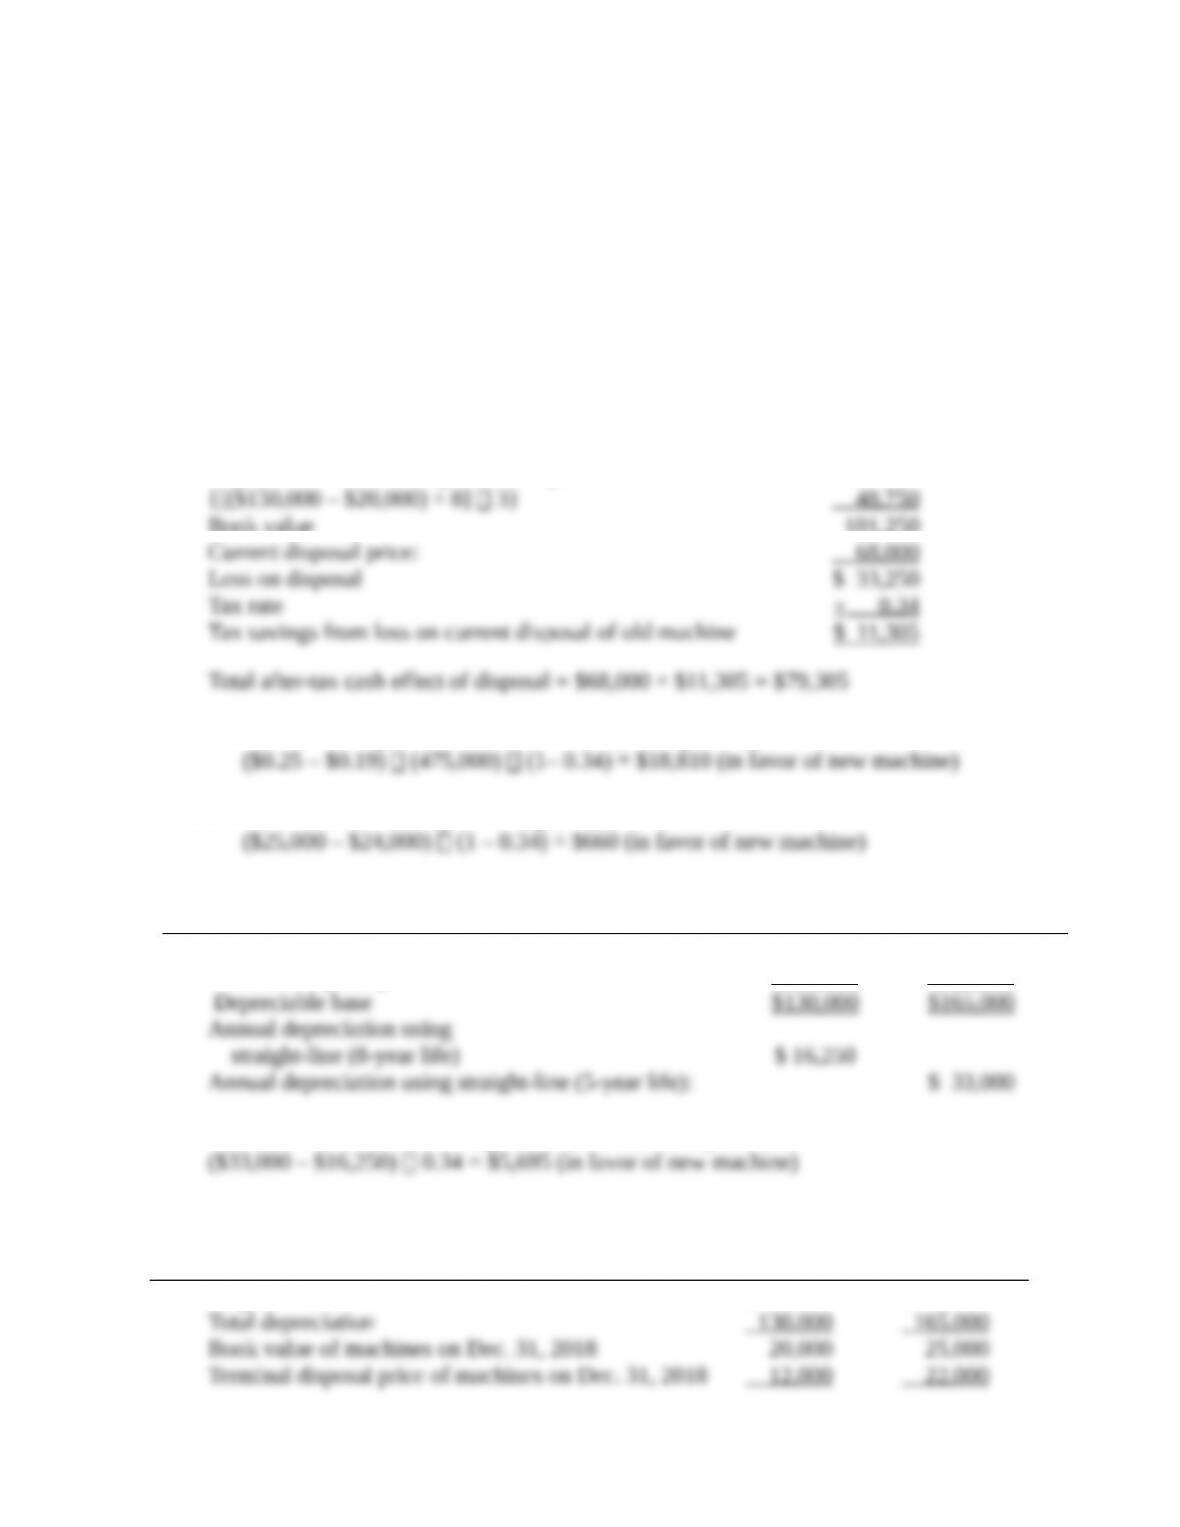
(CMA, adapted) The Frooty Company is a family-owned business that produces fruit jam. The
company has a grinding machine that has been in use for 3 years. On January 1, 2014, Frooty is
considering the purchase of a new grinding machine. Frooty has two options: (1) continue using
the old machine or (2) sell the old machine and purchase a new machine. The seller of the new
machine isn’t offering a trade-in. The following information has been obtained:
A
Frooty is subject to a 34% income tax rate. Assume that any gain or loss on the sale of machines
is treated as an ordinary tax item and will affect the taxes paid by Frooty in the year in which it
21-10
occurs. Frooty’s after-tax required rate of return is 12%. Assume all cash flows occur at year-end
except for initial investment amounts.
Required:
1. A manager at Frooty asks you whether it should buy the new machine. To help in your analysis,
calculate the following:
a. One-time after-tax cash effect of disposing of the old machine on January 1, 2014
b. Annual recurring after-tax cash operating savings from using the new machine (variable
and fixed)
c. Cash tax savings due to differences in annual depreciation of the old machine and the new
machine
d. Difference in after-tax cash flow from terminal disposal of new machine and old machine
2. Use your calculations in requirement 1 and the net present value method to determine whether
Frooty should use the old machine or acquire the new machine.
3. How much more or less would the recurring after-tax cash operating savings of the new
machine need to be for Frooty to earn exactly the 12% after-tax required rate of return? Assume
that all other data about the investment do not change.
SOLUTION
1a. Original cost of old machine: $150,000
Depreciation taken during the first 3 years
{[($150,000 – $20,000) ÷ 8] 3} 48,750
Book value 101,250
Current disposal price: 68,000
Loss on disposal $ 33,250
Tax rate × 0.34
Tax savings from loss on current disposal of old machine $ 11,305
Total after-tax cash effect of disposal = $68,000 + $11,305 = $79,305
1b. Difference in recurring after-tax variable cash-operating savings, with 34% tax rate:
($0.25 – $0.19) (475,000) (1– 0.34) = $18,810 (in favor of new machine)
Difference in after-tax fixed cost savings, with 34% tax rate:
($25,000 – $24,000) (1 – 0.34) = $660 (in favor of new machine)
1c.
Old Machine
New Machine
Initial machine investment $150,000 $190,000
Terminal disposal price at end of useful life 20,000 25,000
Depreciable base $130,000 $165,000
Annual depreciation using
straight-line (8-year life) $ 16,250
Annual depreciation using straight-line (5-year life): $ 33,000

21-11
Annual income tax cash savings from difference in depreciation deduction:
($33,000 – $16,250) 0.34 = $5,695 (in favor of new machine)
1d.
Old Machine
New Machine
Original cost $150,000 $190,000
Total depreciation 130,000 165,000
Book value of machines on Dec. 31, 2018 20,000 25,000
Terminal disposal price of machines on Dec. 31, 2018 12,000 22,000
Loss on disposal of machines 8,000 3,000
Add tax savings on loss (34% of $8,000; 34% of $3,000) 2,720 1,020
After-tax cash flow from terminal disposal of
machines ($12,000 + $2,720; $22,000 + $1,020) $ 14,720 $ 23,020