Unlock document.
This document is partially blurred.
Unlock all pages and 1 million more documents.
Get Access
19-
1
CHAPTER 19
BALANCED SCORECARD:
QUALITY, TIME, AND THE THEORY OF CONSTRAINTS
19-1 Quality costs (including the opportunity cost of lost sales because of poor quality) can be
as much as 10% to 20% of sales revenues of many organizations. Quality-improvement programs
can result in substantial cost savings and higher revenues and market share from increased
customer satisfaction.
19-2 Design quality refers to how closely the characteristics of a product or service meet the
needs and wants of customers. Conformance quality refers to the performance of a product or
service relative to its design and product specifications.
19-3 Exhibit 19-1 of the text lists the following six line items in the prevention costs category:
design engineering; process engineering; supplier evaluations; preventive equipment maintenance;
quality training; and testing of new materials.
lists the following three examples of appraisal costs: inspection; online product manufacturing and
process inspection; and product testing.
19-5 An internal failure cost differs from an external failure cost on the basis of when the
nonconforming product is detected. Internal failure costs are costs incurred on a defective product
before a product is shipped to a customer, whereas external failure costs are costs incurred on a
defective product after a product is shipped to a customer.
19-6 Three methods that companies use to identify quality problems are (a) a control chart,
which is a graph of a series of successive observations of a particular step, procedure, or operation
taken at regular intervals of time; (b) a Pareto diagram, which is a chart that indicates how
frequently each type of failure (defect) occurs, ordered from the most frequent to the least frequent;
and (c) a cause-and-effect diagram, which helps identify potential causes of defects using a
diagram that resembles the bone structure of a fish.
19-6 No, companies should emphasize financial as well as nonfinancial measures of quality,
such as yield and defect rates. Nonfinancial measures are not directly linked to bottom-line
performance, but they indicate and direct attention to the specific areas that need improvement to
improve the bottom line. Tracking nonfinancial measures over time directly reveals whether these
areas have, in fact, improved over time. Nonfinancial measures are easy to quantify and easy to
understand.
19-7 No. It is true that an important advantage of financial measures of quality is that they can
be linked to bottom-line performance, but nonfinancial measures, such as number of defects,
customer satisfaction, and employee satisfaction, have several advantages as well. They are easier
for employees to understand; they direct attention to physical processes that help managers identify
precise problem areas in need of improvement; they provide short-run feedback on whether
19-
2
quality-improvement efforts are succeeding; and they are useful indicators of long-run
performance.
19-8 Examples of nonfinancial measures of customer satisfaction relating to quality include the
following:
1. the number of defective units shipped to customers as a percentage of total units of product
shipped;
2. the number of customer complaints;
3. delivery delays (the difference between the scheduled delivery date and date requested by
customer);
4. on-time delivery rate (percentage of shipments made on or before the promised delivery
date);
5. customer satisfaction with specific product features (to measure design quality);
6. market share; and
7. percentage of units of product that fail soon after delivery.
19-9 Examples of nonfinancial measures of internal-business-process quality include the
following:
1. the percentage of defective products;
2. percentage of reworked products;
3. manufacturing cycle time (the amount of time from when an order is received by production
to when it becomes a finished good); and
4. number of product and process design changes
19-10 When evaluating alternative ways to improve quality, managers need to identify the
relevant costs and benefits of quality improvement efforts by focusing on how total costs and total
revenues will change. Fully allocated costs of quality often include the allocation of fixed costs
that will not change with quality-improvement activities. These fixed costs are irrelevant when
calculating the benefits of quality improvement and so should not be considered.
19-11 Customer-response time is how long it takes from the time a customer places an order for
a product or a service to the time the product or service is delivered to the customer. Manufacturing
cycle time is how long it takes from the time an order is received by manufacturing to the time a
finished good is produced. Manufacturing cycle time is only one part of customer-response time.
Delays in delivering an order for a product or service can also occur because of delays in receiving
customer orders and delays in delivering a completed order to a customer.
Customer
response
time
=
Receipt
time
+
Manufacturing
cycle time
+
Delivery
time
19-12 No. There is a tradeoff between customer-response time and on-time performance. Simply
scheduling longer customer-response time makes achieving on-time performance easier.
Companies should, however, attempt to reduce the uncertainty of the arrival of orders, manage
19-
3
bottlenecks, reduce setup and processing time, and run smaller batches. This would have the effect
of reducing both customer-response time and improving on-time performance.
19-13 Two reasons why lines, queues, and delays occur is (1) uncertainty about when customers
will order products or services––uncertainty causes a number of orders to be received at the same
time, causing delays, and (2) limited capacity and bottlenecks––a bottleneck is an operation where
the work to be performed approaches or exceeds the available capacity.
19-14 No. Adding a product when capacity is constrained and the timing of customer orders is
uncertain causes delays in delivering all existing products. If the revenue losses from delays in
delivering existing products and the increase in carrying costs of the existing products exceed the
positive contribution earned by the product that was added, then it is not worthwhile to make and
sell the new product, despite its positive contribution margin. The chapter describes the negative
effects (negative externalities) that one product can have on others when products share common
manufacturing facilities.
19-15 No. Managers should use both financial and nonfinancial measures to manage the
performance of their firms along the time dimension. Financial measures, such as revenue and cost
measures, evaluate the financial effects of increases or decreases in measures such as customer-
response times. Nonfinancial measures help managers evaluate how well they have done on goals
such as improving manufacturing cycle times and customer-response times that drive financial
performance. Nonfinancial measures are leading indicators of financial performance.
19-
4
19-16 (30 min.) Costs of quality.
(CMA, adapted) Osborn, Inc., produces cell phone equipment. Amanda Westerly, Osborn’s president, decided to devote more resources
to the improvement of product quality after learning that her company had been ranked fourth in product quality in a 2011 survey of cell
phone users. Osborn’s quality-improvement program has now been in operation for 2 years, and the cost report shown here has recently
been issued.
19-
5
Required:
1. For each period, calculate the ratio of each COQ category to revenues and to total quality costs.
2. Based on the results of requirement 1, would you conclude that Osborn’s quality program has been successful? Prepare a short report
to present your case.
3. Based on the 2011 survey, Amanda Westerly believed that Osborn had to improve product quality. In making her case to Osborn
management, how might Westerly have estimated the opportunity cost of not implementing the quality-improvement program?
SOLUTION
1. The ratios of each COQ category to revenues and to total quality costs for each period are as follows:
Osborn, Inc.: Semi-Annual Costs of Quality Report
(in thousands)
6/30/2012
12/31/2012
6/30/2013
12/31/2013
Actual
% of
Revenues
% of Total
Quality
Costs
Actual
% of
Revenues
% of Total
Quality
Costs
Actual
% of
Revenues
% of Total
Quality
Costs
Actual
% of
Revenues
% of Total
Quality Costs
(2) =
(3) =
(5) =
(6) =
(8) =
(9) =
(11) =
(12) =
(1)
(1) ÷ $8,220
(1) ÷ $2,096
(4)
(4) ÷ $9,180
(4) ÷ $2,168
(7)
(7) ÷ $9,260
(7) ÷ $1,641
(10)
(10) ÷ $9,050
(10) ÷ $1,211
Prevention costs
Machine maintenance
$ 480
$ 480
$ 440
$ 290
Supplier training
21
90
45
35
Design reviews
30
218
198
196
Total prevention costs
531
6.5%
25.3%
788
8.6%
36.4%
683
7.4%
41.6%
521
5.8%
43.0%
Appraisal costs
Incoming inspection
109
124
89
55
Final testing
327
327
302
202
Total appraisal costs
436
5.3%
20.8%
451
4.9%
20.8%
391
4.2%
23.8%
257
2.8%
21.2%
Internal failure costs
Rework
226
206
166
115
Scrap
127
124
68
65
Total internal failure costs
353
4.3%
16.9%
330
3.6%
15.2%
234
2.5%
14.3%
180
2.0%
14.9%
External failure costs
Warranty repairs
182
89
70
67
Customer returns
594
510
263
186
Total external failure costs
776
9.4%
37.0%
599
6.5%
27.6%
333
3.6%
20.3%
253
2.8%
20.9%
Total quality costs
$2,096
25.5%
100.0%
$2,168
23.6%
100.0%
$1,641
17.7%
100.0%
$1,211
13.4%
100.0%
Total revenues
$8,220
$9,180
$9,260
$9,050
19-
7
2. From an analysis of the Cost of Quality Report, it would appear that Osborn, Inc.’s program
has been successful because
• Total quality costs as a percentage of total revenues have declined from 25.5% to
13.4%.
• External failure costs, those costs signaling customer dissatisfaction, have declined
from 9.4% of total revenues to 2.8% of total revenues and from 37% of all quality costs
to 20.9% of all quality costs. These declines in warranty repairs and customer returns
should translate into increased revenues in the future.
• Internal failure costs as a percentage of revenues have been halved from 4.3% to 2%.
• Appraisal costs have decreased from 5.3% to 2.8% of revenues. Preventing defects
from occurring in the first place is reducing the demand for final testing.
• Quality costs have shifted to the area of prevention where problems are solved before
production starts: total prevention costs (maintenance, supplier training, and design
reviews) have risen from 25.3% to 43% of total quality costs, but the absolute amount
of these costs has decreased.
• Because of improved designs, quality training, and additional preproduction
inspections, scrap and rework costs have almost been halved while increasing sales by
10%.
• Production does not have to spend an inordinate amount of time with customer service
because they are now making the product right the first time and warranty repairs and
customer returns have decreased.
3. To estimate the opportunity cost of not implementing the quality program and to help her
make her case, Amanda Westerly could have assumed that
• Sales and market share would continue to decline if the quality program was not
implemented and then calculated the loss in revenue and contribution margin.
• The company would have to compete on price rather than quality and calculated the
impact of having to lower product prices.
Opportunity costs are not recorded in accounting systems because they represent the results of
what might have happened if the company had not improved quality. Nevertheless, opportunity
costs of poor quality can be significant. It is important for Osborn to take these costs into account
when making decisions about quality.
19-17 (20 min.) Costs of quality analysis.
Safe Travel produces car seats for children from newborn to 2 years old. The company is worried
because one of its competitors has recently come under public scrutiny because of product failure.
Historically, Safe Travel’s only problem with its car seats was stitching in the straps. The problem
can usually be detected and repaired during an internal inspection. The cost of the inspection is
$5.00 per car seat, and the repair cost is $1.00 per car seat. All 200,000 car seats were inspected
last year, and 5% were found to have problems with the stitching in the straps during the internal
inspection. Another 1% of the 200,000 car seats had problems with the stitching, but the internal
19-
8
inspection did not discover them. Defective units that were sold and shipped to customers needed
to be shipped back to Safe Travel and repaired. Shipping costs are $8.00 per car seat, and repair
costs are $1.00 per car seat. However, the out-of-pocket costs (shipping and repair) are not the
only costs of defects not discovered in the internal inspection. Negative publicity will result in a
loss of future contribution margin of $100 for each external failure.
Required:
1. Calculate appraisal cost.
2. Calculate internal failure cost.
3. Calculate out-of-pocket external failure cost.
4. Determine the opportunity cost associated with the external failures.
5. What are the total costs of quality?
6. Safe Travel is concerned with the high up-front cost of inspecting all 200,000 units. It is
considering an alternative internal inspection plan that will cost only $3.00 per car seat
inspected. During the internal inspection, the alternative technique will detect only 3.5% of the
200,000 car seats that have stitching problems. The other 2.5% will be detected after the car
seats are sold and shipped. What are the total costs of quality for the alternative technique?
7. What factors other than cost should Safe Travel consider before changing inspection
techniques?
SOLUTION
1. Appraisal cost = Inspection cost
= $5 × 200,000 car seats
= $1,000,000
2. Internal failure cost = Rework cost
= 5% × 200,000 × $1
= 10,000 × $1 = $10,000
3. Out of pocket external failure cost = Shipping cost + Repair cost
= 1% × 200,000 × ($8 + $1)
= 2,000 × $9 = $18,000
4. Opportunity cost of external failure = Lost future profits
= (1% × 200,000) × $100
= 2,000 car seats × $100 = $200,000
5. Total cost of quality control = $1,000,000 + $10,000 + $18,000 + $200,000
= $1,228,000
6. Quality control costs under the alternative inspection technique:
Appraisal cost = $3 × 200,000 = $600,000
Internal failure cost = 3.5% × 200,000 × $1 = $7,000
Out-of-pocket external failure cost = 2.5% × 200,000 × ($8 + $1)
19-
9
= 5,000 × $9 = $45,000
Opportunity cost of external failure = (2.5% × 200,000) × $100
= 5,000 car seats × $100 = $500,000
Total cost of quality control = $600,000 + $7,000 + $45,000 + $500,000
= $1,152,000
7. In addition to the lower costs under the alternative inspection plan, Safe Travel should
consider a number of other factors:
a. There could easily be serious reputation effects if the percentage of external failures
increases by 250% (from 1% to 2.5%). This rise in external failures may lead to costs
greater than $100 per failure due to lost profits.
b. Higher external failure rates may increase the probability of lawsuits.
c. Government intervention is a concern with the chances of government regulation
increasing with the number of external failures.
19-18 (15 min.) Cost of quality analysis, ethical considerations (continuation of 19-17).
Refer to information in Exercise 19-17 in answering this question. Safe Travel has discovered a
more serious problem with the plastic core of its car seats. An accident can cause the plastic in
some of the seats to crack and break, resulting in serious injuries to the occupant. It is estimated
that this problem will affect about 200 car seats in the next year. This problem could be corrected
by using a higher quality of plastic that would increase the cost of every car seat produced by $10.
If this problem is not corrected, Safe Travel estimates that out of the 200 car seats affected,
customers will realize that the problem is due to a defect in the seats in only three cases. Safe
Travel’s legal team has estimated that each of these three cases would result in a lawsuit that could
be settled for about $500,000. All lawsuits settled would include a confidentiality clause, so Safe
Travel’s reputation would not be affected.
1. Assuming that Safe Travel expects to sell 200,000 car seats next year, what would be the cost
of increasing the quality of all 200,000 car seats?
2. What will be the total cost of the lawsuits next year if the problem is not corrected?
3. Suppose Safe Travel has decided not to increase the quality of the plastic because the cost of
increasing the quality exceeds the benefits (saving the cost of lawsuits). What do you think of
this decision? (Note: Because of the confidentiality clause, the decision will have no effect on
Safe Travel’s reputation.)
4. Are there any other costs or benefits that Safe Travel should consider?
SOLUTION
1. Cost of improving quality of plastic = $10 × 200,000 = $2,000,000
2. Total cost of lawsuits = 3 × $500,000 = $1,500,000
3. Although economically this may seem like a good decision, qualitative factors should be
more important than quantitative factors when it comes to protecting customers from harm
19-
10
and injury. If a product can cause a customer serious harm and injury, an ethical and moral
company should take steps to prevent that harm and injury. The company’s code of ethics
should guide this decision.
4. In addition to ethical considerations, the company should consider the societal cost of this
decision, reputation effects if word of these problems leaks out at a later date, and
governmental intervention and regulation.
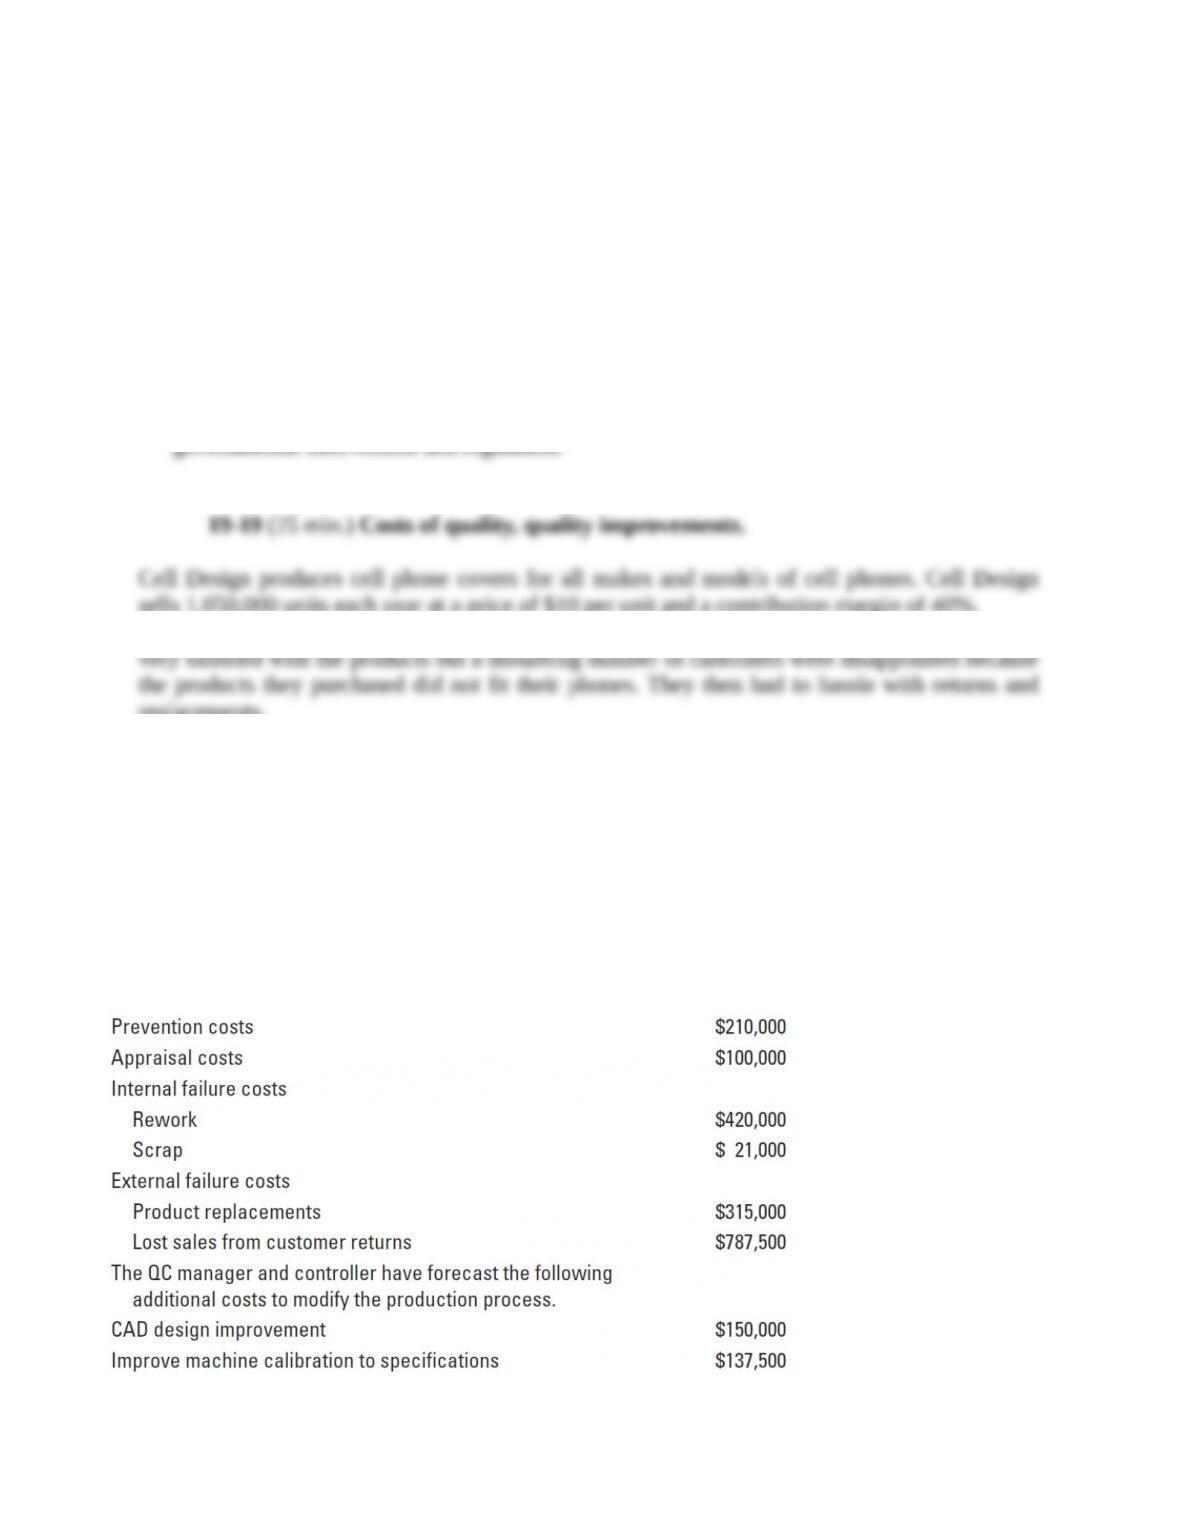
19-19 (25 min.) Costs of quality, quality improvements.
Cell Design produces cell phone covers for all makes and models of cell phones. Cell Design sells
1,050,000 units each year at a price of $10 per unit and a contribution margin of 40%.
A survey of Cell Design customers over the past 12 months indicates that customers were very
satisfied with the products but a disturbing number of customers were disappointed because the
products they purchased did not fit their phones. They then had to hassle with returns and
replacements.
Cell Design’s managers want to modify their production processes to develop products that
more closely match Cell Design’s specifications because the quality control in place to prevent ill-
fitting products from reaching customers is not working very well.
The current costs of quality are as follows:
Required:
1. Which cost of quality category are managers focusing on? Why?
2. If the improvements result in a 60% decrease in customer replacement cost and a 70% decrease
in customer returns, what is the impact on the overall COQ and the company’s operating
income? What should Cell Design do? Explain.
19-
11
3. Calculate prevention, appraisal, internal failure, and external failure costs as a percentage of
total quality costs and as a percentage of sales before and after the change in the production
process. Comment briefly on your results.


