14-1
N CHAPTER 14
COST ALLOCATION, CUSTOMER-PROFITABILITY
ANALYSIS, AND SALES-VARIANCE ANALYSIS
14-1 Disagree. Cost accounting data plays a key role in many management planning and control
decisions. The division president will be able to make better operating and strategy decisions by
being involved in key decisions about cost pools and cost allocation bases. Such an understanding,
for example, can help the division president evaluate the profitability of different customers.
14-2 Customer profitability analysis highlights for managers how individual customers
differentially contribute to total profitability. It helps managers to see whether customers who
contribute sizably to total profitability are receiving a comparable level of attention from the
organization.
14-3 Companies that separately record (a) the list price and (b) the discount have sufficient
information to subsequently examine the level of discounting by each individual customer and by
each individual salesperson.
14-4 No. A customer-profitability profile highlights differences in the current period’s
profitability across customers. Dropping customers should be the last resort. An unprofitable
customer in one period may be highly profitable in subsequent future periods. Moreover, costs
assigned to individual customers need not be purely variable with respect to short-run elimination
of sales to those customers. Thus, when customers are dropped, costs assigned to those customers
may not disappear in the short run.
14-5 Five categories in a customer cost hierarchy are identified in the chapter. The examples
given relate to the Provalue Division of Astel Computers used in the chapter:
• Customer output-unit-level costs—costs of activities to sell each unit (computer) to a
customer. An example is product-handling costs of each computer sold.
• Customer batch-level costs—costs of activities that are related to a group of units (computers)
sold to a customer. Examples are costs incurred to process orders or to make deliveries.
• Customer–sustaining costs—costs of activities to support individual customers, regardless of
the number of units or batches of product delivered to the customer. Examples are costs of
visits to customers or costs of displays at customer sites.
• Distribution-channel costs—costs of activities related to a particular distribution channel
rather than to each unit of product, each batch of product, or specific customers. An example
is the salary of the manager of Provalue Division’s wholesale distribution channel.
• Division-sustaining costs—costs of division activities that cannot be traced to individual
customers or distribution channels. An example is the salary of the Provalue Division
manager.
14-6 Charting cumulative profits by customer or product type generates a whale curve. This
provides information on the profitability of customers and clearly differentiates the most profitable
from the least profitable.
14-2
14-7 Disagree. In general, companies have three choices regarding the allocation of corporate
costs to divisions: allocate all corporate costs, allocate some corporate costs (those “controllable”
by the divisions), and allocate none of the corporate costs. Which one of these is appropriate
depends on several factors: the composition of corporate costs, the purpose of the costing exercise,
and the time horizon, to name a few. For example, one can easily justify allocating all corporate
costs when they are closely related to the running of the divisions and when the purpose of costing
is, say, pricing products or motivating managers to consume corporate resources judiciously.
14-8 Exhibit 14-8 lists four criteria used to guide cost allocation decisions:
1. Cause and effect.
2. Benefits received.
3. Fairness or equity.
4. Ability to bear.
The cause-and-effect criterion and the benefits-received criterion are the dominant criteria when
the purpose of the allocation is related to the economic decision purpose or the motivation purpose.
14-9 Disagree. If corporate costs allocated to a division can be reallocated to the indirect cost
pools of the division on the basis of a logical cause-and-effect relationship, then it is in fact
preferable to do so—this will result in fewer division-indirect-cost pools and a more cost-effective
cost allocation system. This reallocation of allocated corporate costs should only be done if the
allocation base used for each division indirect cost pool has the same cause–and-effect relationship
with every cost in that indirect cost pool, including the reallocated corporate cost.
14-10 Disagree. A company will frequently allocate costs that are fixed in the short run to
customers to determine long-run profitability of customers. In the long run, a company must ensure
that the revenues received from a customer exceed the total resources consumed to support the
customer, regardless of whether these costs are variable or fixed in the short run. For short-run
decisions, however, costs that are fixed in the short run may often be irrelevant.
14-11 When allocating costs to divisions, channels, and customers, companies must construct
cost pools that are, to the extent possible, homogeneous, so that all costs in the cost pool have the
same or a similar cause-and-effect or benefits-received relationship with the cost-allocation base.
If each cost category has a cause-and-effect or benefits-received relationship with a different cost-
allocation base, the company should maintain separate cost pools for each of these costs.
Determining homogeneous cost pools requires judgment and should be revisited on a regular basis.
14-12 Using the levels approach introduced in Chapter 7, the sales-volume variance is a Level 2
variance. By sequencing through Level 3 (sales-mix and sales-quantity variances) and then Level 4
(market-size and market-share variances), managers can gain insight into the causes of a specific
sales-volume variance caused by changes in the mix and quantity of the products sold as well as
changes in market size and market share.
14-13 The total sales-mix variance arises from differences in the budgeted contribution margin
of the actual and budgeted sales mix. The composite unit concept enables the effect of individual
product changes to be summarized in a single intuitive number by using weights based on the mix
of individual units in the actual and budgeted mix of products sold.
14-3
14-14 A favorable sales-quantity variance arises because the actual units of all products sold
exceed the budgeted units of all products sold.
14-15 The sales-quantity variance can be decomposed into (a) a market-size variance (which
arises when the actual total market size in units is different from the budgeted market size in units)
and (b) a market share variance (which arises when the actual market share of a company is
different from its budgeted market share). Both variances use the budgeted average contribution
margin per unit.
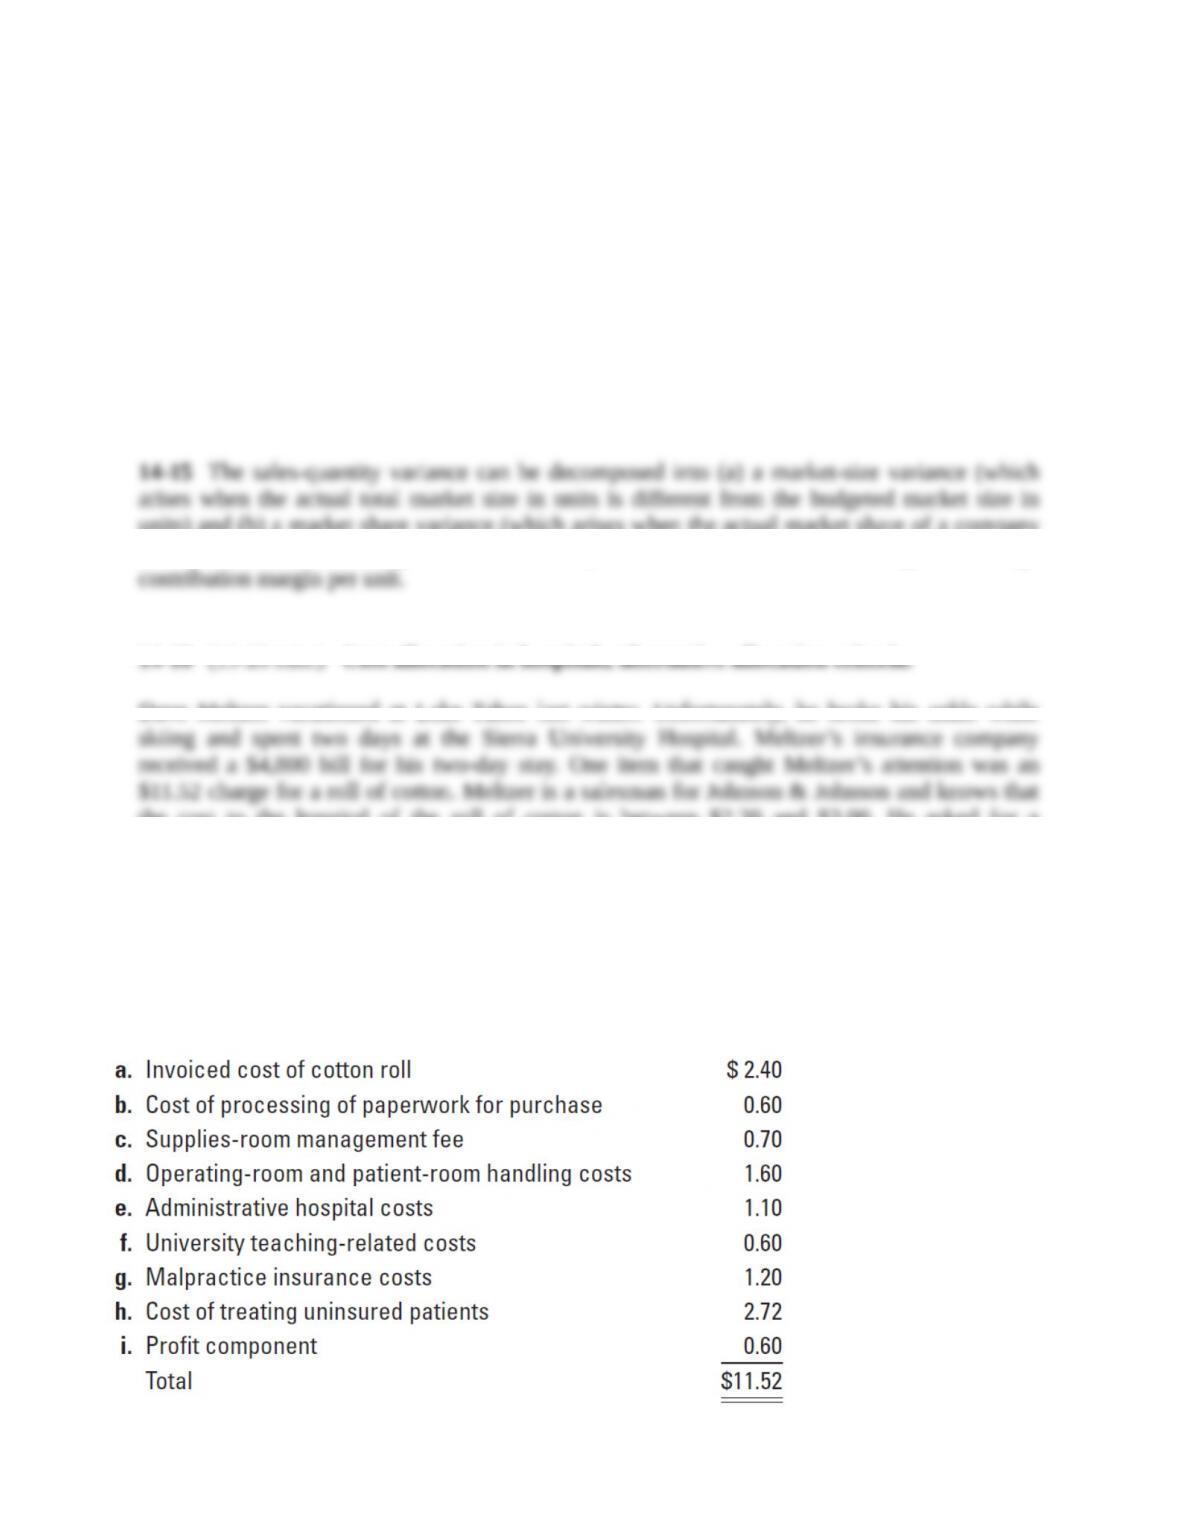
14-16 (15-20 min.) Cost allocation in hospitals, alternative allocation criteria.
Dave Meltzer vacationed at Lake Tahoe last winter. Unfortunately, he broke his ankle while skiing
and spent two days at the Sierra University Hospital. Meltzer’s insurance company received a
$4,800 bill for his two-day stay. One item that caught Meltzer’s attention was an $11.52 charge
for a roll of cotton. Meltzer is a salesman for Johnson & Johnson and knows that the cost to the
hospital of the roll of cotton is between $2.20 and $3.00. He asked for a breakdown of the $11.52
charge. The accounting office of the hospital sent him the following information:
Meltzer believes the overhead charge is outrageous. He comments, “There was nothing I could do
about it. When they come in and dab your stitches, it’s not as if you can say, ‘Keep your cotton
roll. I brought my own.’”
Required:
1. Compute the overhead rate Sierra University Hospital charged on the cotton roll.
2. What criteria might Sierra use to justify allocation of the overhead items b–i in the preceding
list? Examine each item separately and use the allocation criteria listed in Exhibit 14-8 (page
563) in your answer.
3. What should Meltzer do about the $11.52 charge for the cotton roll?
14-4
SOLUTION
1. Direct costs = $2.40
Indirect costs ($11.52 – $2.40) = $9.12
Overhead rate = $9.12
$2.40 = 380%
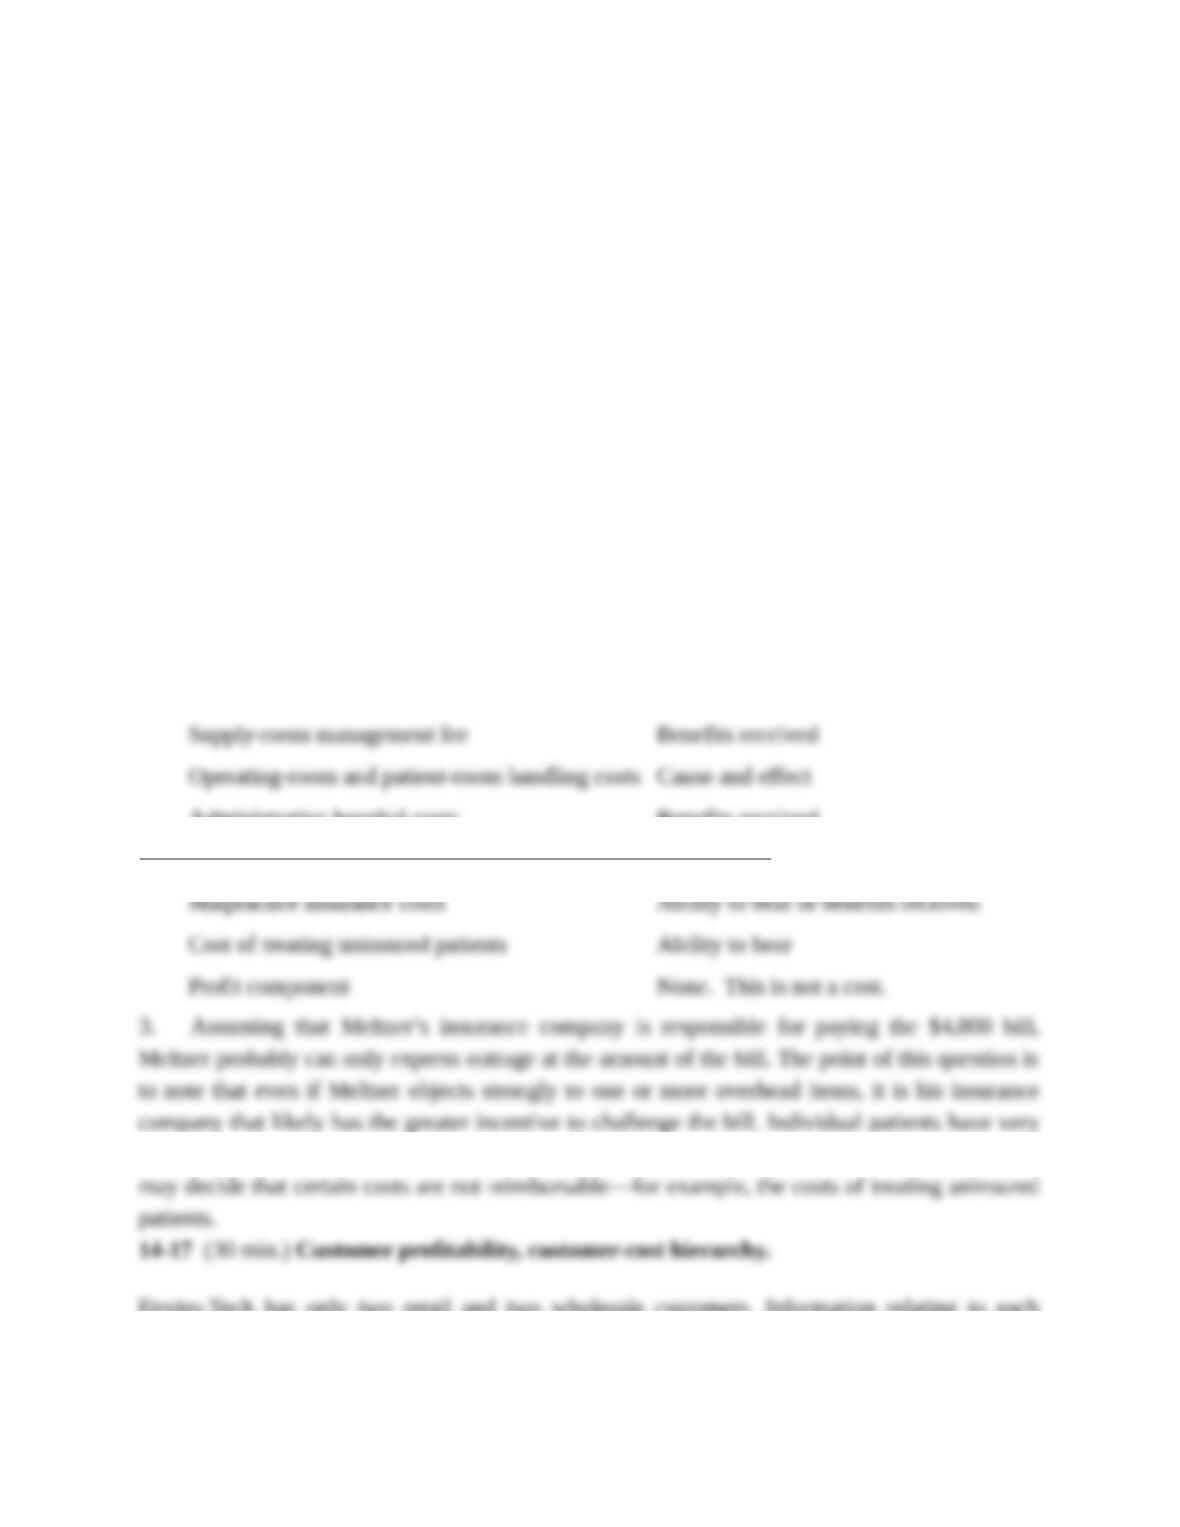
2. The answers here are less than clear-cut in some cases.
Overhead Cost Item
Allocation Criteria
Processing of paperwork for purchase
Supply-room management fee
Operating-room and patient-room handling costs
Administrative hospital costs
University teaching-related costs
Malpractice insurance costs
Cost of treating uninsured patients
Profit component
Cause and effect
Benefits received
Cause and effect
Benefits received
Ability to bear
Ability to bear or benefits received
Ability to bear
None. This is not a cost.
3. Assuming that Meltzer’s insurance company is responsible for paying the $4,800 bill,
Meltzer probably can only express outrage at the amount of the bill. The point of this question is
to note that even if Meltzer objects strongly to one or more overhead items, it is his insurance
company that likely has the greater incentive to challenge the bill. Individual patients have very
little power in the medical arena. In contrast, insurance companies have considerable power and
may decide that certain costs are not reimbursable—for example, the costs of treating uninsured
patients.
14-17 (30 min.) Customer profitability, customer-cost hierarchy.
Enviro-Tech has only two retail and two wholesale customers. Information relating to each
customer for 2013 follows (in thousands):
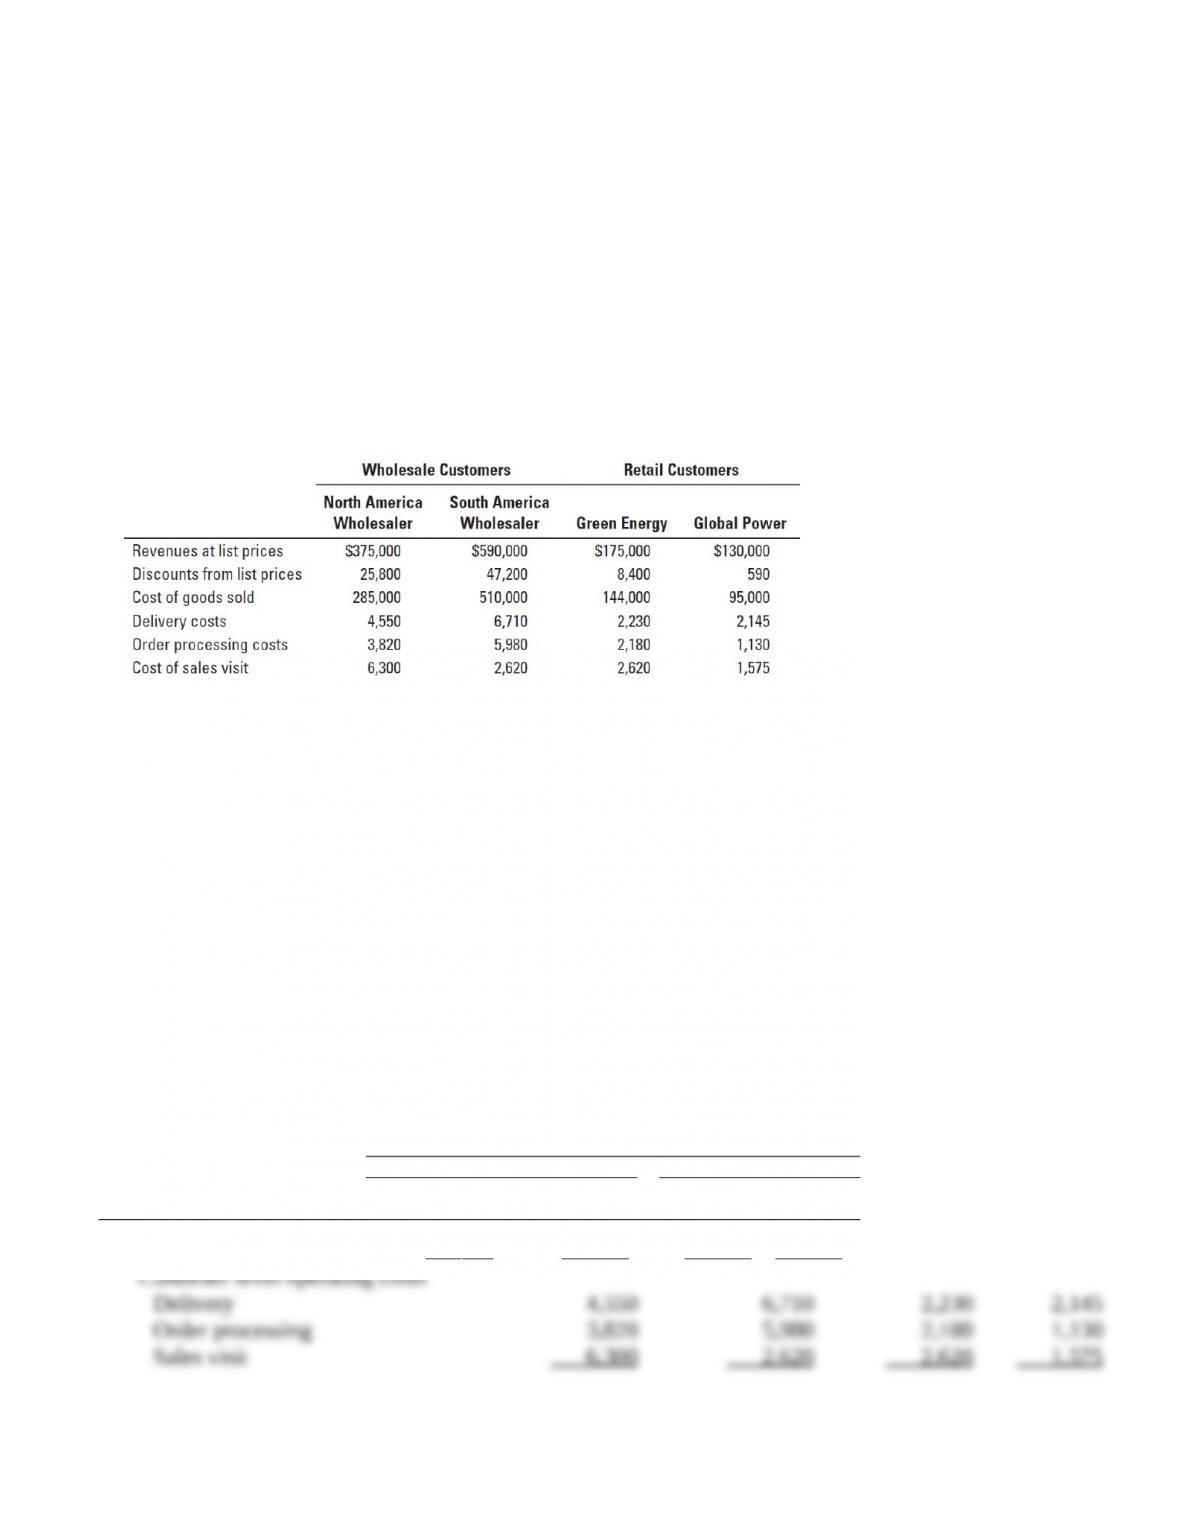
Enviro-Tech’s annual distribution-channel costs are $33 million for wholesale customers and $12
million for retail customers. The company’s annual corporate-sustaining costs, such as salary for
top management and general-administration costs, are $48 million. There is no cause-and-effect
or benefits-received relation- ship between any cost-allocation base and corporate-sustaining costs.
That is, Enviro-Tech could save corporate-sustaining costs only if the company completely shuts
down.
Required:
1. Calculate customer-level operating income using the format in Exhibit 14-3.
2. Prepare a customer-cost hierarchy report, using the format in Exhibit 14-6.
3. Enviro-Tech’s management decides to allocate all corporate-sustaining costs to distribution
channels: $38 million to the wholesale channel and $10 million to the retail channel. As a
result, distribution channel costs are now $71 million ($33 million + $38 million) for the
wholesale channel and $22 million ($12 million + $10 million) for the retail channel. Calculate
the distribution channel–level operating income. On the basis of these calculations, what
actions, if any, should Enviro–Tech’s managers take? Explain.
4. How might Enviro-Tech use the new cost information from its activity-based costing system
to better manage its business?
SOLUTION
1.
All amounts in thousands of U.S. dollars
Wholesale
Retail
North America
South America
Green
Global
Wholesaler
Wholesaler
Energy
Power
Revenues at list prices
$375,000
$590,000
$175,000
$130,000
Price discounts
25,800
47,200
8,400
590
Revenues (at actual prices)
349,200
542,800
166,600
129,410
Cost of goods sold
285,000
510,000
144,000
95,000
Gross margin
64,200
32,800
22,600
34,410
Customer-level operating costs
Delivery
4,550
6,710
2,230
2,145
Order processing
3,820
5,980
2,180
1,130
Sales visit
6,300
2,620
2,620
1,575

14-6
Total customer-level oper. costs
14,670
15,310
7,030
4,850
Customer-level operating. income
$ 49,530
$ 17,490
$ 15,570
$ 29,560
14-7
2. Customer Distribution Channels
(all amounts in $000s)
Wholesale Customers
Retail Customers
Total
Total
North America
South America
Total
Green
Global
(all customers)
Wholesale
Wholesaler
Wholesaler
Retail
Energy
Power
(1) = (2) + (5)
(2) = (3) + (4)
(3)
(4)
(5) = (6) + (7)
(6)
(7)
Revenues (at actual prices)
$1,188,010
$892,000
$349,200
$542,800
$296,010
$166,600
$129,410
Customer-level costs
1,050,860
824,980
299,670a
525,310a
243,880
151,030a
99,850a
Customer-level operating
income
112,150
67,020
$ 49,530
$ 17,490
45,130
$ 15,570
$ 29,560
Distribution-channel costs
45,000
33,000
12,000
Distribution-channel-level
oper. income
67,150
$ 34,020
$ 33,130
Corporate-sustaining costs
48,000
Operating income
$ 19,150
aCost of goods sold + Total customer-level operating costs from Requirement 1
14-8
3. If corporate costs are allocated to the channels, the retail channel will show an operating
profit of $23,130,000 ($33,130,000 – $10,000,000), and the wholesale channel will show
an operating loss of $3,980,000 ($34,020,000 – $38,000,000). The overall operating profit,
of course, is still $19,150,000, as in requirement 2. There is, however, no cause-and-effect
or benefits-received relationship between corporate costs and any allocation base, i.e., the
allocation of $38,000,000 to the wholesale channel and $10,000,000 to the retail channel
is arbitrary and not useful for decision making. Therefore, the management of Enviro-Tech
should not base any performance evaluations or investment/disinvestment decisions based
on these channel-level operating income numbers. They may want to take corporate costs
into account, however, when making long-run pricing decisions.
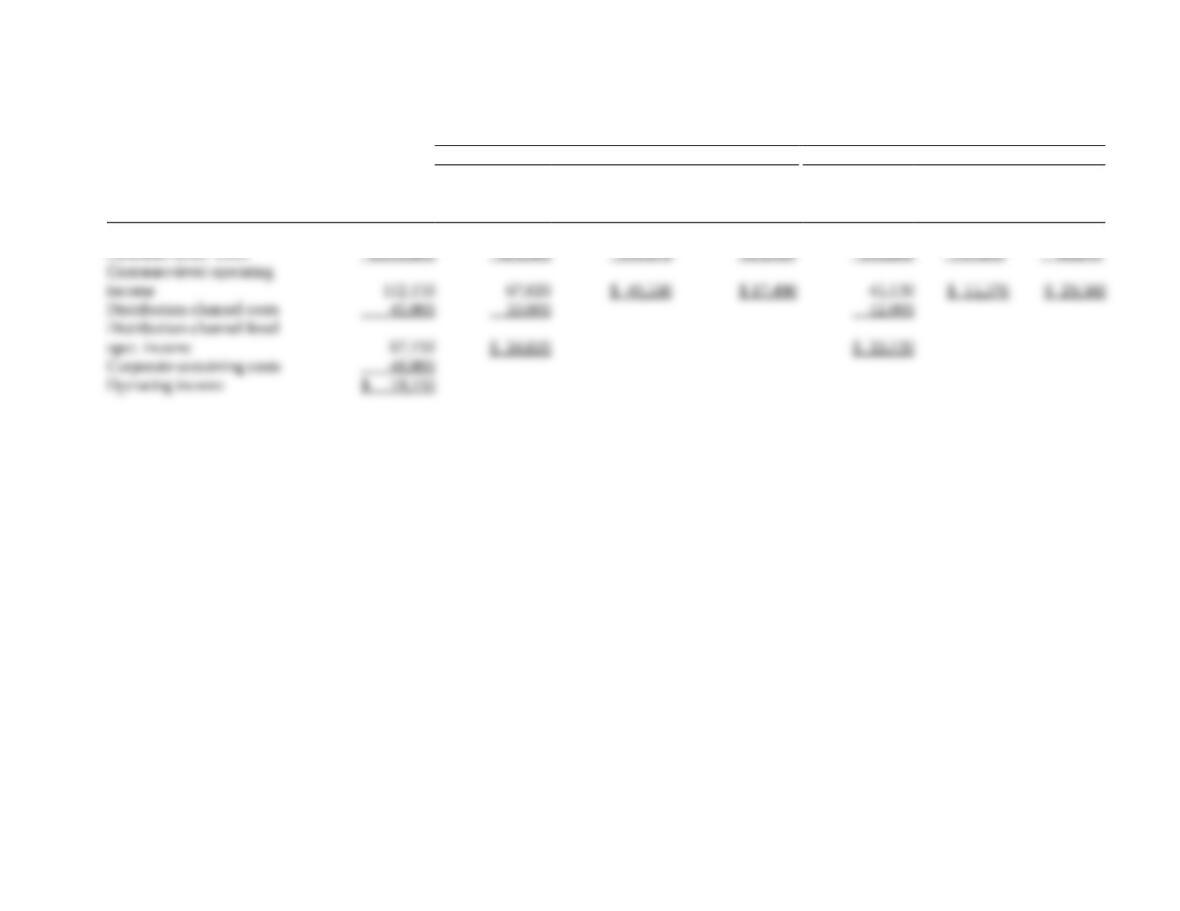
4. Enviro-Tech could use activity-based cost information to better manage its business by
evaluating the customer-level costs and determining which activities are providing a value
to the customer that they are willing to pay for. For example, costs of sales visits for the
North America Wholesaler are $6,300, which is more than double the cost for the South
America Wholesaler. Enviro-Tech should evaluate the efficiency and effectiveness of this
activity for this customer group. Enviro-Tech could also extend its ABC methodology to
the distribution channel costs to determine if any cause-and-effect relationships exist
between these costs and the customer types.
.
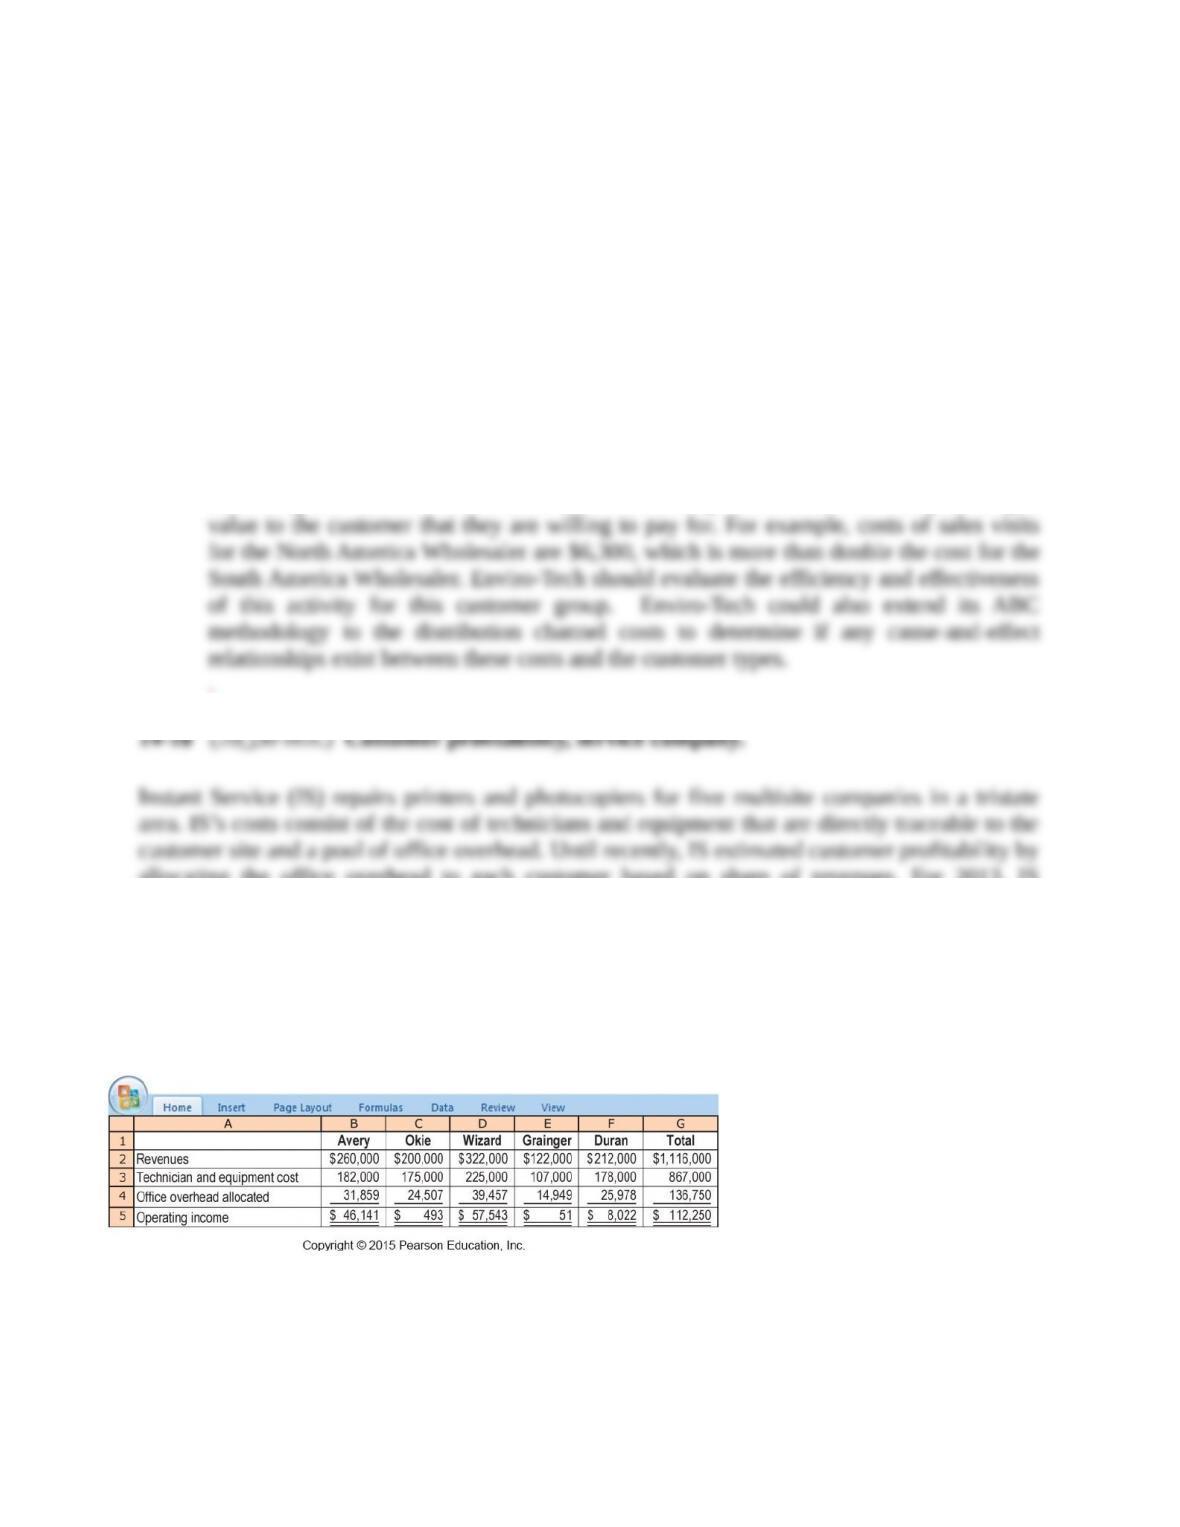
14-18 (20−30 min.) Customer profitability, service company.
Instant Service (IS) repairs printers and photocopiers for five multisite companies in a tristate area.
IS’s costs consist of the cost of technicians and equipment that are directly traceable to the
customer site and a pool of office overhead. Until recently, IS estimated customer profitability by
allocating the office overhead to each customer based on share of revenues. For 2013, IS reported
the following results:
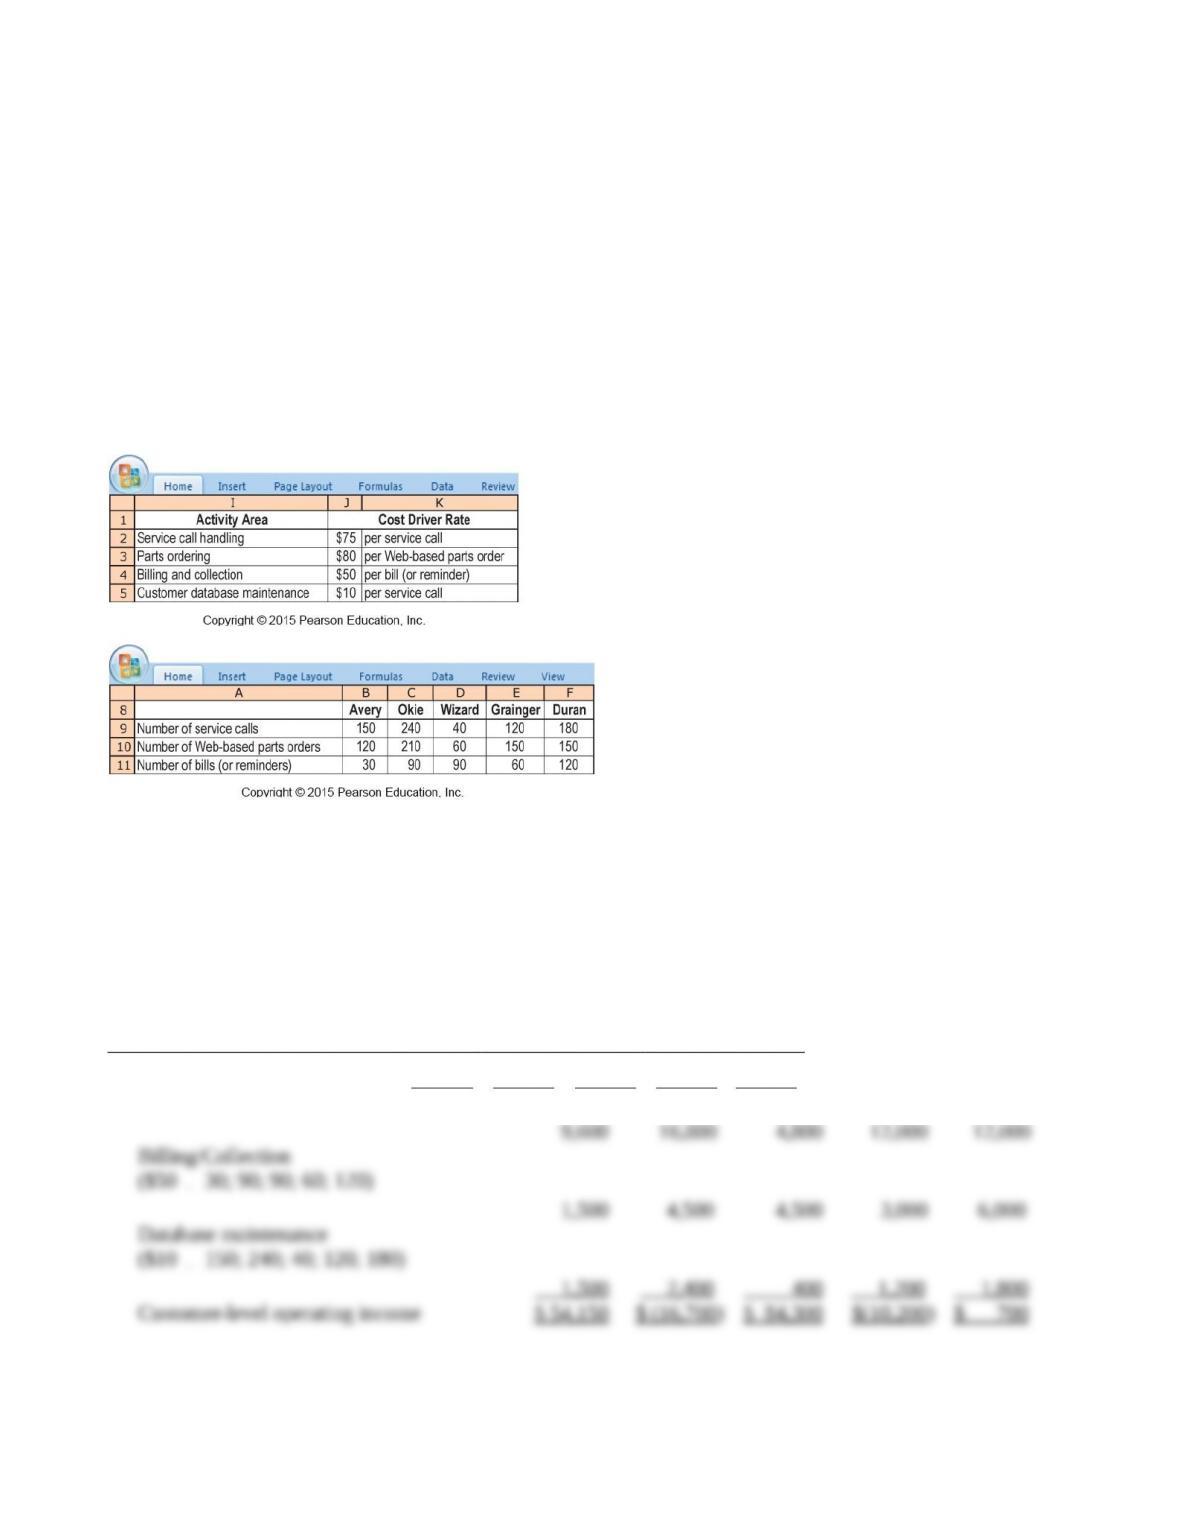
Tina Sherman, IS’s new controller, notes that office overhead is more than 10% of total costs, so
she spends a couple of weeks analyzing the consumption of office overhead resources by
customers. She collects the following information:
14-9
Required:
1. Compute customer-level operating income using the new information that Sherman has
gathered.
2. Prepare exhibits for IS similar to Exhibits 14-4 and 14-5. Comment on the results.
3. What options should IS consider, with regard to individual customers, in light of the new data
and analysis of office overhead?
SOLUTION
1.
Avery
Okie
Wizard
Grainger
Duran
Revenues
$260,000
$200,000
$322,000
$122,000
$212,000
Technician and equipment cost
182,000
175,000
225,000
107,000
178,000
Gross margin
78,000
25,000
97,000
15,000
34,000
Service call handling
($75
150; 240; 40; 120; 180)
11,250
18,000
3,000
9,000
13,500
Web-based parts ordering
($80
120; 210; 60; 150; 150)
9,600
16,800
4,800
12,000
12,000
Billing/Collection
($50
30; 90; 90; 60; 120)
1,500
4,500
4,500
3,000
6,000
Database maintenance
($10
150; 240; 40; 120; 180)
1,500
2,400
400
1,200
1,800
Customer-level operating income
$ 54,150
$ (16,700)
$ 84,300
$(10,200)
$ 700
2. Customers Ranked on Customer-Level Operating Income
Cumulative
Customer-Level
Operating Income
Customer-Level
Customer-Level
Cumulative
as a % of Total
Operating
Customer
Operating Income
Customer-Level
Customer-Level
Customer
Income
Revenue
as a % of Revenue
Operating Income
Operating Income
Code
(1)
(2)
(3) = (1)
(2)
(4)
(5) = (4)
$112,250
Wizard
$ 84,300
$ 322,000
26.18%
$ 84,300
75%
Avery
54,150
260,000
20.83%
138,450
123%
Duran
700
212,000
0.33%
139,150
124%
Grainger
(10,200)
122,000
–8.36%
128,950
115%
Okie
(16,700)
200,000
–8.35%
112,250
100%
$112,250
$1,116,000
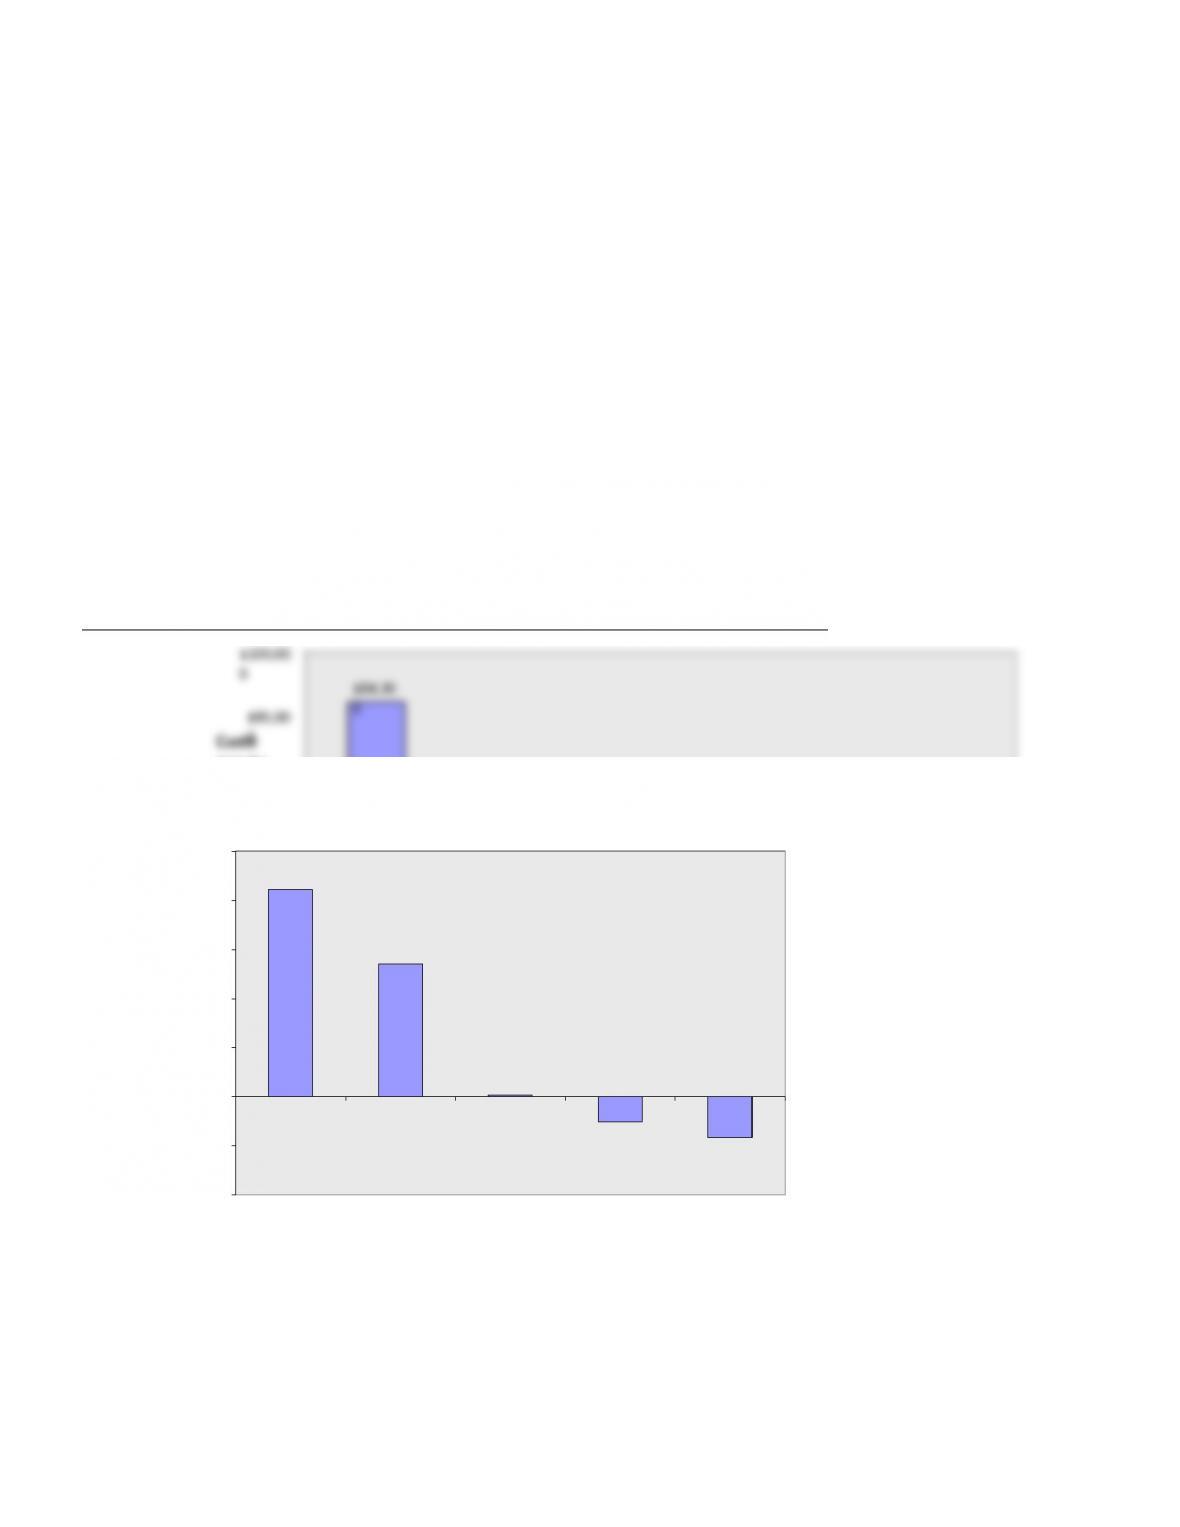
The table and graph above present the summary results.
Customer-Level Operating Income
$84,300
$54,150
$700
$(10,200)
$(16,700)
-$40,000
-$20,000
$0
$20,000
$40,000
$60,000
$80,000
$100,000
Customers
Customer-Level Operating Income
Grainger
Avery
Okie
Duran
Wizard
14-11
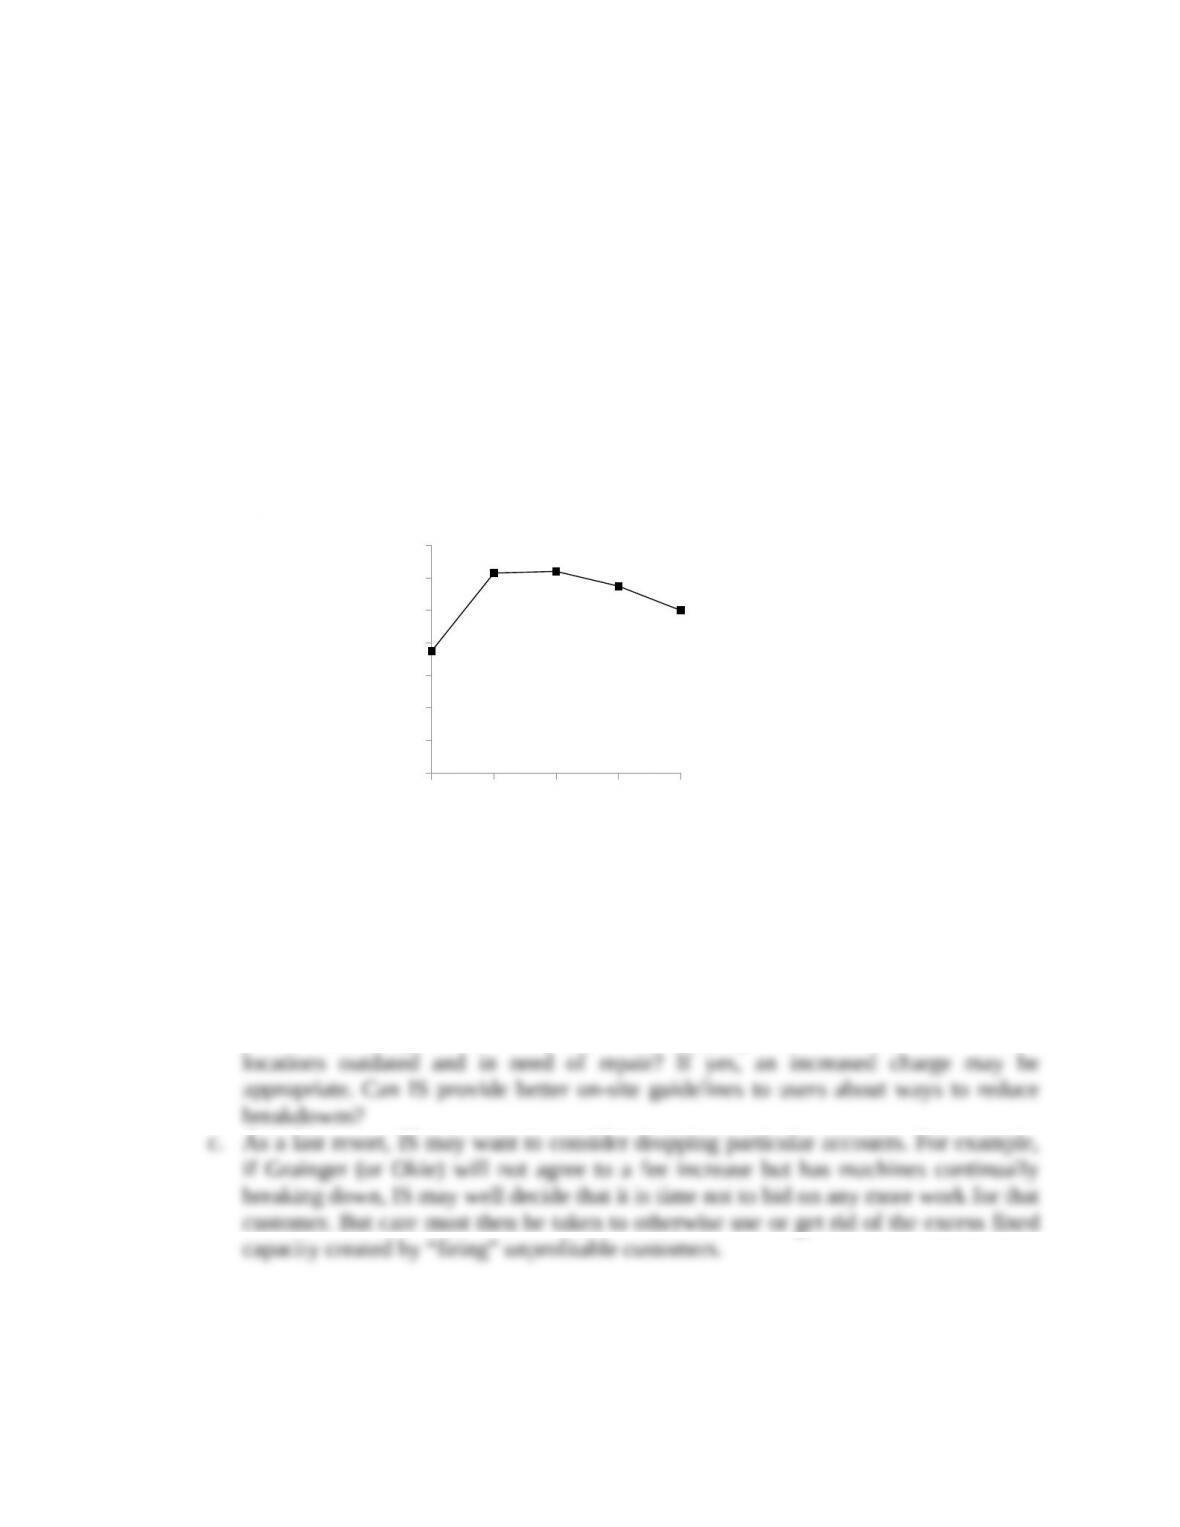
The following is the whale curve of cumulative profitability for Instant Service’s customers.
Wizard, the most profitable customer, provides 75% of total operating income. The three best
customers provide 124% of IS’s operating income, and the other two, by incurring losses for IS,
erode the extra 24% of operating income down to IS’s operating income.
3. The options that IS should consider include:
a. Increase the attention paid to Wizard and Avery. These are “key customers,” and every
effort has to be made to ensure they retain IS. IS may well want to suggest a minor
price reduction to signal how important it is in their view to provide a cost-effective
service to these customers.
b. Seek ways of reducing the costs or increasing the revenues of the problem accounts—
Okie and Grainger. For example, are the copying machines at those customer locations
outdated and in need of repair? If yes, an increased charge may be appropriate. Can IS
provide better on-site guidelines to users about ways to reduce breakdowns?
c. As a last resort, IS may want to consider dropping particular accounts. For example, if
Grainger (or Okie) will not agree to a fee increase but has machines continually
breaking down, IS may well decide that it is time not to bid on any more work for that
customer. But care must then be taken to otherwise use or get rid of the excess fixed
capacity created by “firing” unprofitable customers.
0%
20%
40%
60%
80%
100%
120%
140%
Wizard Avery Duran Grainger Okie
Cumulative Income as a
Percent of Total Income
Customers
Whale Curve of Cumulative Profitability for Instant
Service’s Customers