2012
2013
Total
Per unit
(2)=
(1) ÷ 150
Total
Per unit
(4)=
(3) ÷ 178
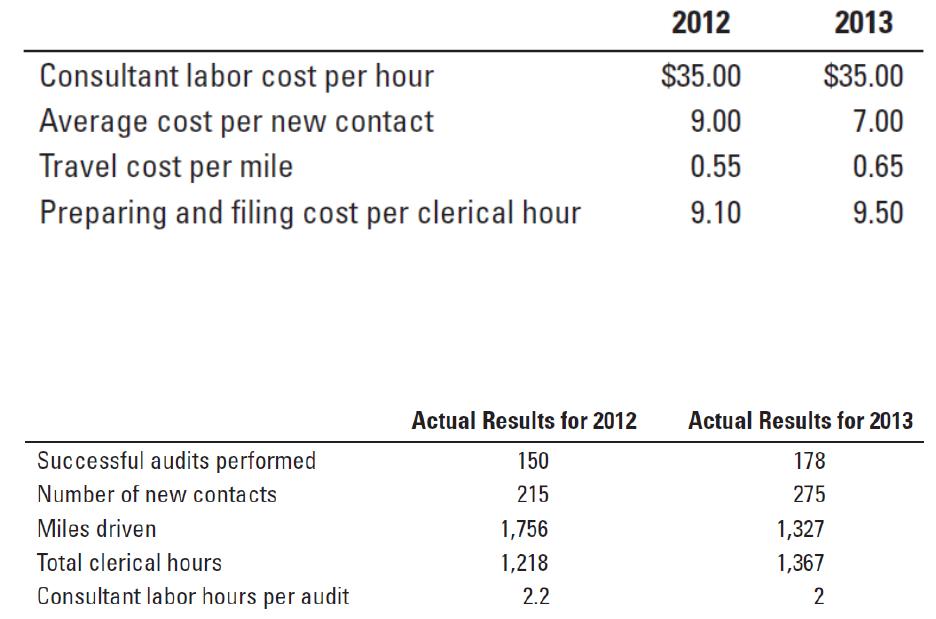
Consultation labor
$35 × 2.2 hrs. × 150; $35 × 2 hrs. × 178
$11,550.0
0
$ 77.00
$12,460.00
$ 70.00
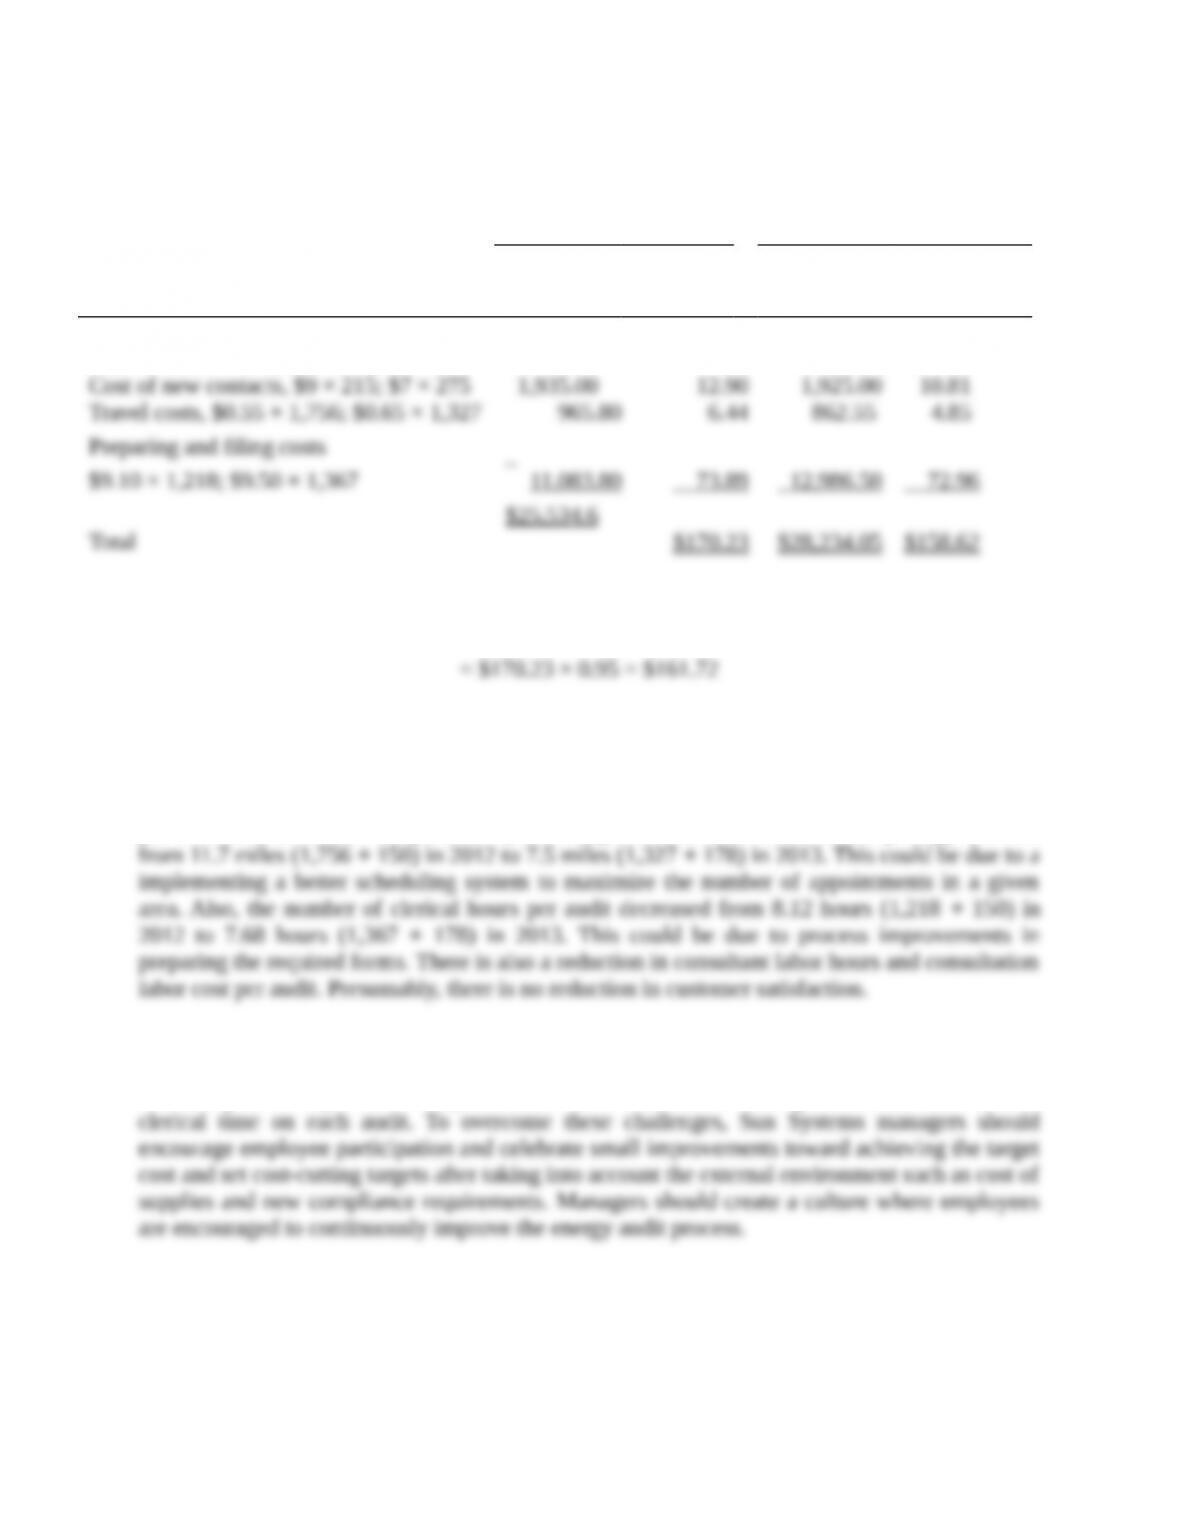
Cost of new contacts, $9 × 215; $7 × 275
1,935.00
12.90
1,925.00
10.81
Travel costs, $0.55 × 1,756; $0.65 × 1,327
965.80
6.44
862.55
4.85
Preparing and filing costs
$9.10 × 1,218; $9.50 × 1,367
11,083.80
73.89
12,986.50
72.96
Total
$25,534.6
0
$170.23
$28,234.05
$158.62
3. Target cost per audit in 2013 = Cost per audit in 2012 × 95%
= $170.23 × 0.95 = $161.72
Actual cost per audit in 2013 was $158.62. Hence, Sun Systems did achieve its target cost per audit
of $161.72
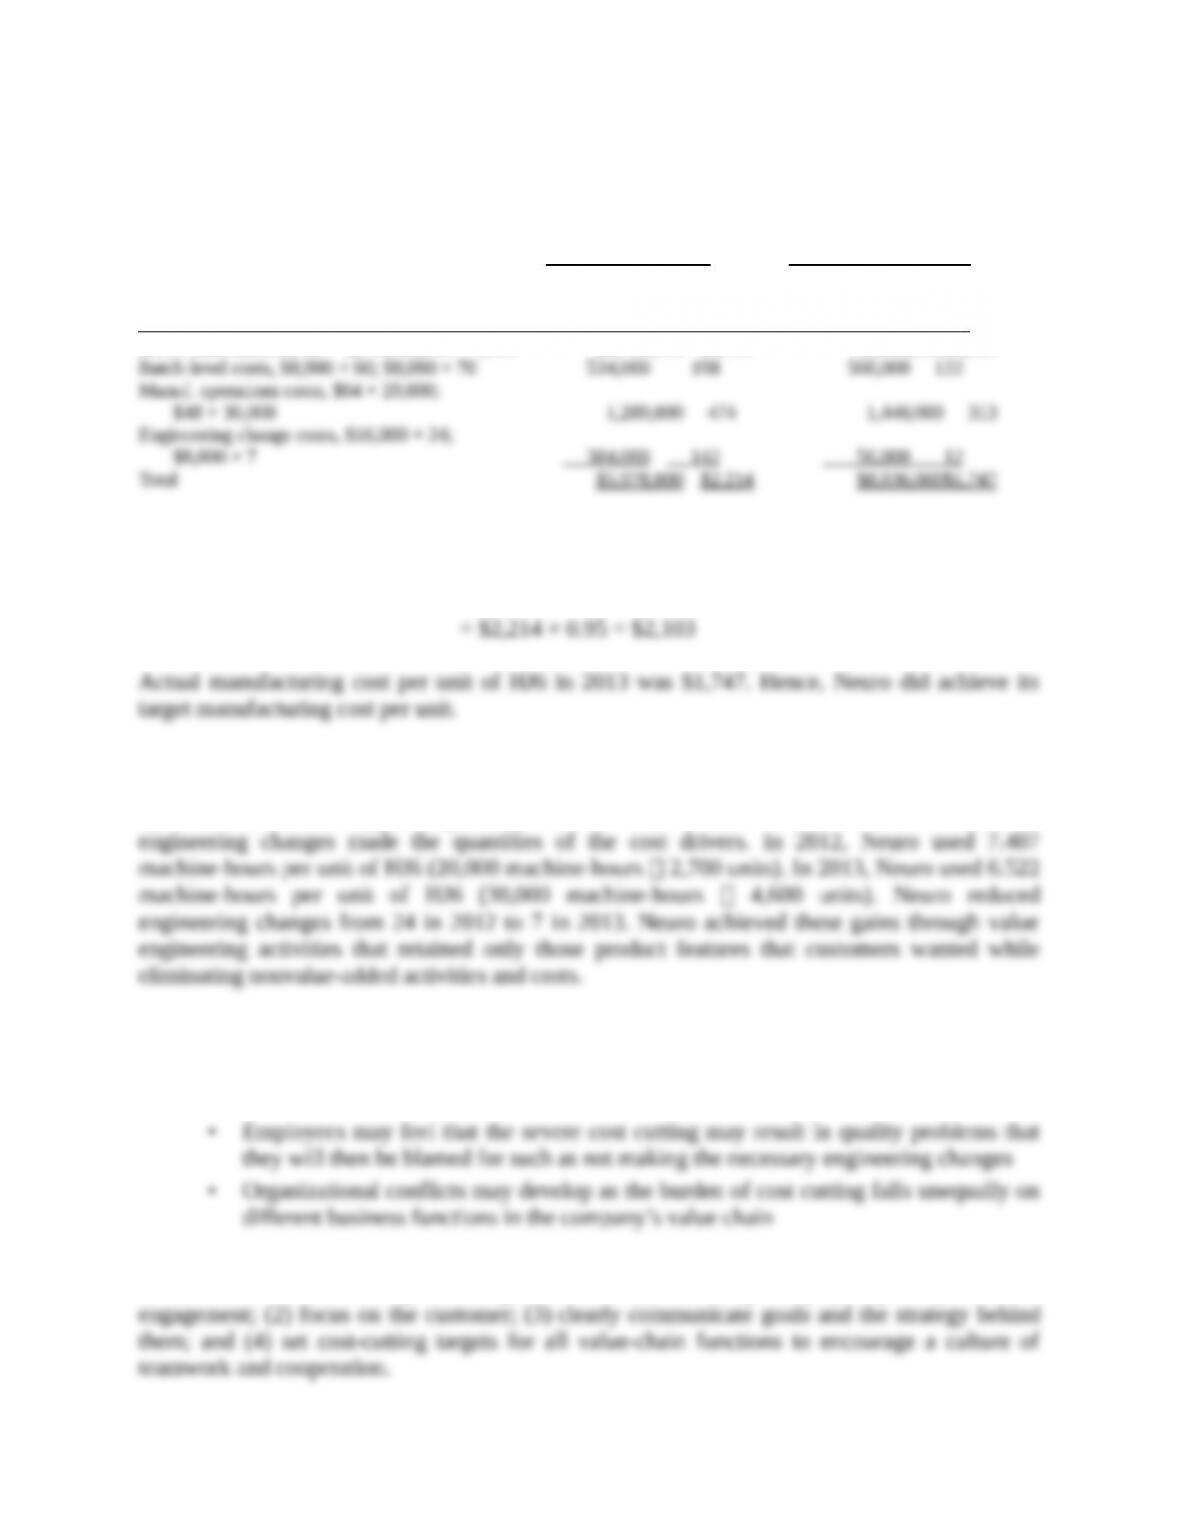
In spite of rising transportation costs and clerical wages, the company was able to reduce the cost
per audit in 2013. This was possible by reducing the number of miles driven per appointment from
11.7 miles (1,756 ÷ 150) in 2012 to 7.5 miles (1,327 ÷ 178) in 2013. This could be due to a
implementing a better scheduling system to maximize the number of appointments in a given area.
Also, the number of clerical hours per audit decreased from 8.12 hours (1,218 ÷ 150) in 2012 to
7.68 hours (1,367 ÷ 178) in 2013. This could be due to process improvements in preparing the
required forms. There is also a reduction in consultant labor hours and consultation labor cost per
audit. Presumably, there is no reduction in customer satisfaction.
4. The challenges Sun Systems may face in achieving their target cost include employee resistance
to changes in processes, unexpected increases in the cost of supplies, fuel, etc, and new compliance
requirements imposed from the federal and/or state governments that increase clerical time on each
audit. To overcome these challenges, Sun Systems managers should encourage employee
participation and celebrate small improvements toward achieving the target cost and set cost-
cutting targets after taking into account the external environment such as cost of supplies and new
compliance requirements. Managers should create a culture where employees are encouraged to
continuously improve the energy audit process.
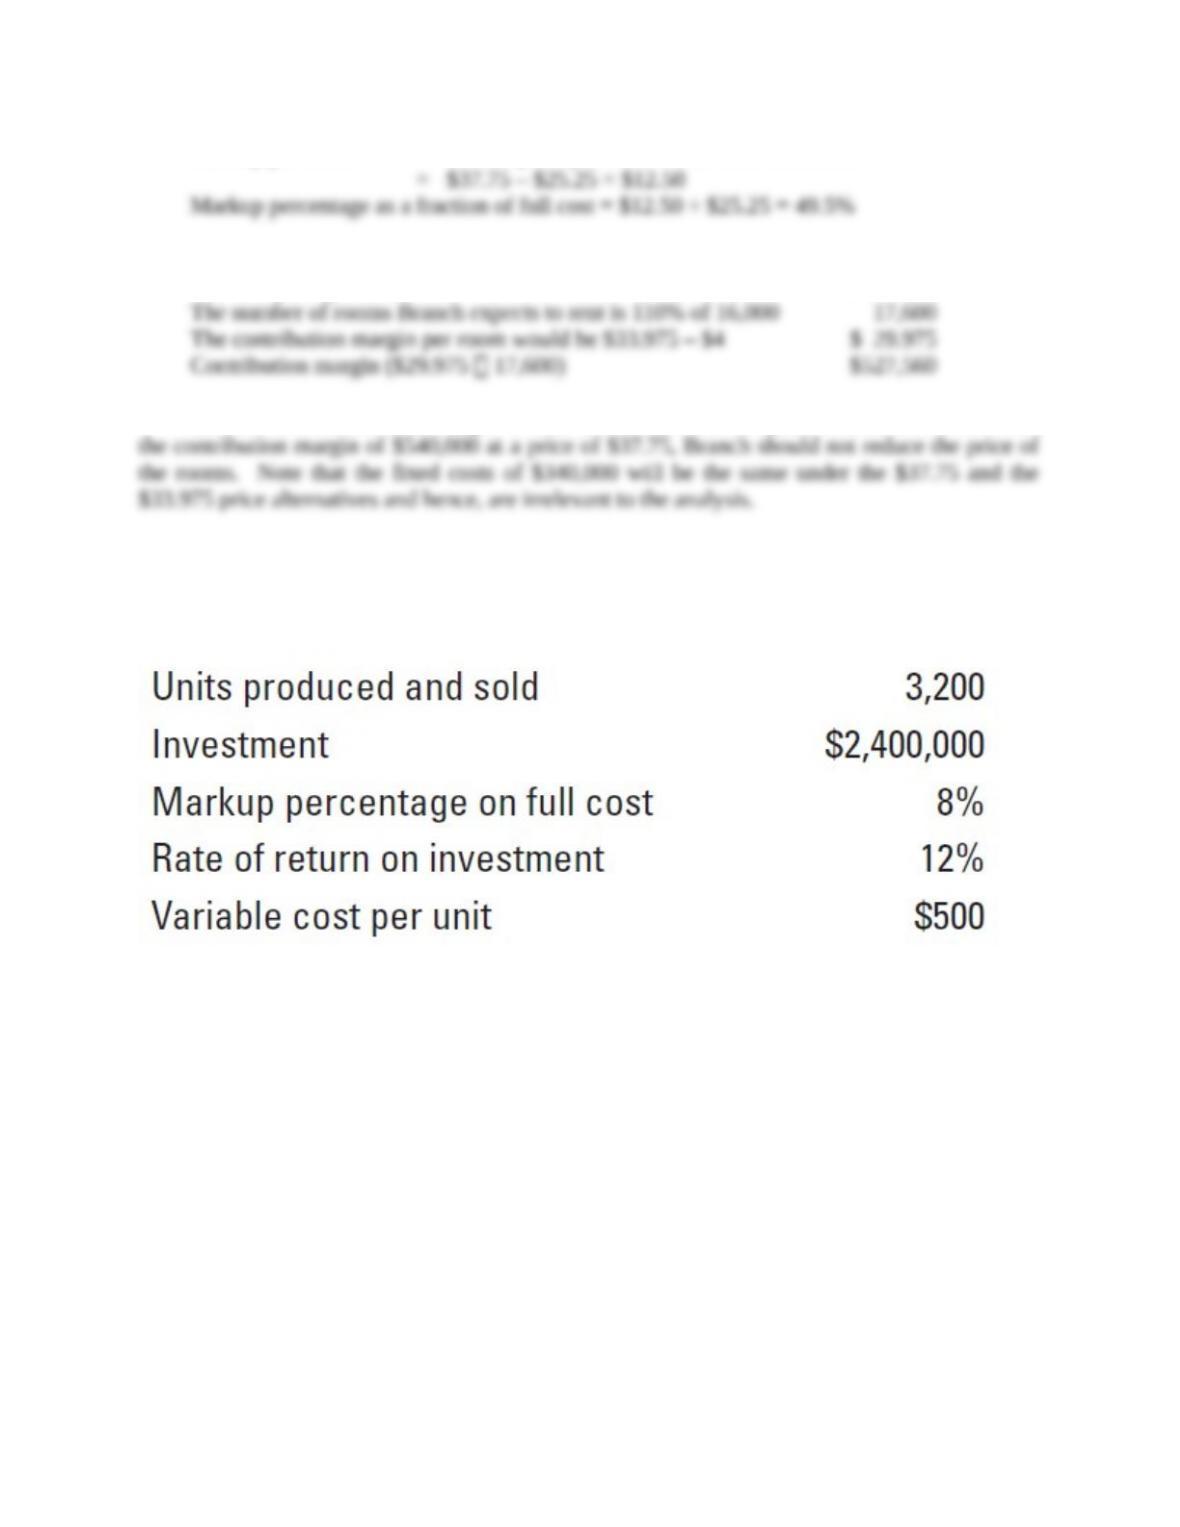
13-21 (20 min.) Cost-plus target return on investment pricing.
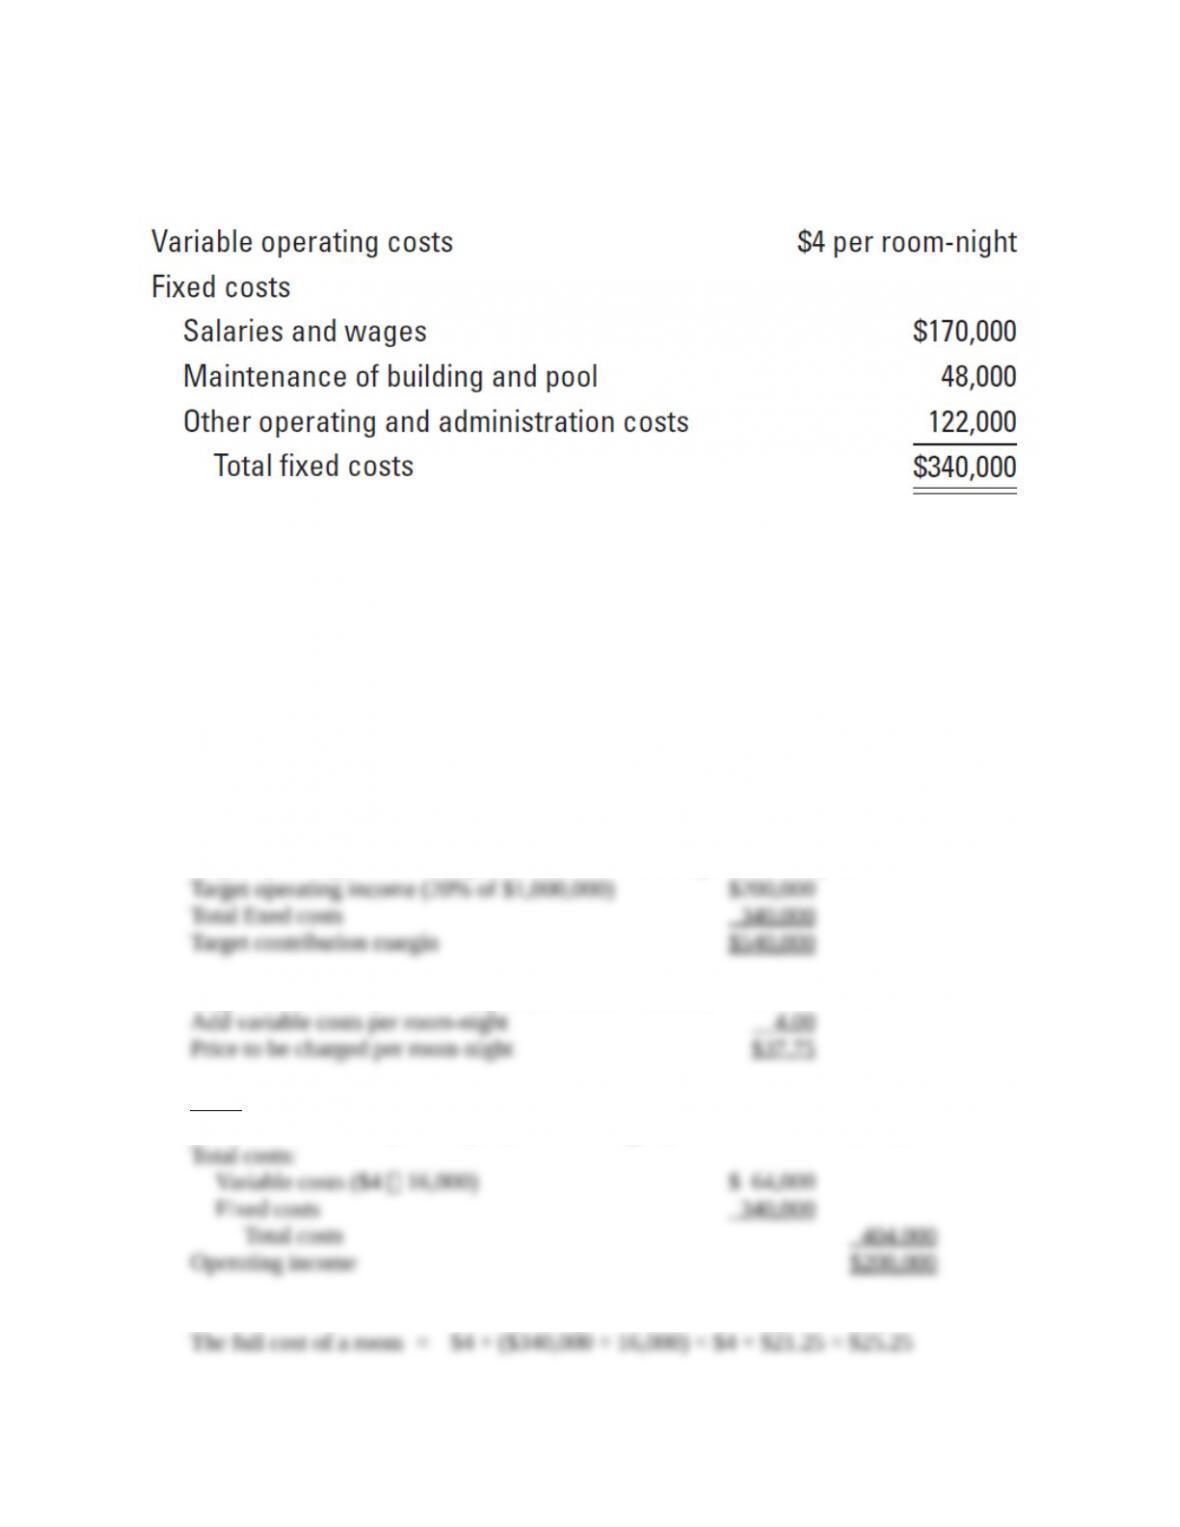
John Branch is the managing partner of a business that has just finished building a 60-room motel.
Branch anticipates that he will rent these rooms for 16,000 nights next year (or 16,000 room–
nights). All rooms are similar and will rent for the same price. Branch estimates the following
operating costs for next year:
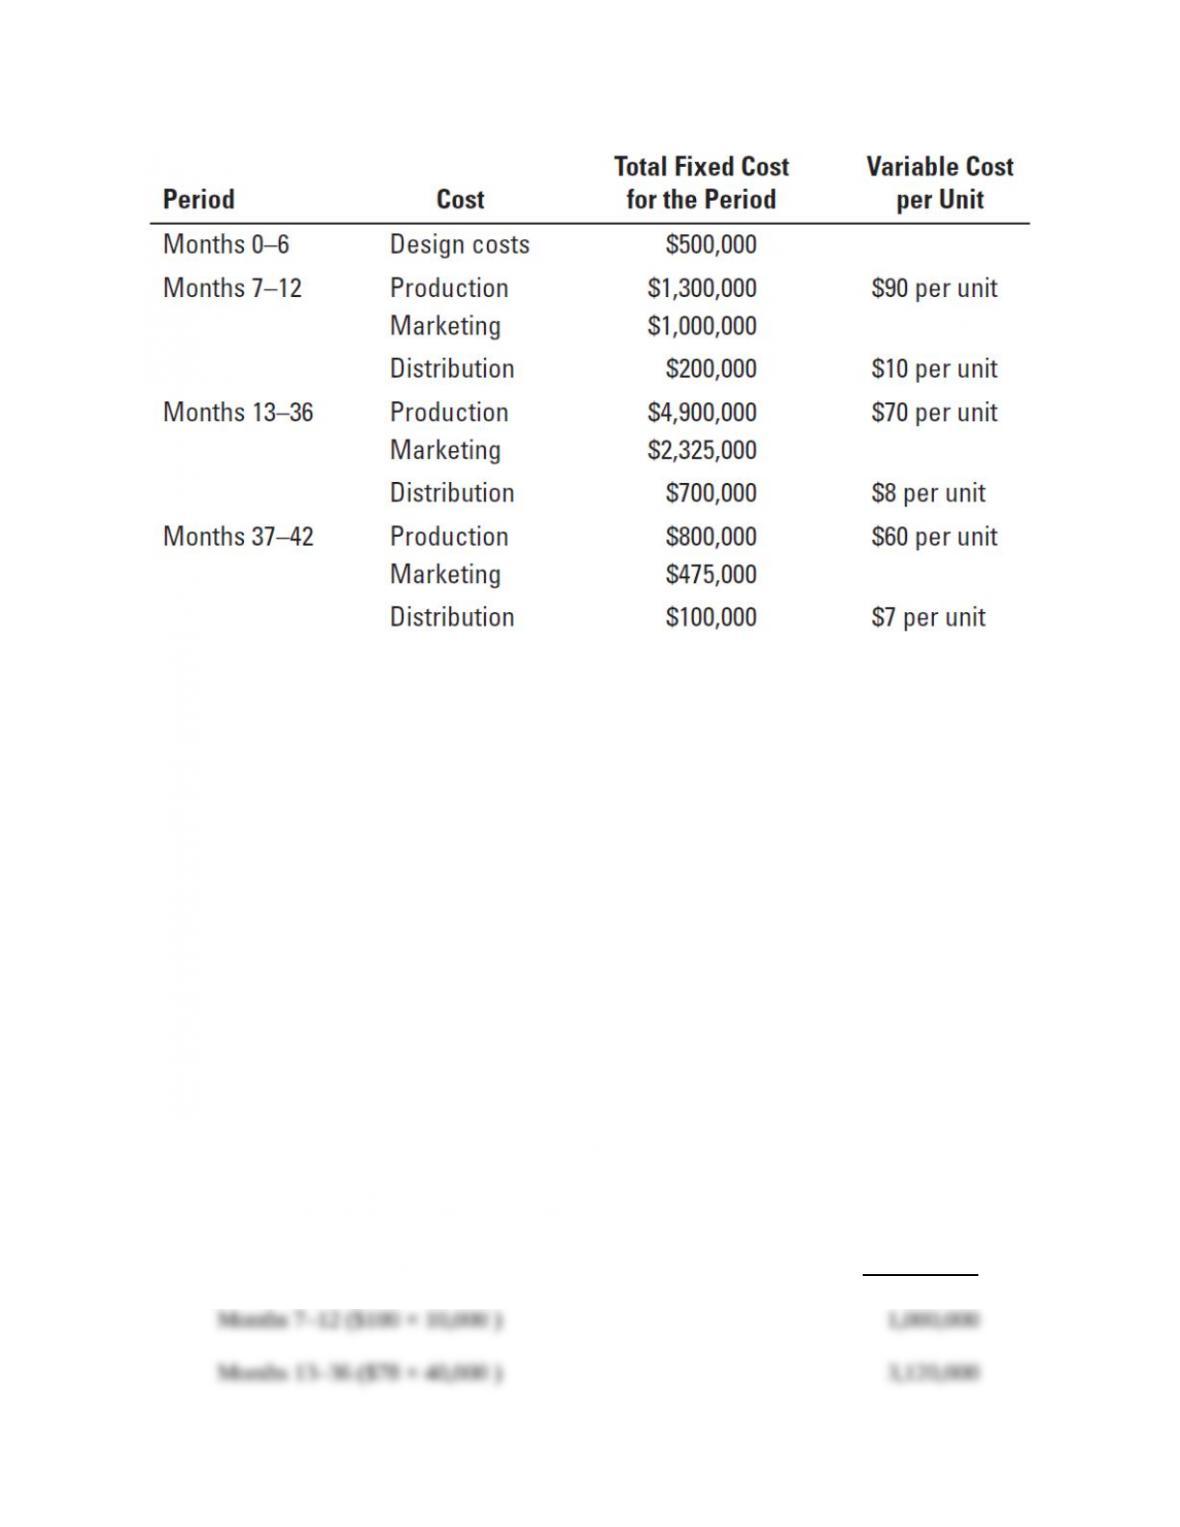
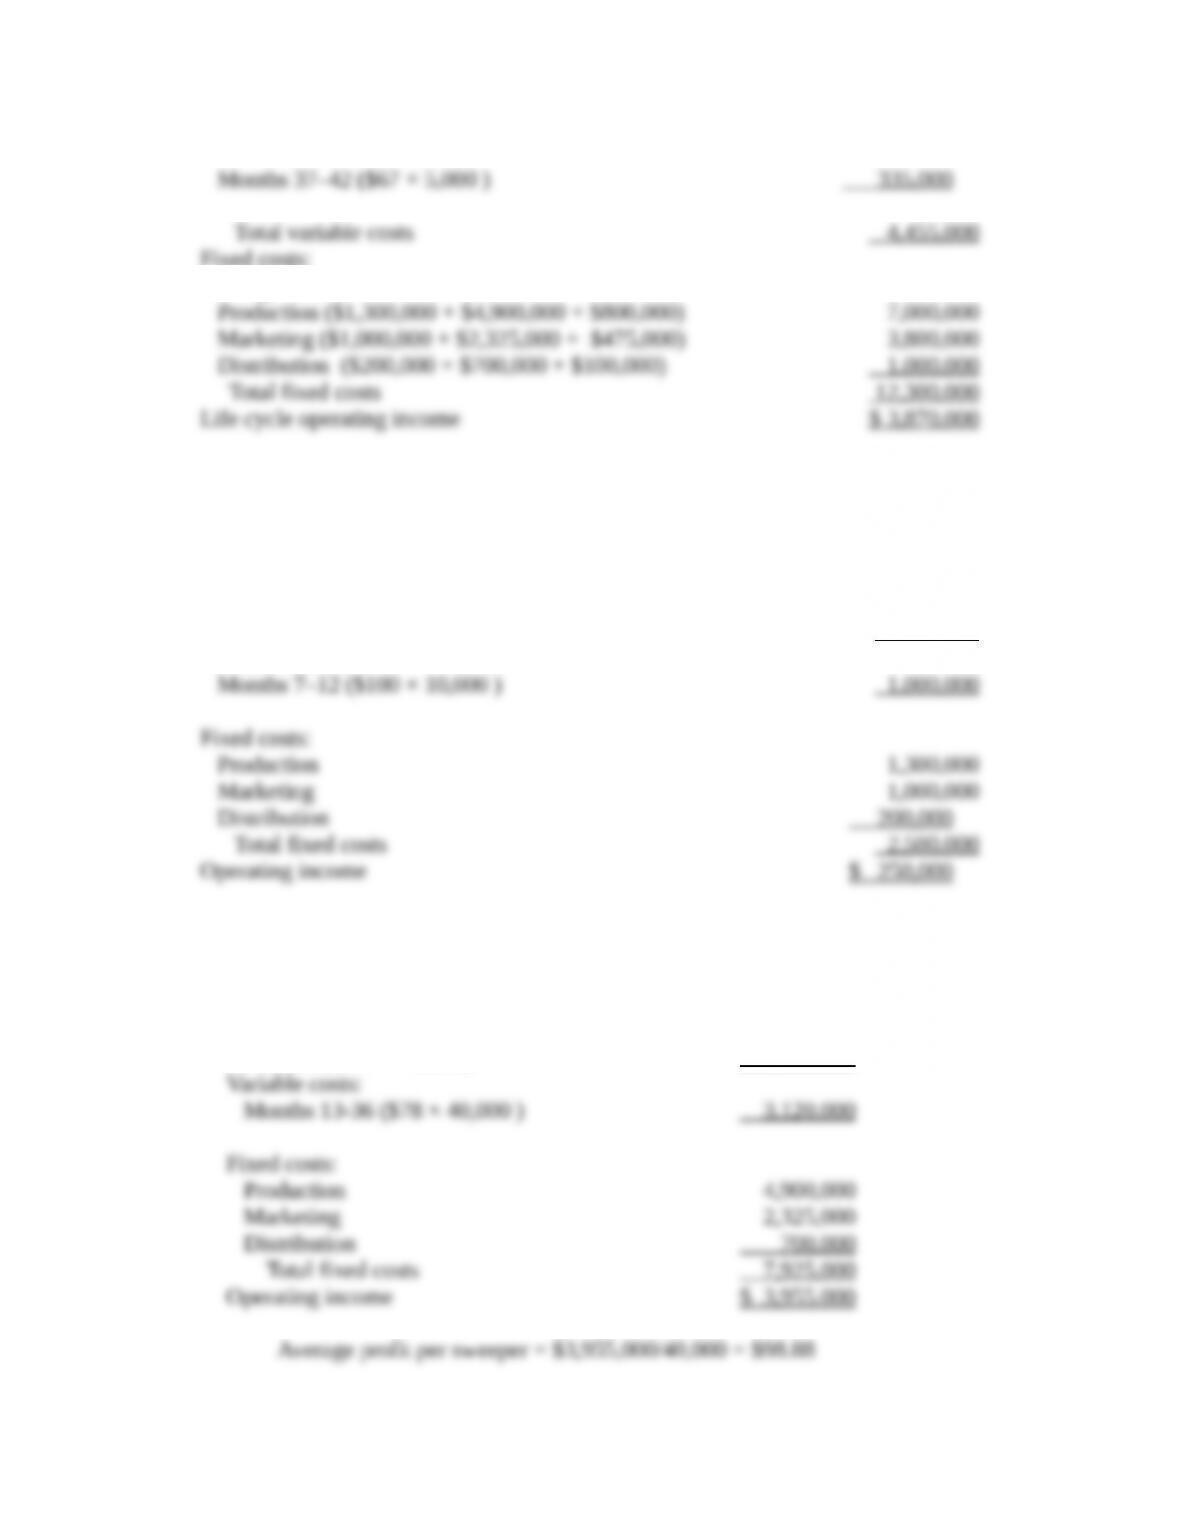
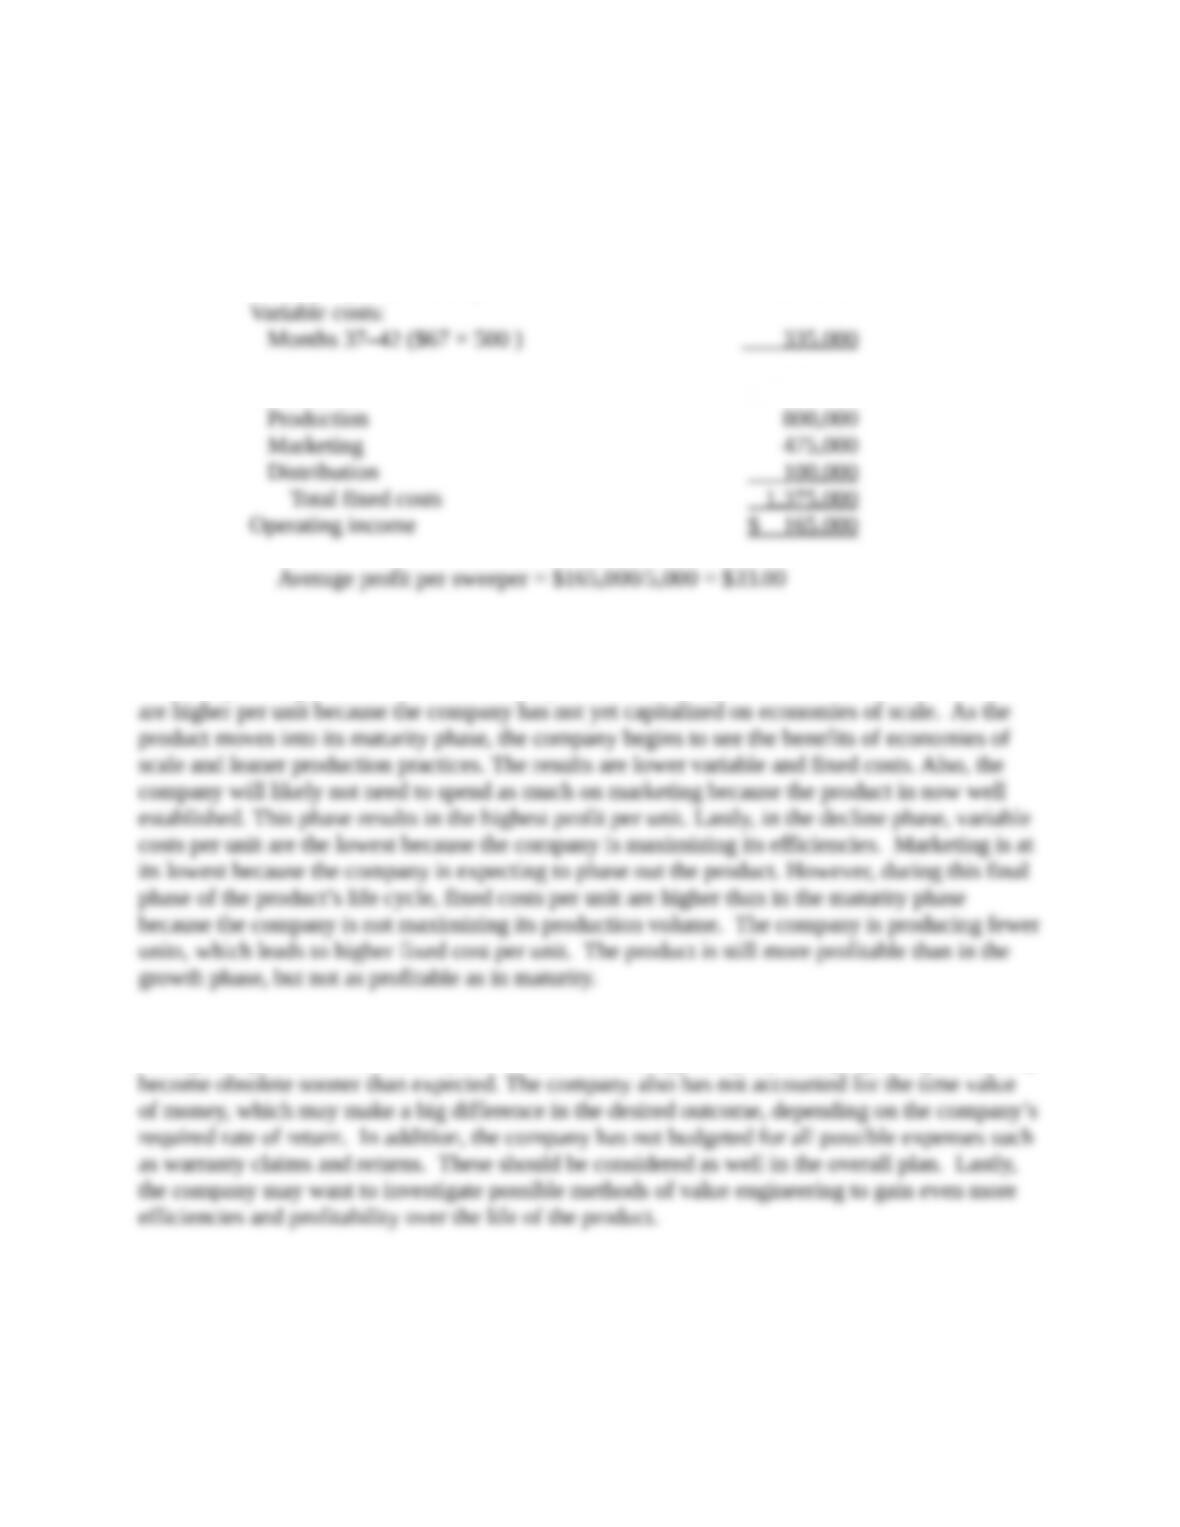
Months 37–42 ($67 × 5,000 )
335,000
Total variable costs
4,455,000
Fixed costs:
Design costs
500,000
Production ($1,300,000 + $4,900,000 + $800,000)
7,000,000
Marketing ($1,000,000 + $2,325,000 + $475,000)
3,800,000
Distribution ($200,000 + $700,000 + $100,000)
1,000,000
Total fixed costs
12,300,000
Life cycle operating income
$ 3,870,000
Average profit per sweeper = $3,870,000/(10,000 + 40,000 + 5,000) = $70.36
2.
Projected Life Cycle Income Statement (in 000s)
Months 7–12
Revenues ($375 × 10,000)
$3,750,000
Variable costs:
Months 7–12 ($100 × 10,000 )
1,000,000
Fixed costs:
Production
1,300,000
Marketing
1,000,000
Distribution
200,000
Total fixed costs
2,500,000
Operating income
$ 250,000
Average profit per sweeper = $250,000/10,000 = $25
Projected Life Cycle Income Statement (in 000s)
Months 13–36
Revenues ($375 × 40,000)
$15,000,000
Variable costs:
Months 13-36 ($78 × 40,000 )
3,120,000
Fixed costs:
Production
4,900,000
Marketing
2,325,000
Distribution
700,000
Total fixed costs
7,925,000
Operating income
$ 3,955.000
Average profit per sweeper = $3,955,000/40,000 = $98.88
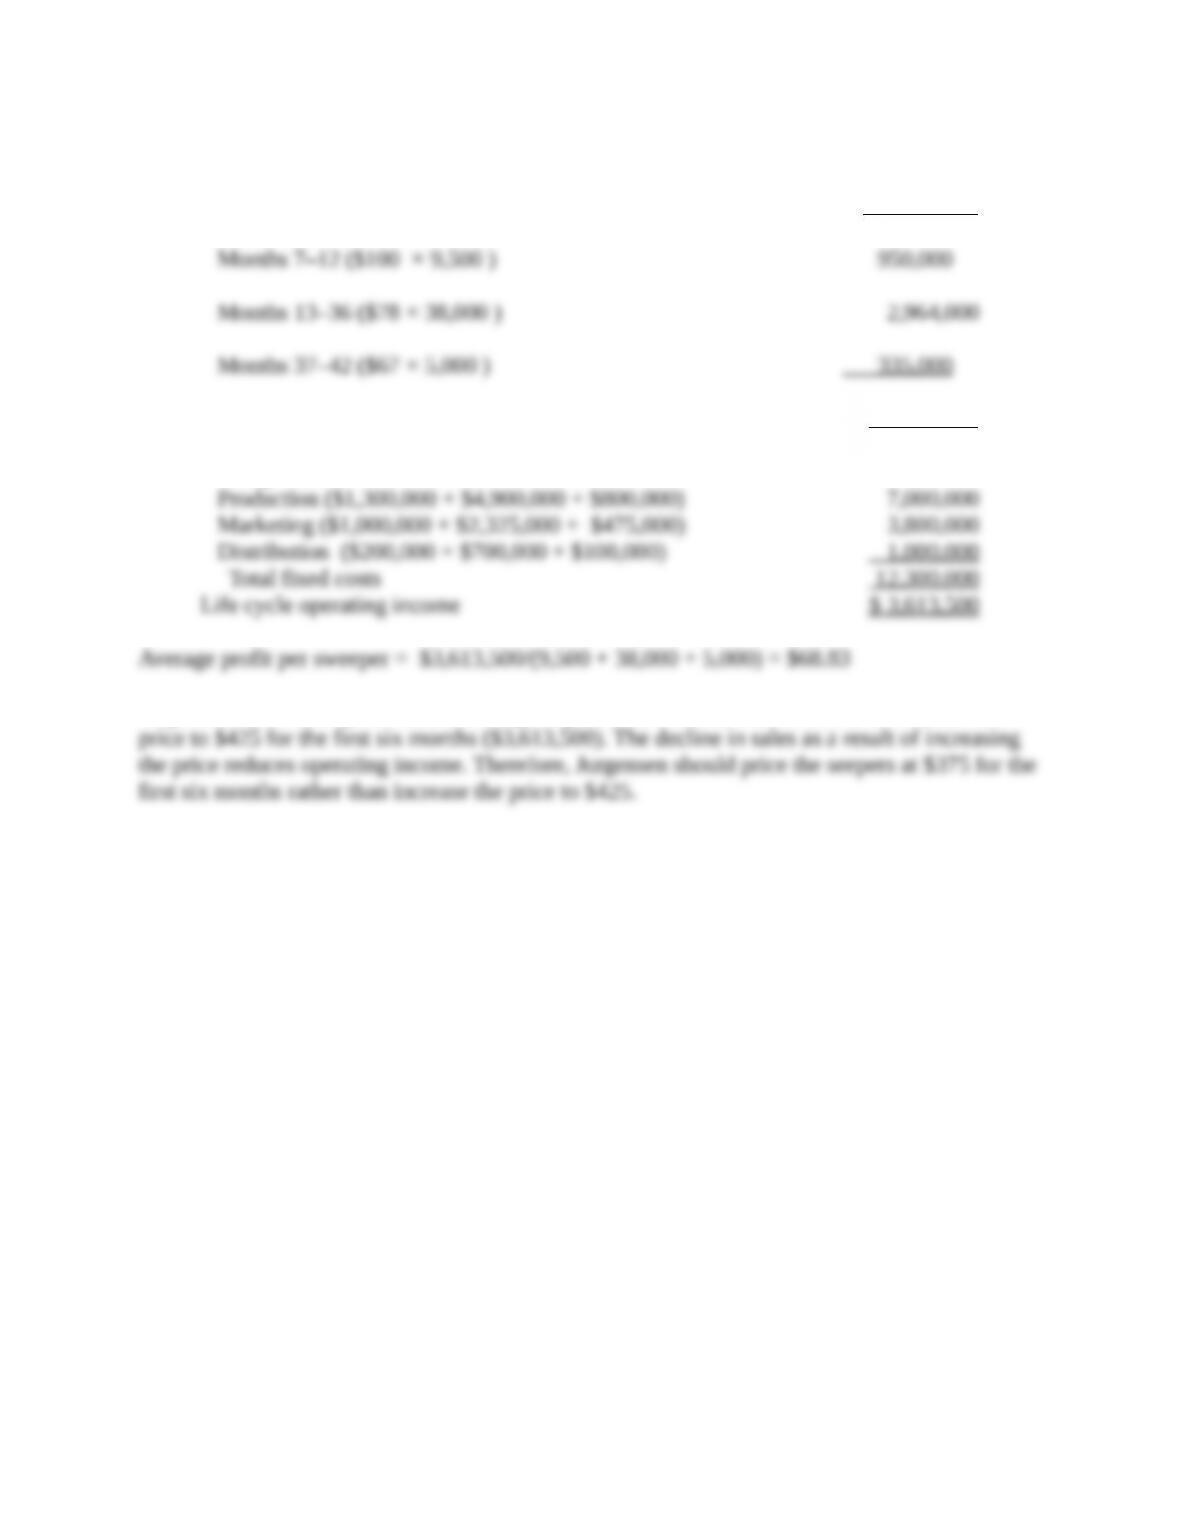
Projected Life Cycle Income Statement
Revenues [$425 × 9,500 + $375 × (38,000 + 5,000)]
$20,162,500
Variable costs:
Months 7–12 ($100 × 9,500 )
950,000
Months 13–36 ($78 × 38,000 )
2,964,000
Months 37–42 ($67 × 5,000 )
335,000
Total variable costs
4,249,000
Fixed costs:
Design costs
500,000
Production ($1,300,000 + $4,900,000 + $800,000)
7,000,000
Marketing ($1,000,000 + $2,325,000 + $475,000)
3,800,000
Distribution ($200,000 + $700,000 + $100,000)
1,000,000
Total fixed costs
12,300,000
Life cycle operating income
$ 3,613,500
Average profit per sweeper = $3,613,500/(9,500 + 38,000 + 5,000) = $68.83
Jurgensen earns more profit under its original plan ($3,870,000) than it does if it increases the
price to $425 for the first six months ($3,613,500). The decline in sales as a result of increasing
the price reduces operating income. Therefore, Jurgensen should price the seepers at $375 for the
first six months rather than increase the price to $425.