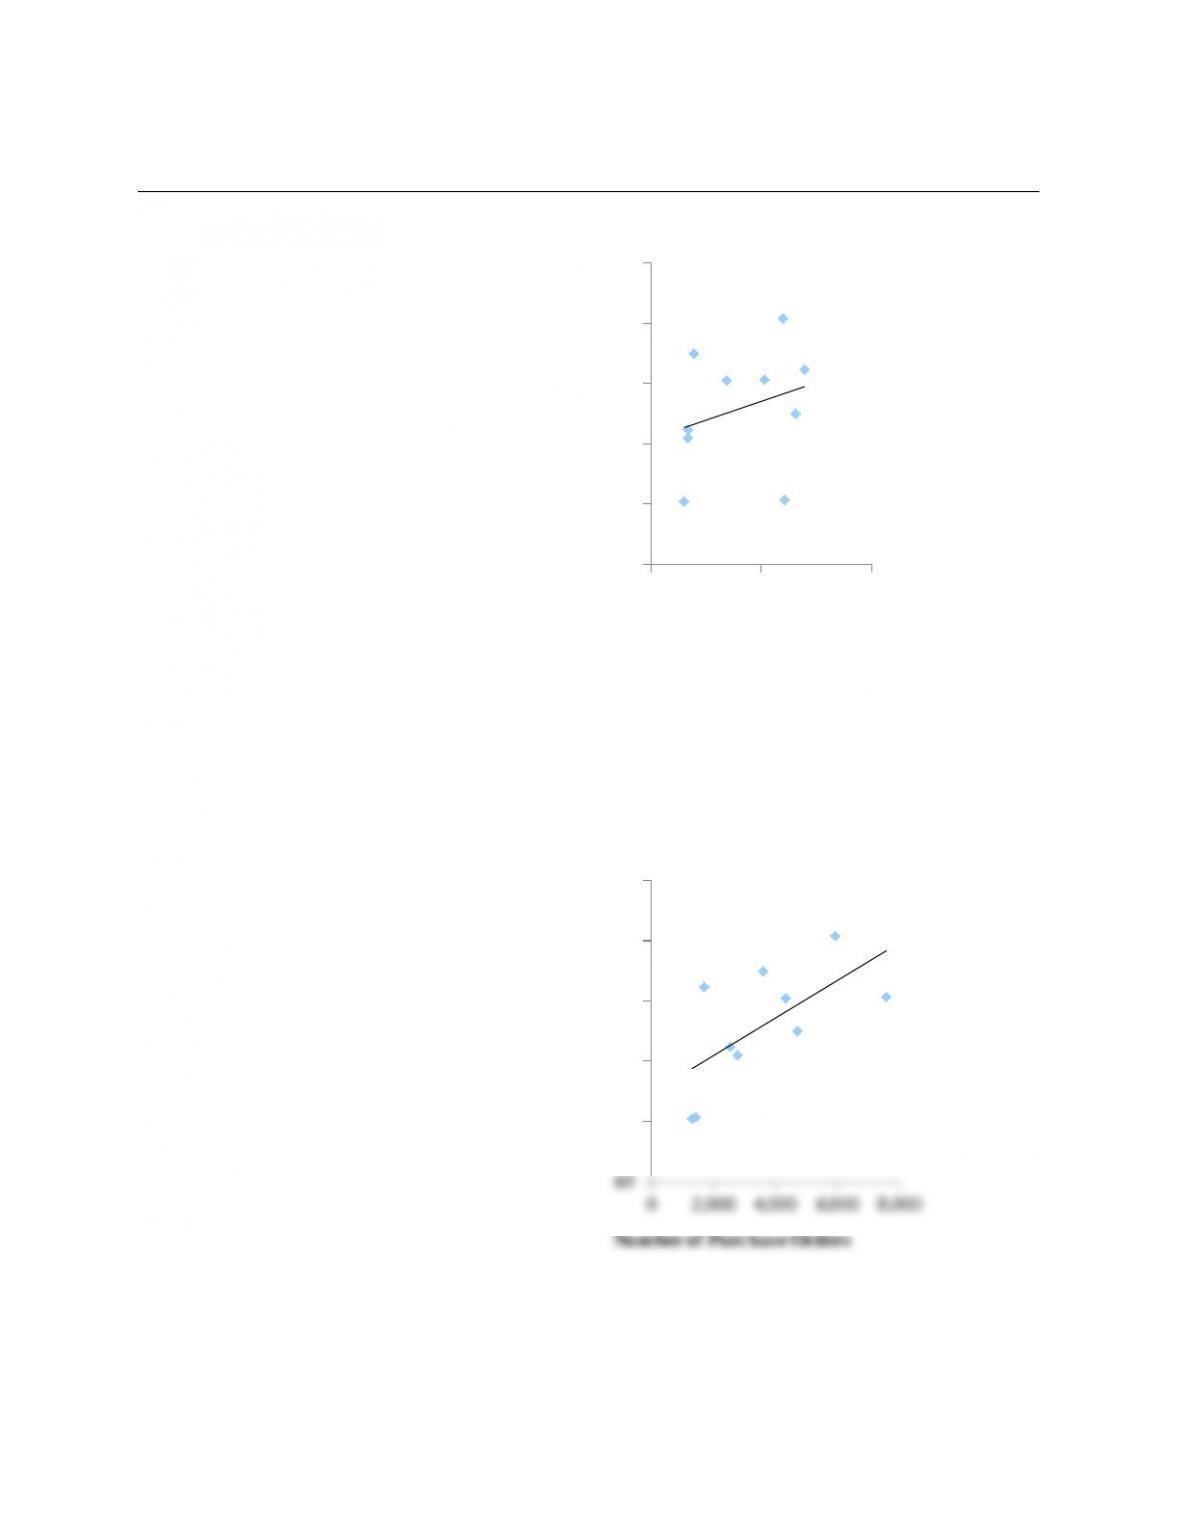
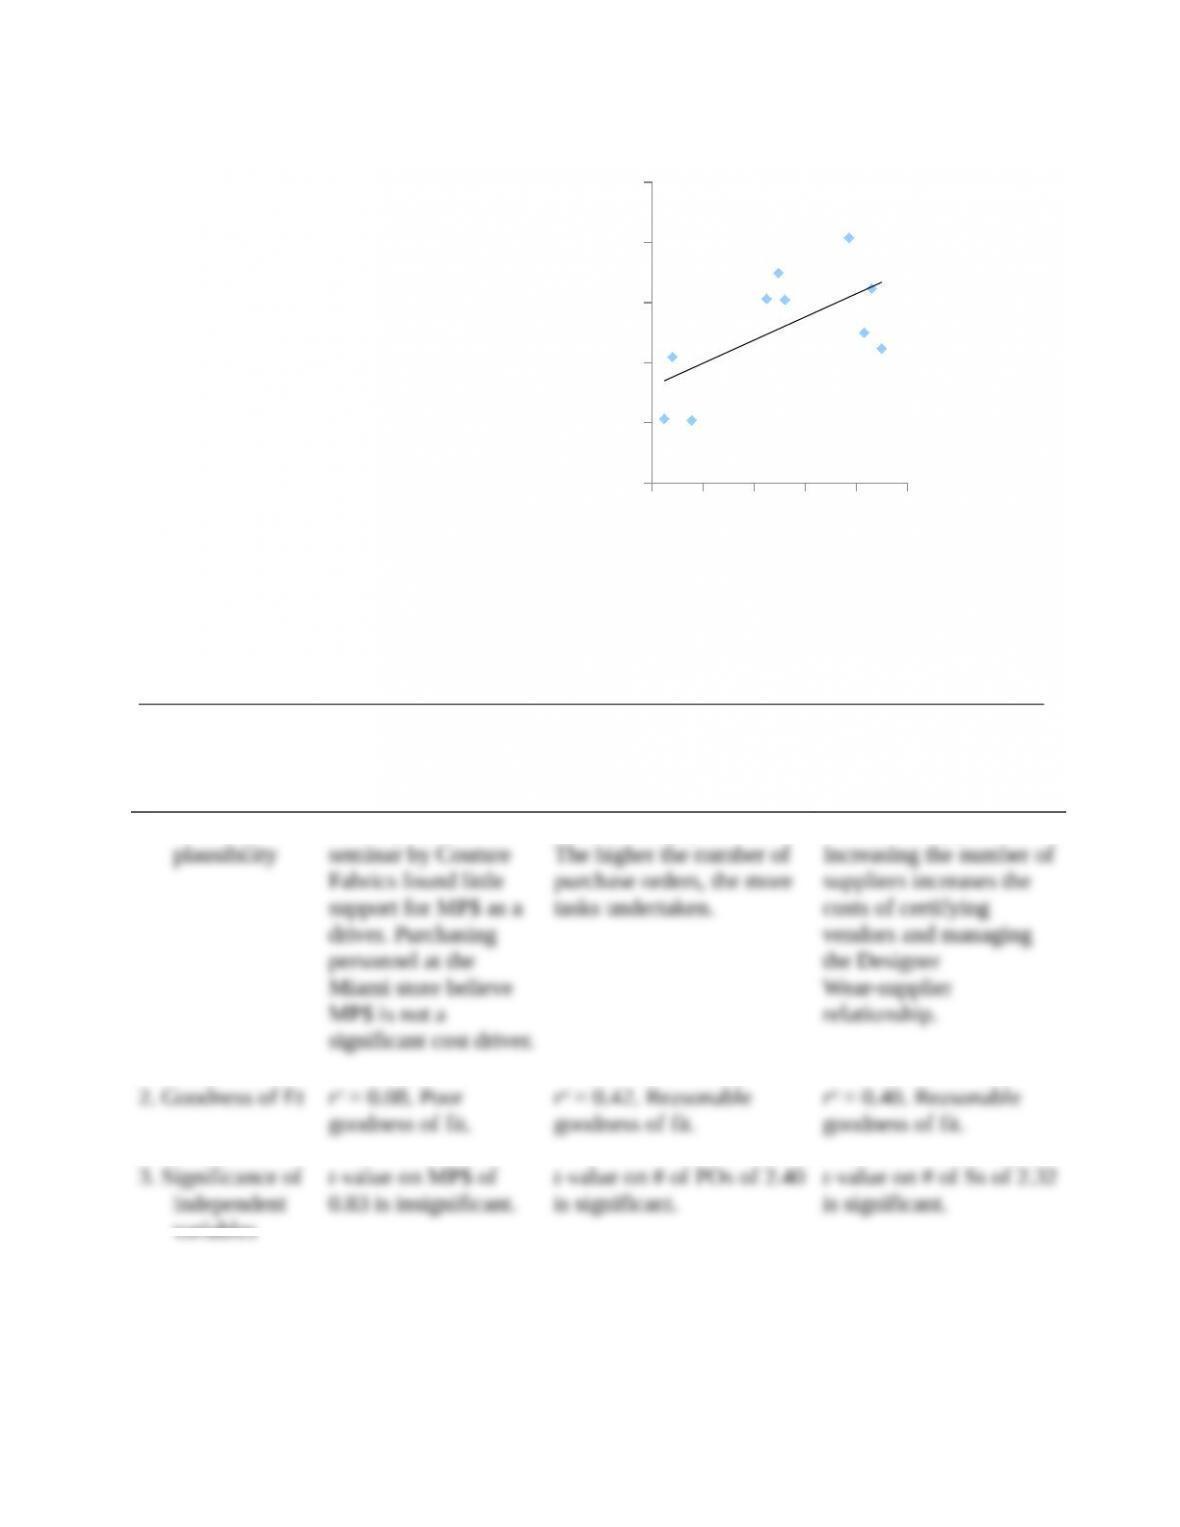
y = 3848x + 802629
R² = 0.4018
$0
$500,000
$1,000,000
$1,500,000
$2,000,000
$2,500,000
050 100 150 200 250
Purchasing Department Costs
Number of Suppliers
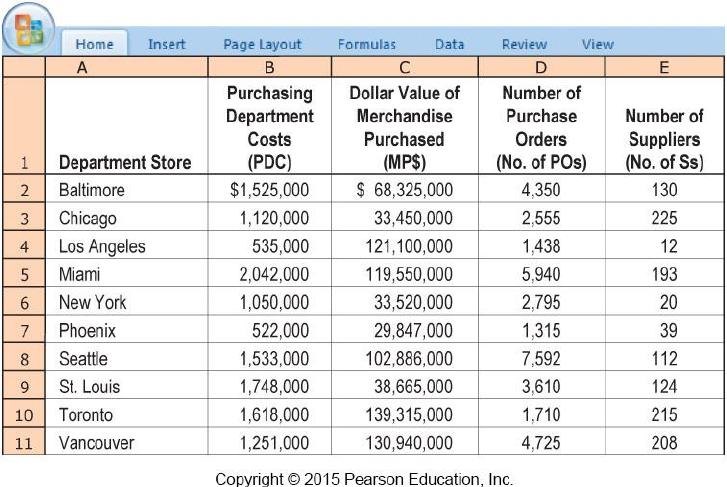
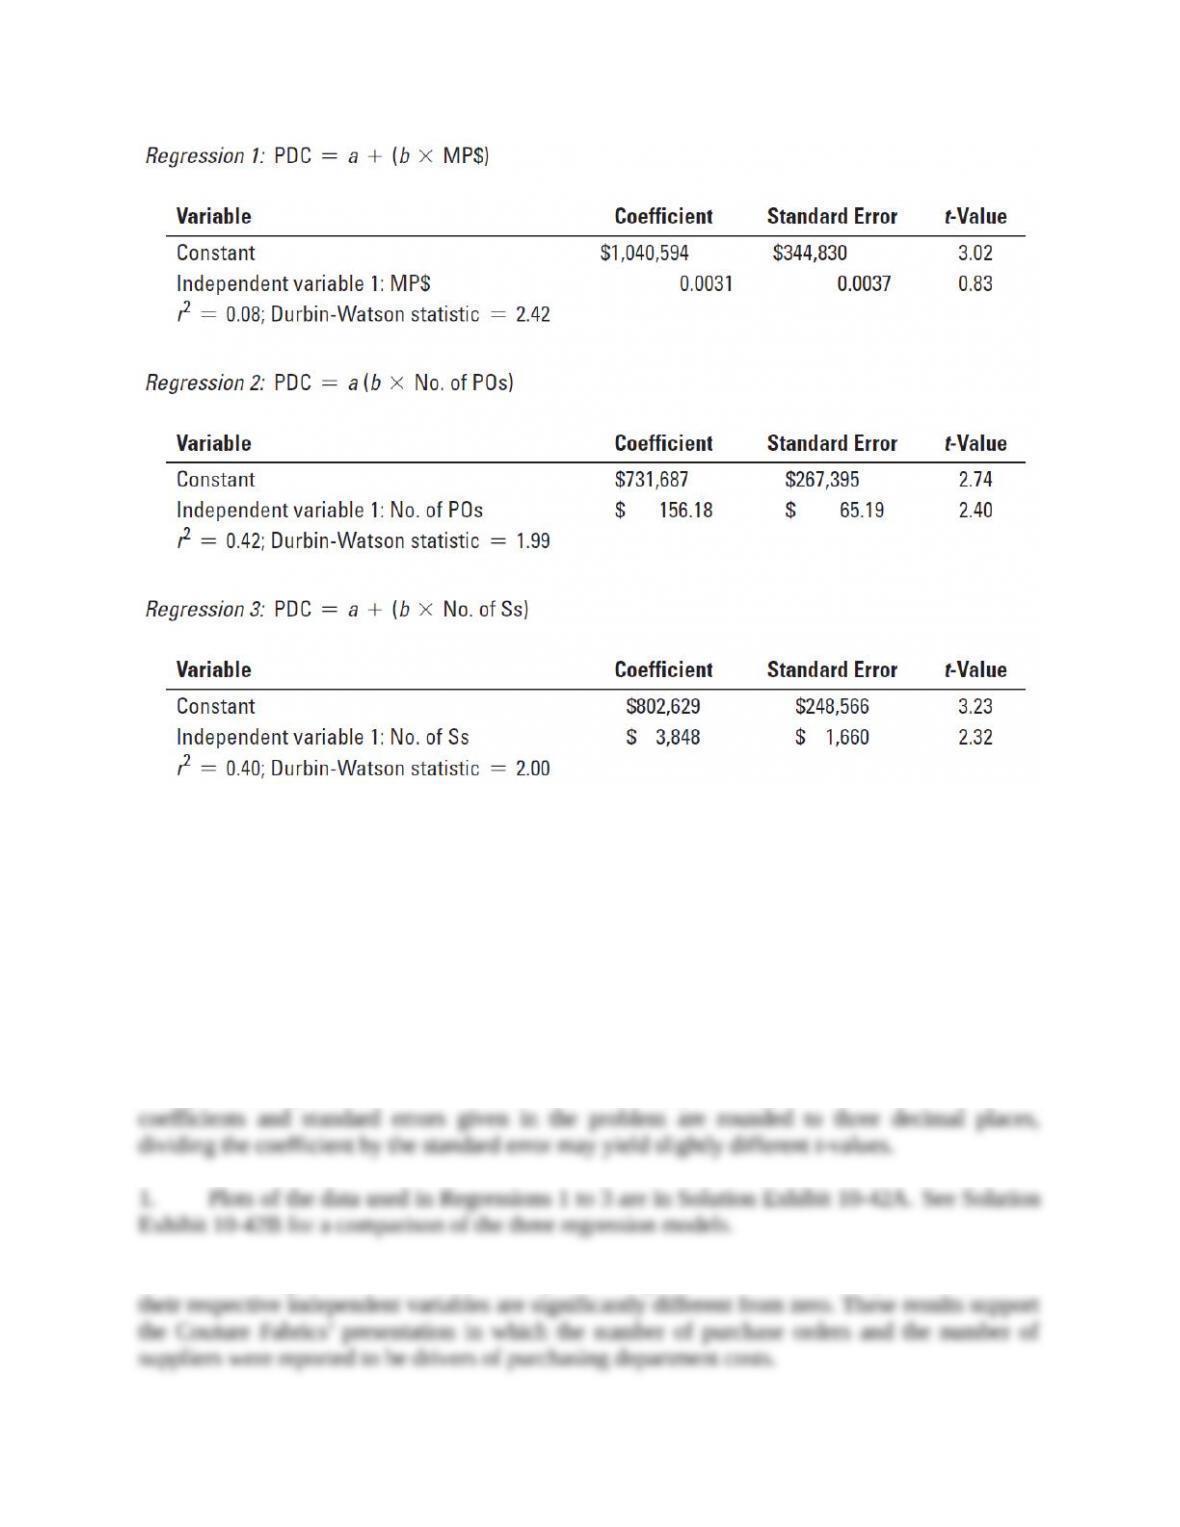
Criterion
Regression 1
PDC = a + (b MP$)
Regression 2
PDC = a + (b # of POs)
Regression 3
PDC = a + (b # of Ss)
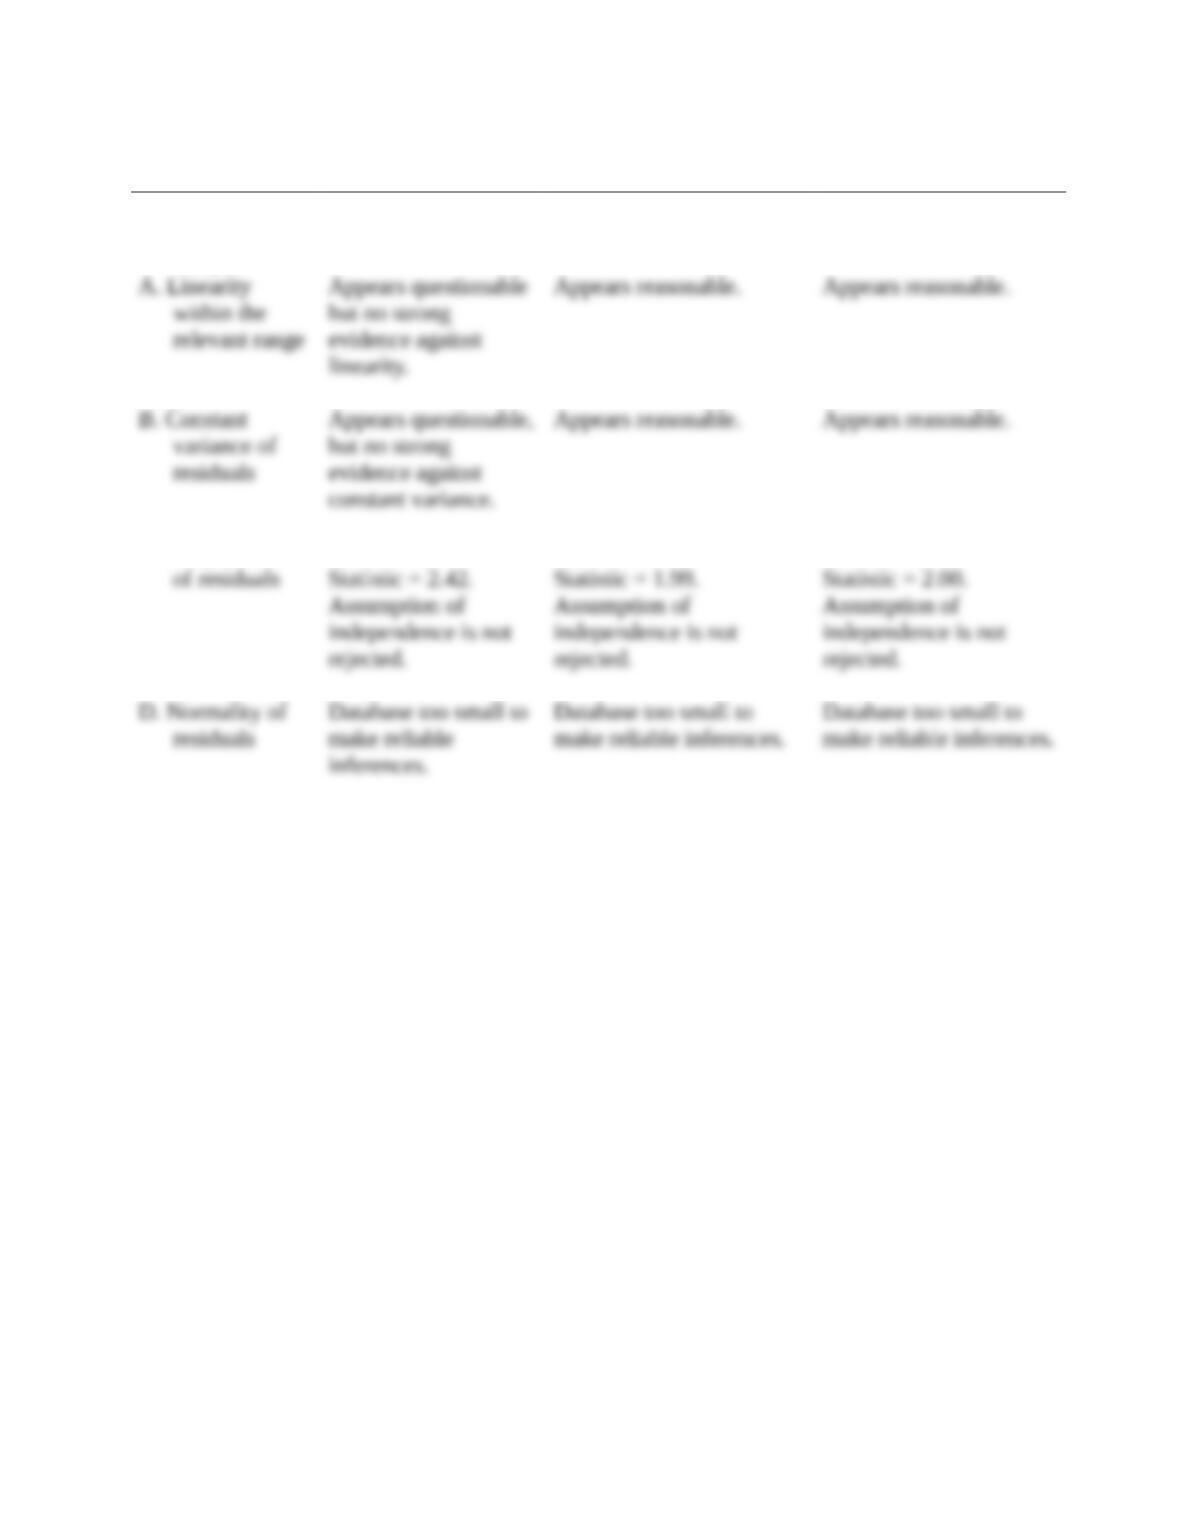
4. Specification
analysis
A. Linearity
within the
relevant range
Appears questionable
but no strong evidence
against linearity.
Appears reasonable.
Appears reasonable.
B. Constant
variance of
residuals
Appears questionable,
but no strong evidence
against constant
variance.
Appears reasonable.
Appears reasonable.
C. Independence
of residuals
Durbin-Watson
Statistic = 2.42.
Assumption of
independence is not
rejected.
Durbin-Watson
Statistic = 1.99.
Assumption of
independence is not
rejected.
Durbin-Watson
Statistic = 2.00.
Assumption of
independence is not
rejected.
D. Normality of
residuals
Database too small to
make reliable
inferences.
Database too small to
make reliable inferences.
Database too small to
make reliable inferences.
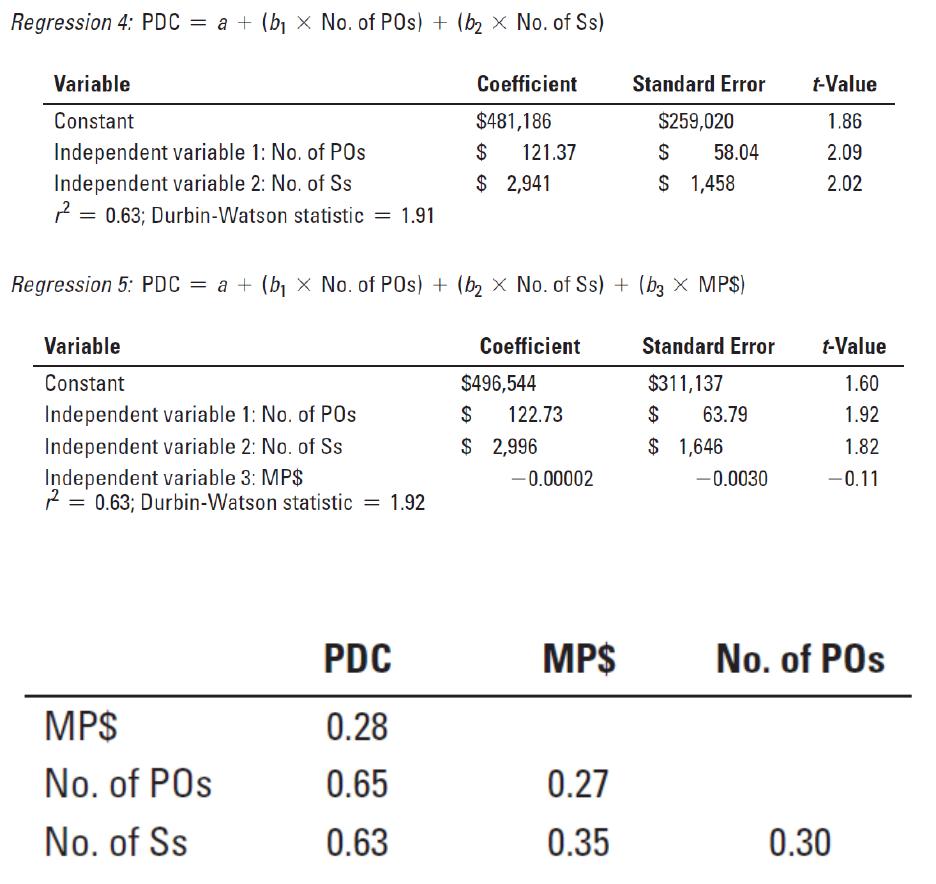
10-43 (30–40 min.) Purchasing Department cost drivers, multiple regression analysis
(continuation of 10-42).
Barry Lee decides that the simple regression analysis used in Problem 10–42 could be extended to
a multiple regression analysis. He finds the following results for two multiple regression analyses: