CHAPTER 8 APPENDIX B
BREAK-EVEN ANALYSIS (VOLUME-COST-PROFIT)
QUESTIONS
1. Volume-cost-profit (break-even) analysis ordinarily utilizes straight-line cost curves. Thus it
Since V-C-P analysis also utilizes a straight line revenue curve, it does not identify a maximum
profit. It shows profit increasing as a result of increases in quantity above the break-even point.
2. It analyzes short-run situations since it assumes the presence of fixed costs.
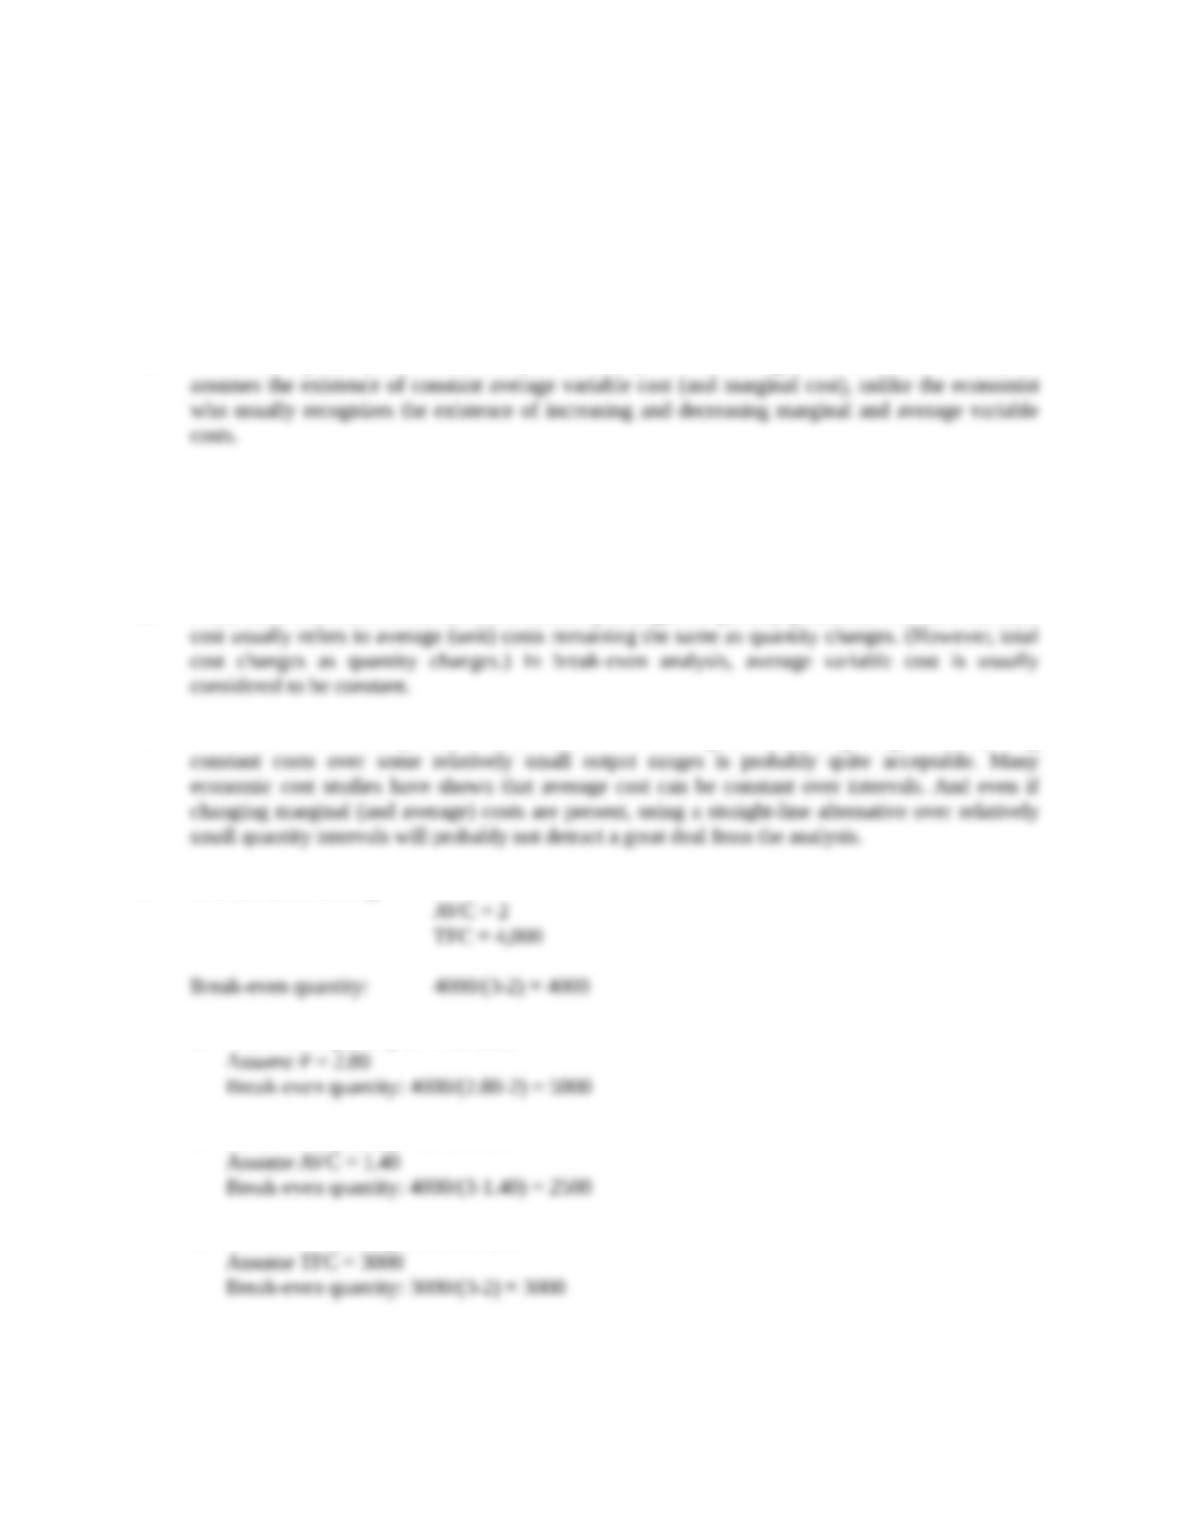
3. Fixed costs are those which are not affected by changes in quantity produced. The term constant
4. While economists usually assume the existence of increasing and decreasing marginal costs, using
5. Assume the following: P = 3
a. Break-even quantity will increase.
b. Break-even quantity will decrease.
c. Break-even quantity will decrease.
Copyright © 2014 Pearson Education, Inc.
Break-Even Analysis 85
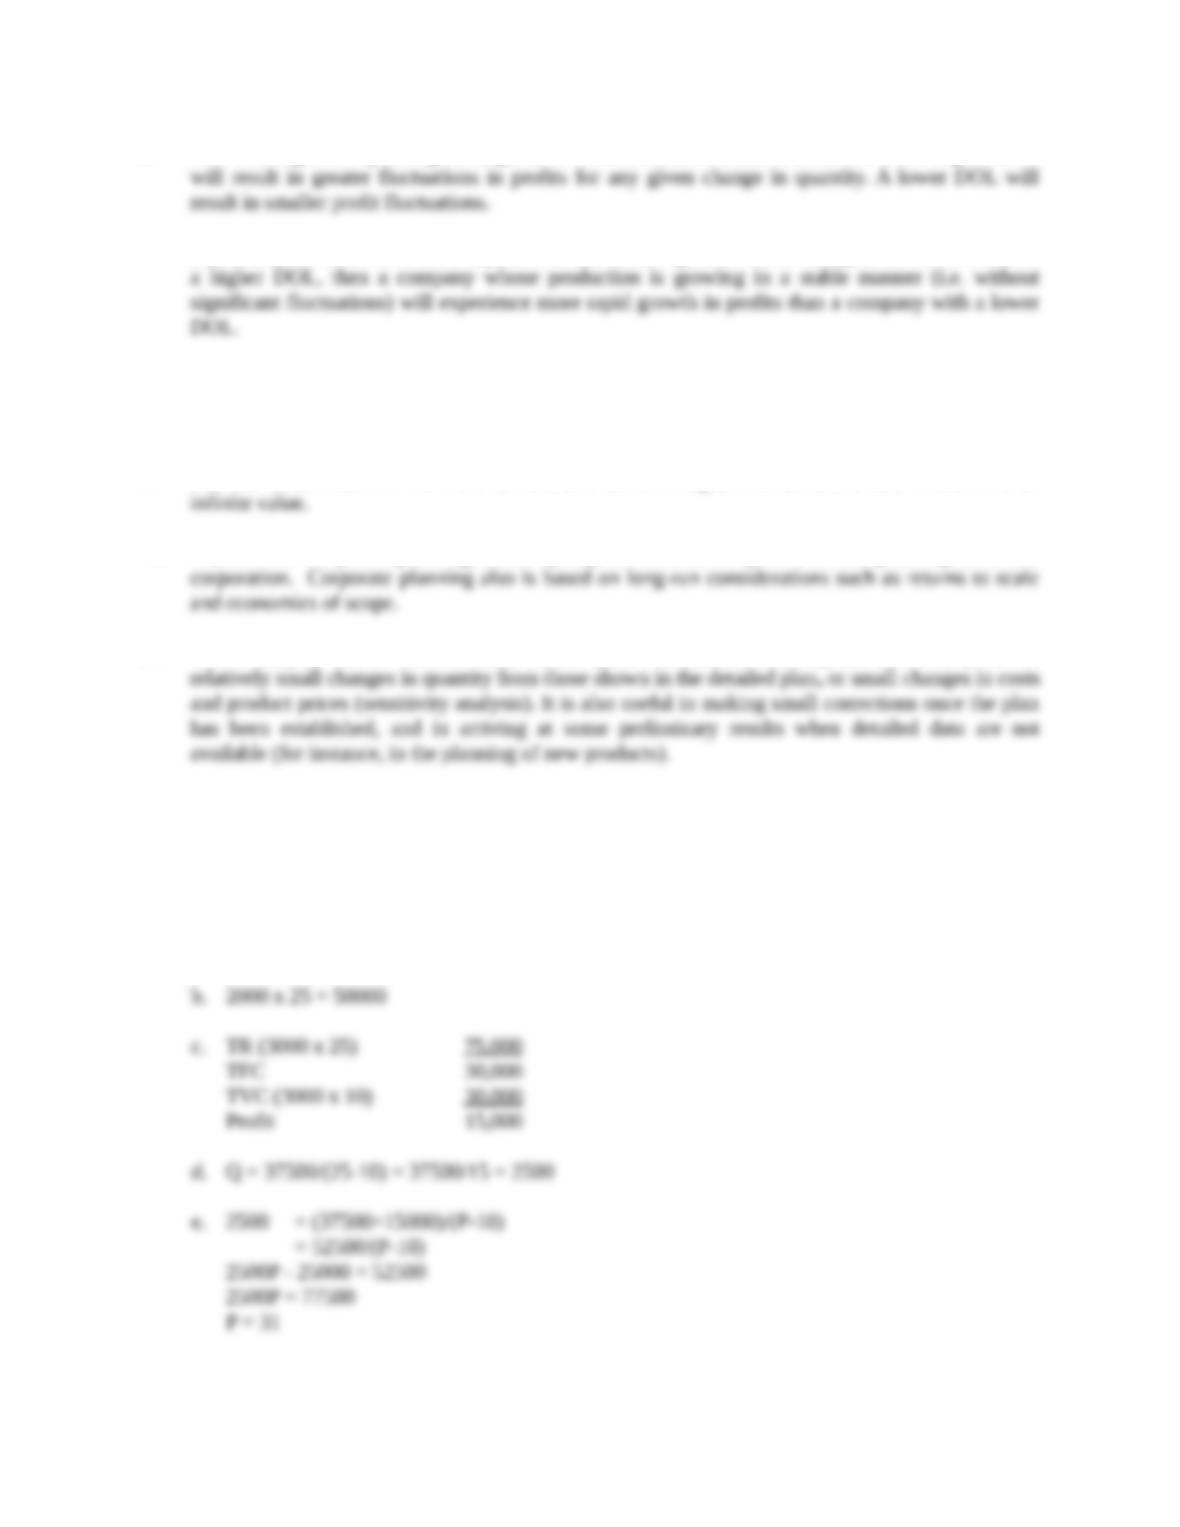
6. Yes. The degree of operating leverage can be defined as a measure of business risk. A higher DOL
7. It probably could afford to have a plant with relatively high fixed costs. If higher fixed costs lead to
8. a. Add the required profit to the total fixed costs in the numerator of the formula.
b. Add the required unit profit to the average variable cost in the denominator of the formula.
9. No. The denominator of the DOL formula at break-even equals zero, and the ratio would have an
10. No, it is not. Corporate planning ordinarily requires detailed analysis of all component parts of the
11. V-C-P analysis can be used to make rather quick calculations showing the effect on profit of
PROBLEMS
1. a. Q = 30000/(25-10) = 30000/15 = 2000
2. a. 5000 = 50000/(P-20)
Copyright © 2014 Pearson Education, Inc.
Break-Even Analysis 86
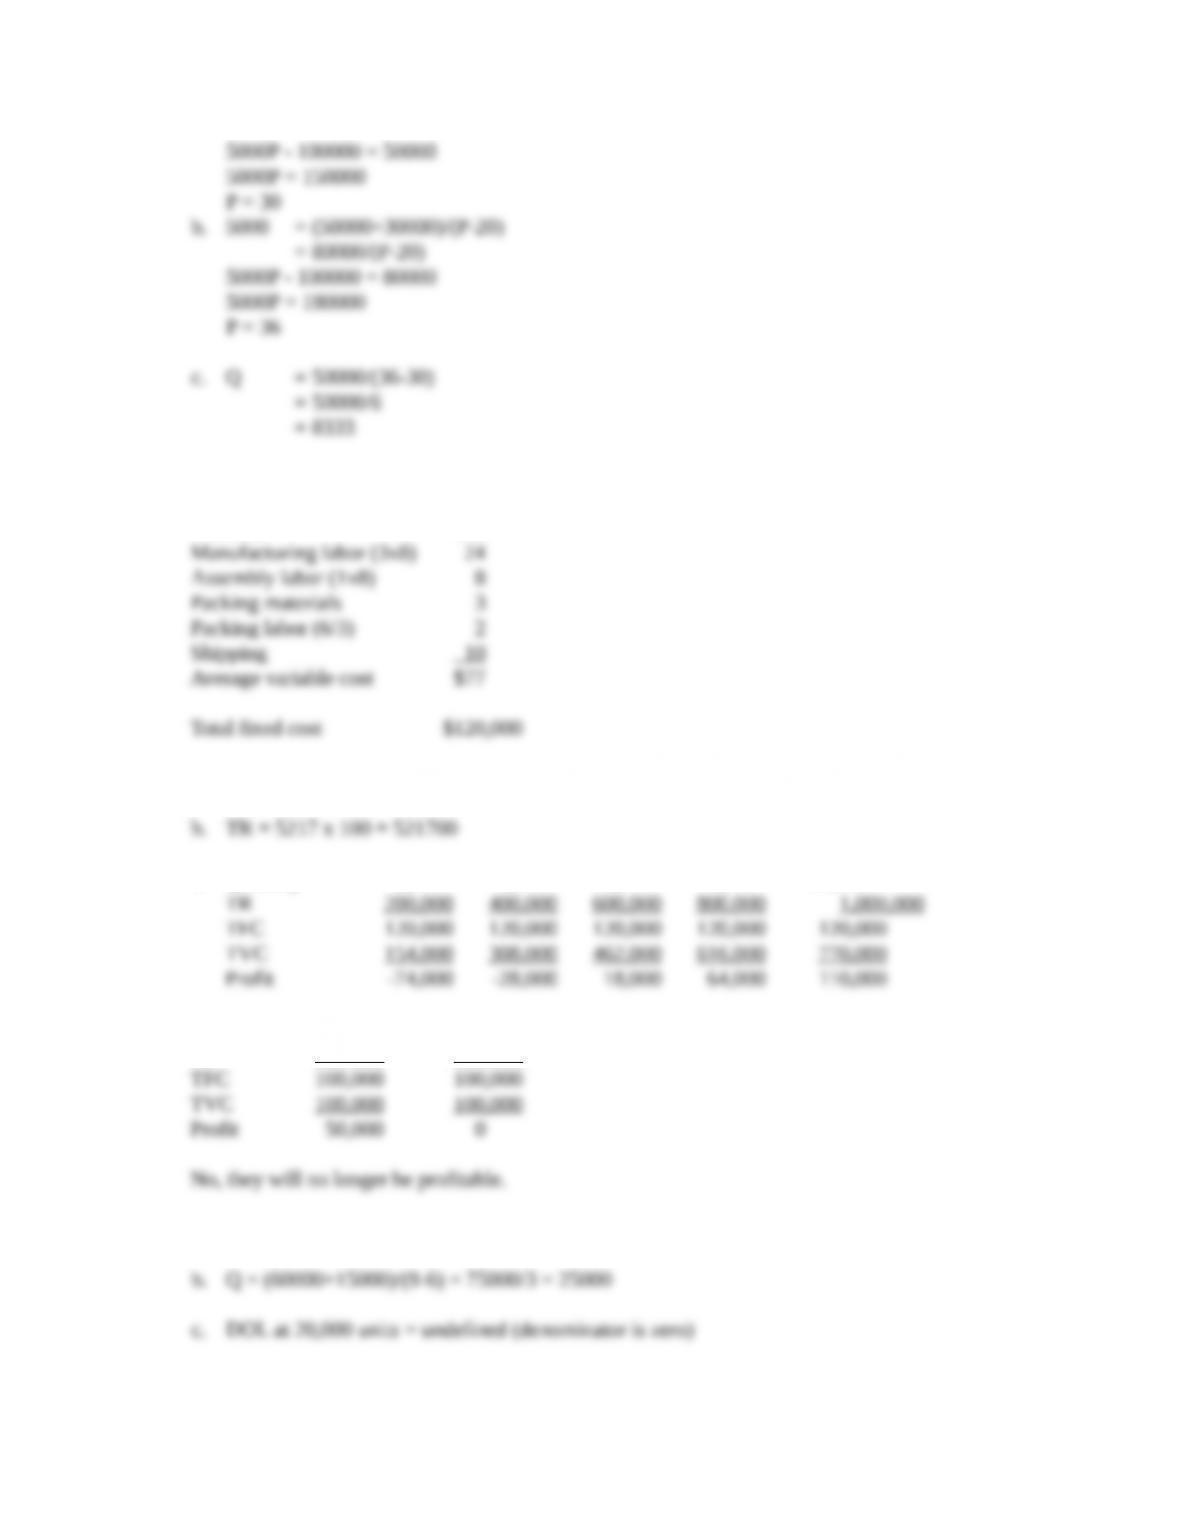
3. Average variable cost:
Materials $30
a. Q = 120000/(100-77) = 120000/23 = 5217
c. Quantity 2,000 4,000 6,000 8,000 10,000
4. Last Year Future
TR 250 ,000 200 ,000
5. a. Q = 60000/(9-6) = 60000/3 = 20000
Copyright © 2014 Pearson Education, Inc.
Break-Even Analysis 87
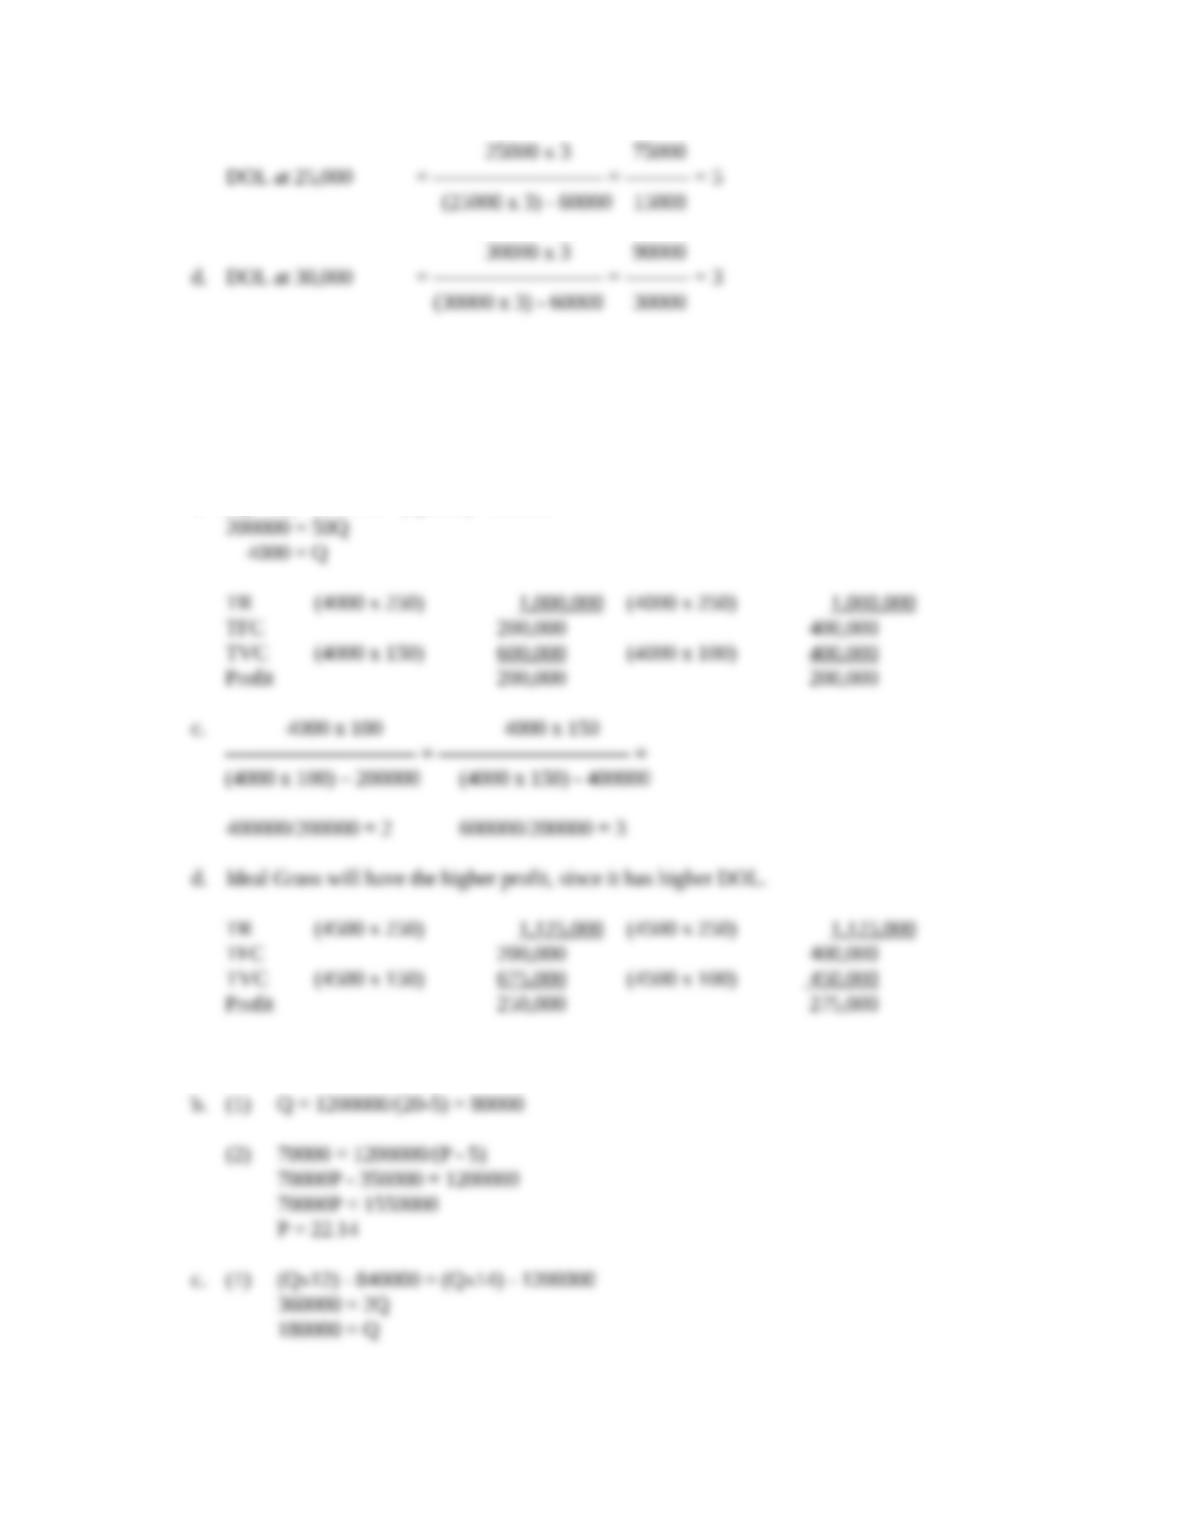
6. Perfect Lawn Ideal Grass
a. Q = 200000/100 = 2000 Q = 400000/150 = 2667
b. (Qx100) – 200000 = (Qx150) – 400000
7. a. Q = 840000/(20-8) = 70000
Copyright © 2014 Pearson Education, Inc.
Break-Even Analysis 88
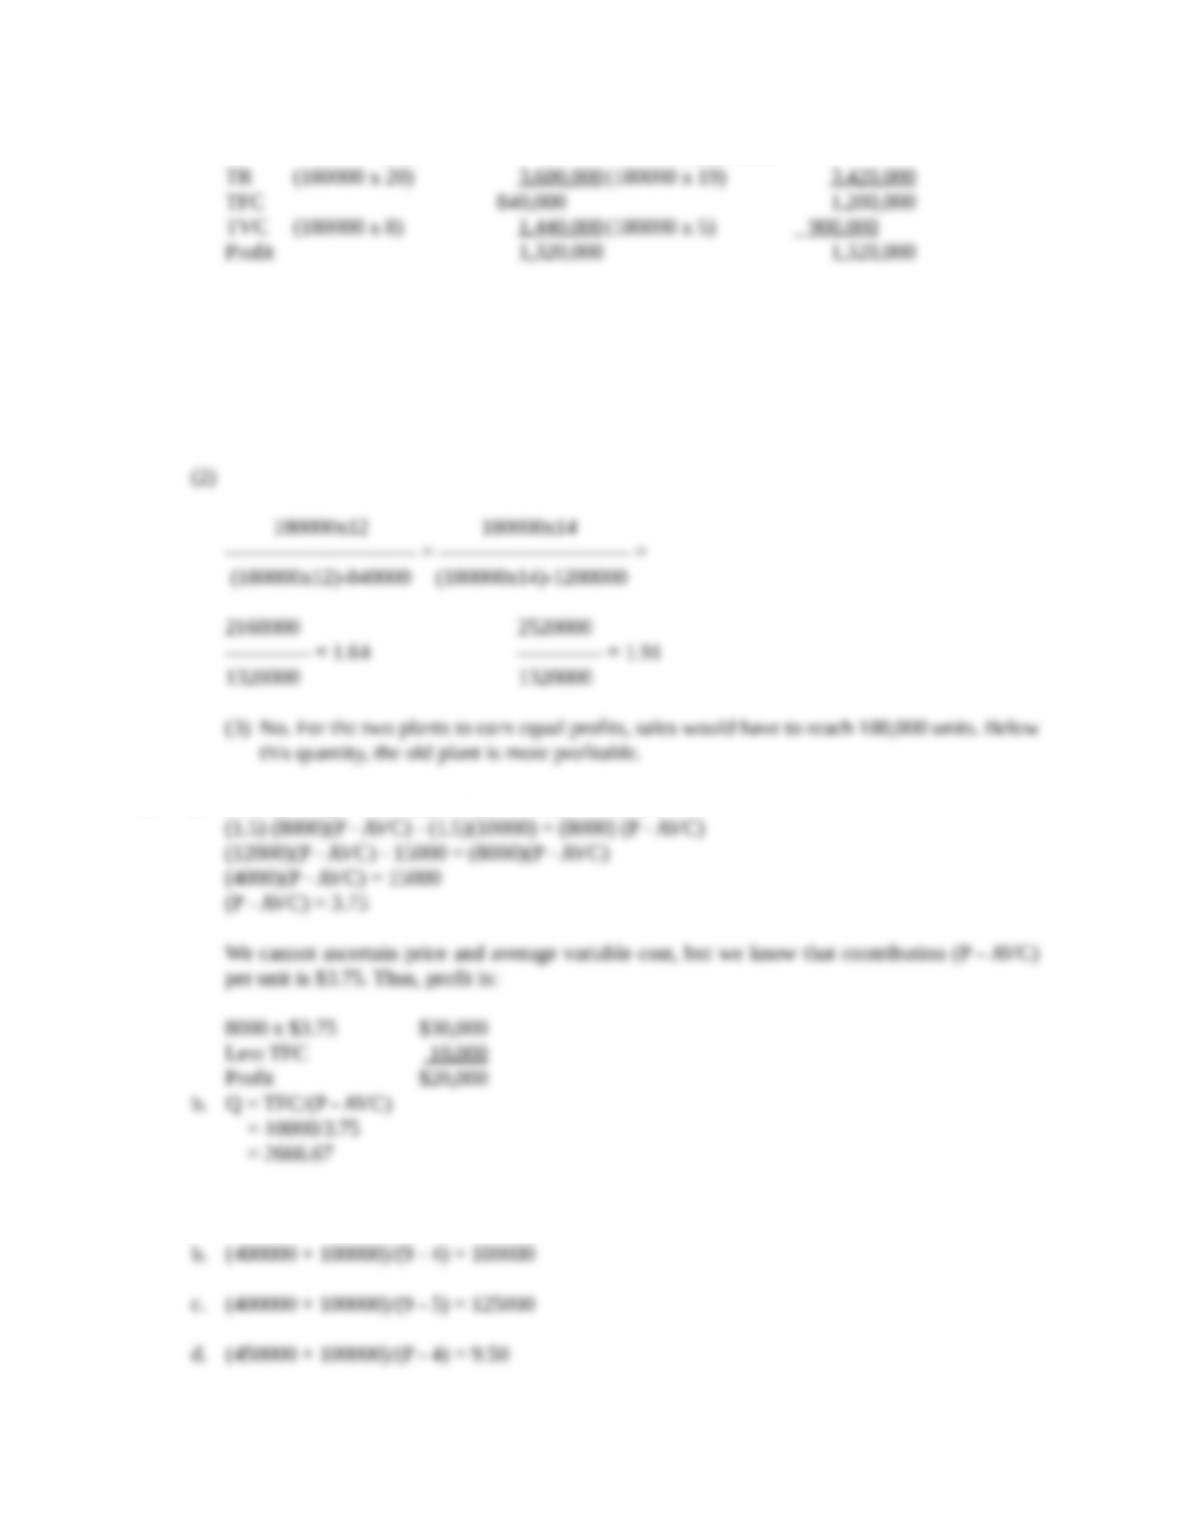
Old Modernized
8. a. 1.5 = (8000)(P – AVC)/[(8000)(P – AVC) – 10000]
9. a. 400000/(9 – 4) = 80000
Copyright © 2014 Pearson Education, Inc.
Break-Even Analysis 89
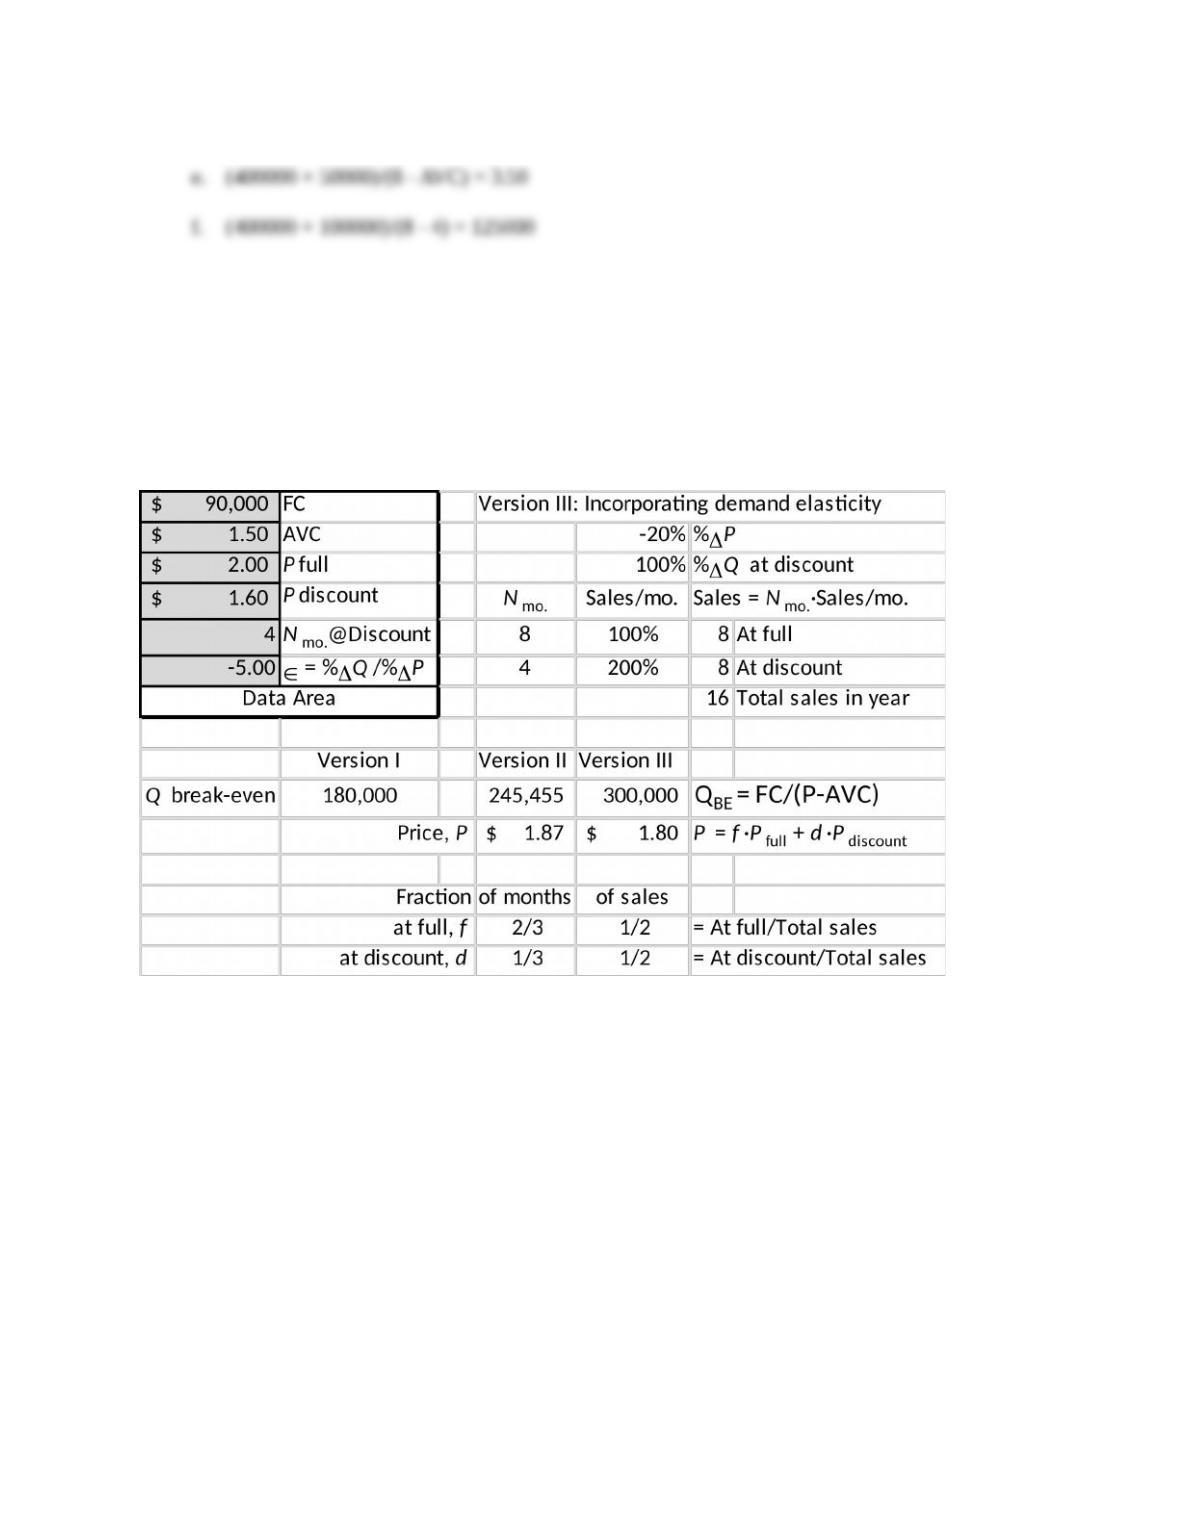
10. This is trivial using the Breakeven Analysis Excel App where it is clear that 300,000 bottles
are required in this instance. Change A1:A6 as shown below.
Copyright © 2014 Pearson Education, Inc.