CHAPTER 7 AND APPENDICES
THE THEORY AND ESTIMATION OF COST
QUESTIONS
1. a. Sunk cost is a cost that is incurred in the past that is not affected by a current decision (except
b. Fixed cost is a cost that does not vary with the level of business activity.
c. Incremental cost is the cost associated with a particular activity. Marginal cost is the per unit
d. Opportunity cost is the amount forgone when choosing one activity over the next best
2. Incremental cost, variable cost, and marginal cost are considered “relevant costs” because they are
Opportunity cost can also be considered a relevant cost, but it depends on the situation. For
example, in the case of the decision to quit one’s job to pursue an academic degree full time, the
3. The firm’s short run cost function can be considered somewhat akin to a “mirror image” of its
production function. As reflected in Figure 7.1 of the chapter, when its marginal product increases,
Copyright © 2014 Pearson Education, Inc.
The Theory and Estimation of Cost 57
4. This statement is true. As indicated in the question above, the law of diminishing returns causes a
5. From the standpoint of the supply side of the market, the short run is time enough only for those
6. Economies of scale is the decrease in a firm’s unit cost of production as it increases all of its inputs
The main determinants of economies of scale are summarized in Table 7.4 of the chapter.
7. Diseconomies of scale is the increase in a firm’s unit cost of production as it increases all of its
inputs. The main determinants of diseconomies of scale are also listed in Table 8.4. Perhaps the
8. Economies of scope refers to the reduction in unit cost resulting from a firm’s production of two or
more products. This type of cost savings is related to economies of scale to the extent that a firm of
9. The learning curve indicates unit costs on the basis of an accumulation of output. The typical cost
10. As explained in the text, the experience curve is often considered synonymous with the learning
11. After reading the section “The Long-Run Average Cost Curve as the Envelope of Short-Run
Copyright © 2014 Pearson Education, Inc.
The Theory and Estimation of Cost 58
12. Accounting statements, as a rule, do not differentiate between costs and expenses which are
relevant to decision making and those that are not. Included in cost of goods sold can be such items
as fixed overhead and depreciation which is time-related (and not production-related). Thus, not all
13. This person is referring to the spreading out of fixed cost in as short-run situation. Economies of
14. In the economic short-run, at least one factor remains fixed. In estimating such cost functions,
economists assume that capital is fixed while labor is the variable factor. Thus, the data used in
this regression analysis must cover observations where quantities produced and costs change
15.
Some of the problems encountered and for which adjustments must be sought are the following:
a. Prices of labor, materials and other variable factors may change over the time period, and must
be adjusted to be consistent.
15. In the economic long run, there are no fixed costs. The economist usually assumes that changes in
the size of plant can occur. So, the regression method generally used is the cross-sectional analysis,
where observations on output and costs are taken from different plants at one point of time.
Copyright © 2014 Pearson Education, Inc.
The Theory and Estimation of Cost 59
a. Wage rates and other unit costs (e.g. utility bills) may vary from one geographical area to
b. The various plants may not be operating at an optimal level of technology. Plants in the sample
c. If the different plants in the sample belong to a different firm, there may be differences in
d. Some factors, especially labor, may receive their remuneration differently. For instance,
16. a. Engineering costs: based on data developed by experts (engineers), who estimate the optimal
b. Survivorship principle: Plants in an industry are categorized by size, and the proportion of total
Copyright © 2014 Pearson Education, Inc.
The Theory and Estimation of Cost 60
PROBLEMS
1.
Q TC TFC TVC AC AF AVC MC
0 120 120 0 X X X
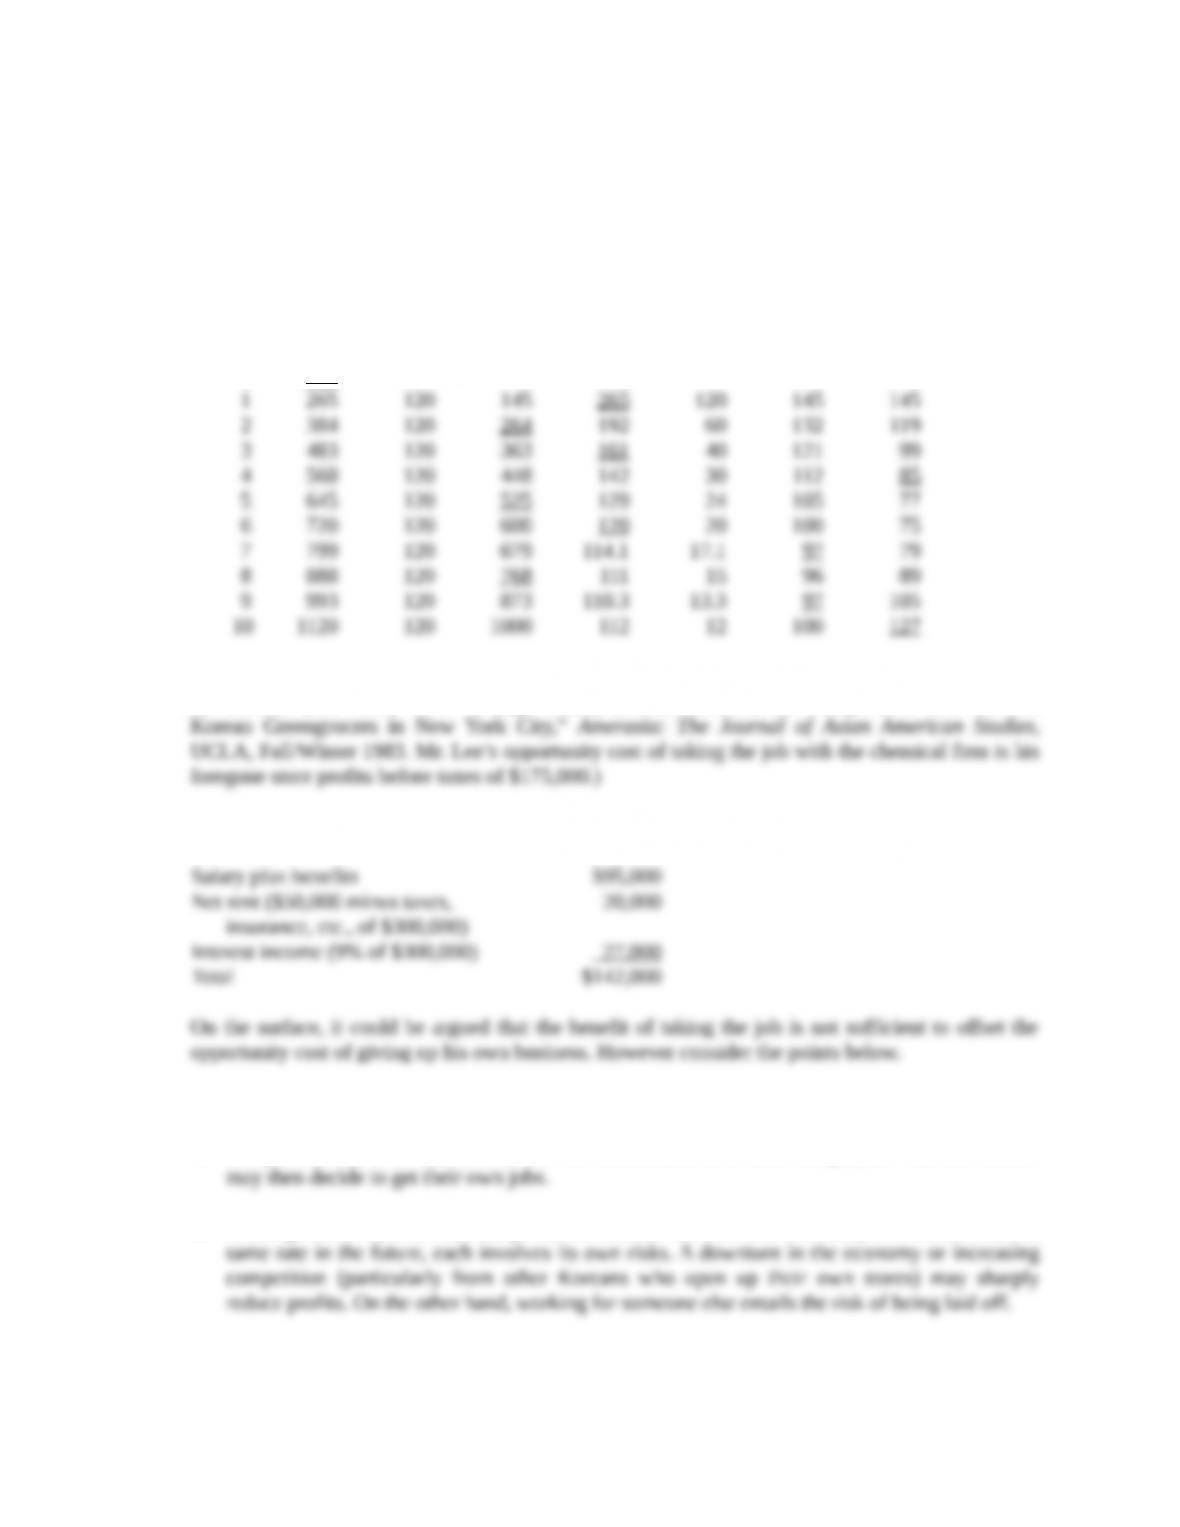
2. Although the numbers are fictitious, this problem is actually based on a study conducted by one of
the authors. (See Philip K. Y. Young, “Family Labor, Sacrifice, and Competition: The Case of
However, in return Mr. Lee will receive the following:
a. The long hours of work reduces the attractiveness of owning one’s own business.
b. The profits have to be shared with his wife and brother. If he takes the job, his wife and brother
c. Although the forecast is that the profits in his own business and his salary will increase at the
Copyright © 2014 Pearson Education, Inc.
The Theory and Estimation of Cost 61
Copyright © 2014 Pearson Education, Inc.
The Theory and Estimation of Cost 62
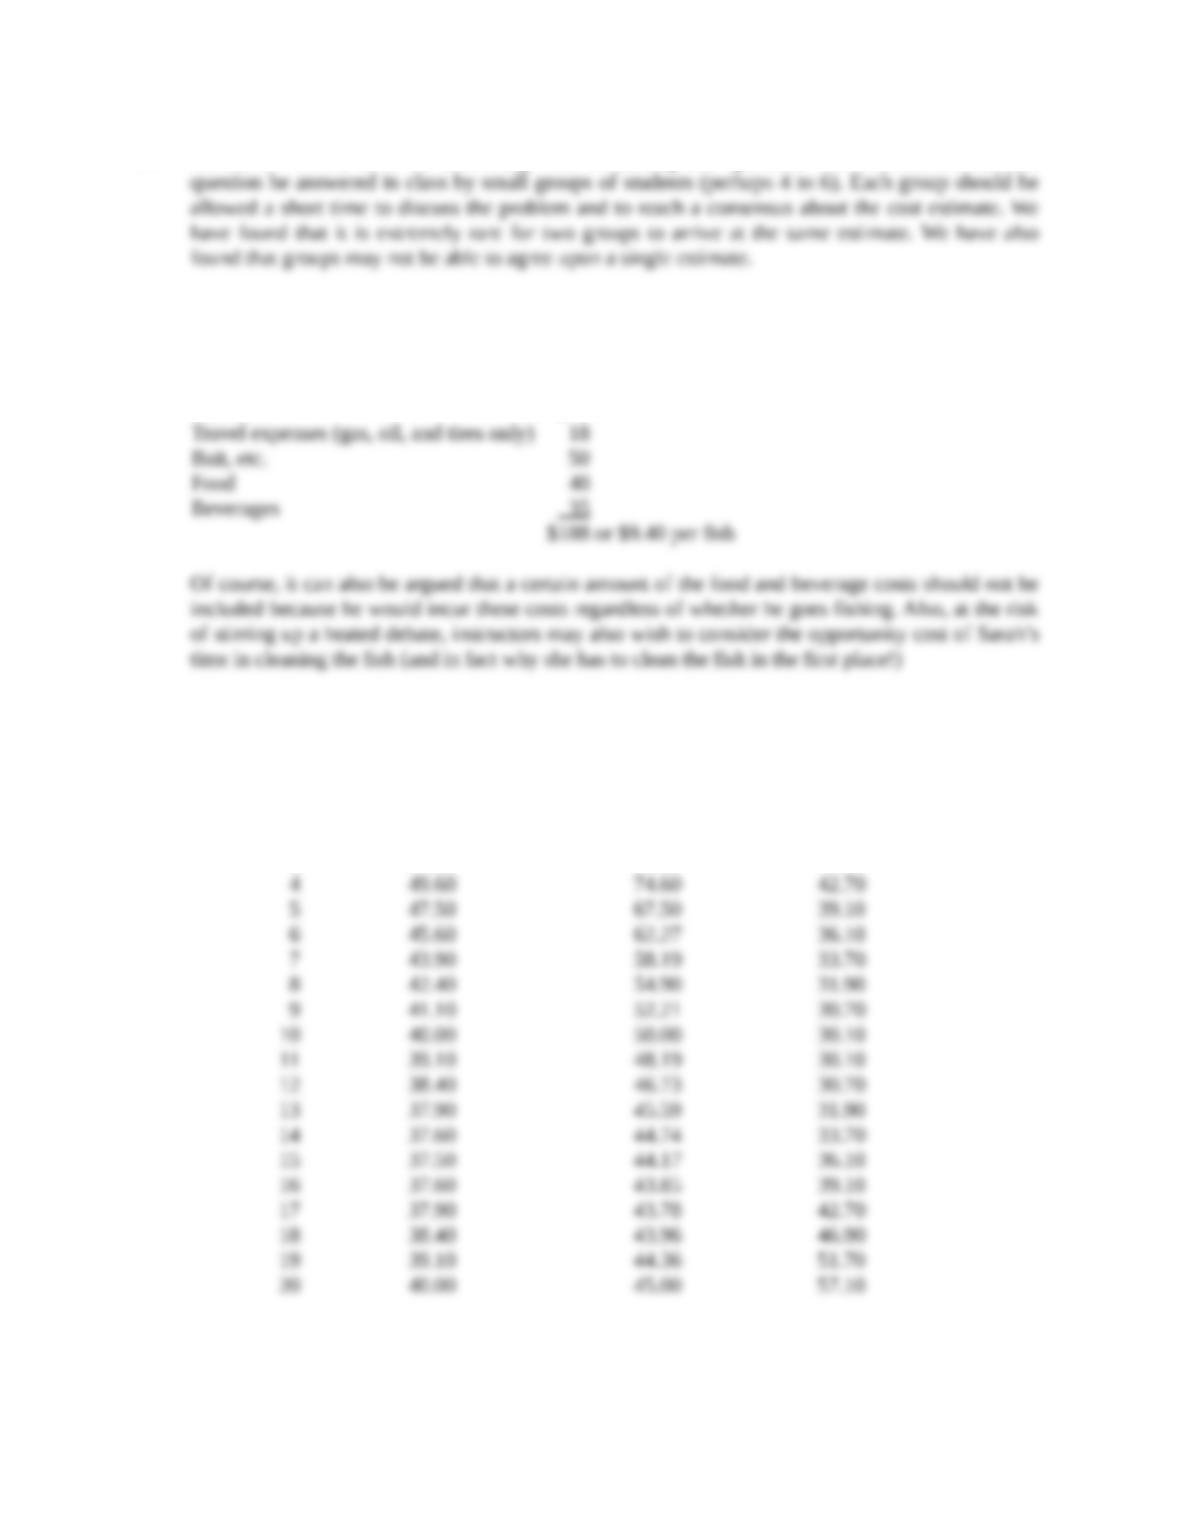
3. Instructors should have an interesting time discussing this question. We recommend that this
There is no unique answer to this question because it all depends on the assumptions that one makes
about the cost conditions. However, based on the strict criteria of relevant cost (i.e. incremental or
variable cost), we suggest that the following estimate:
Boat fuel $45
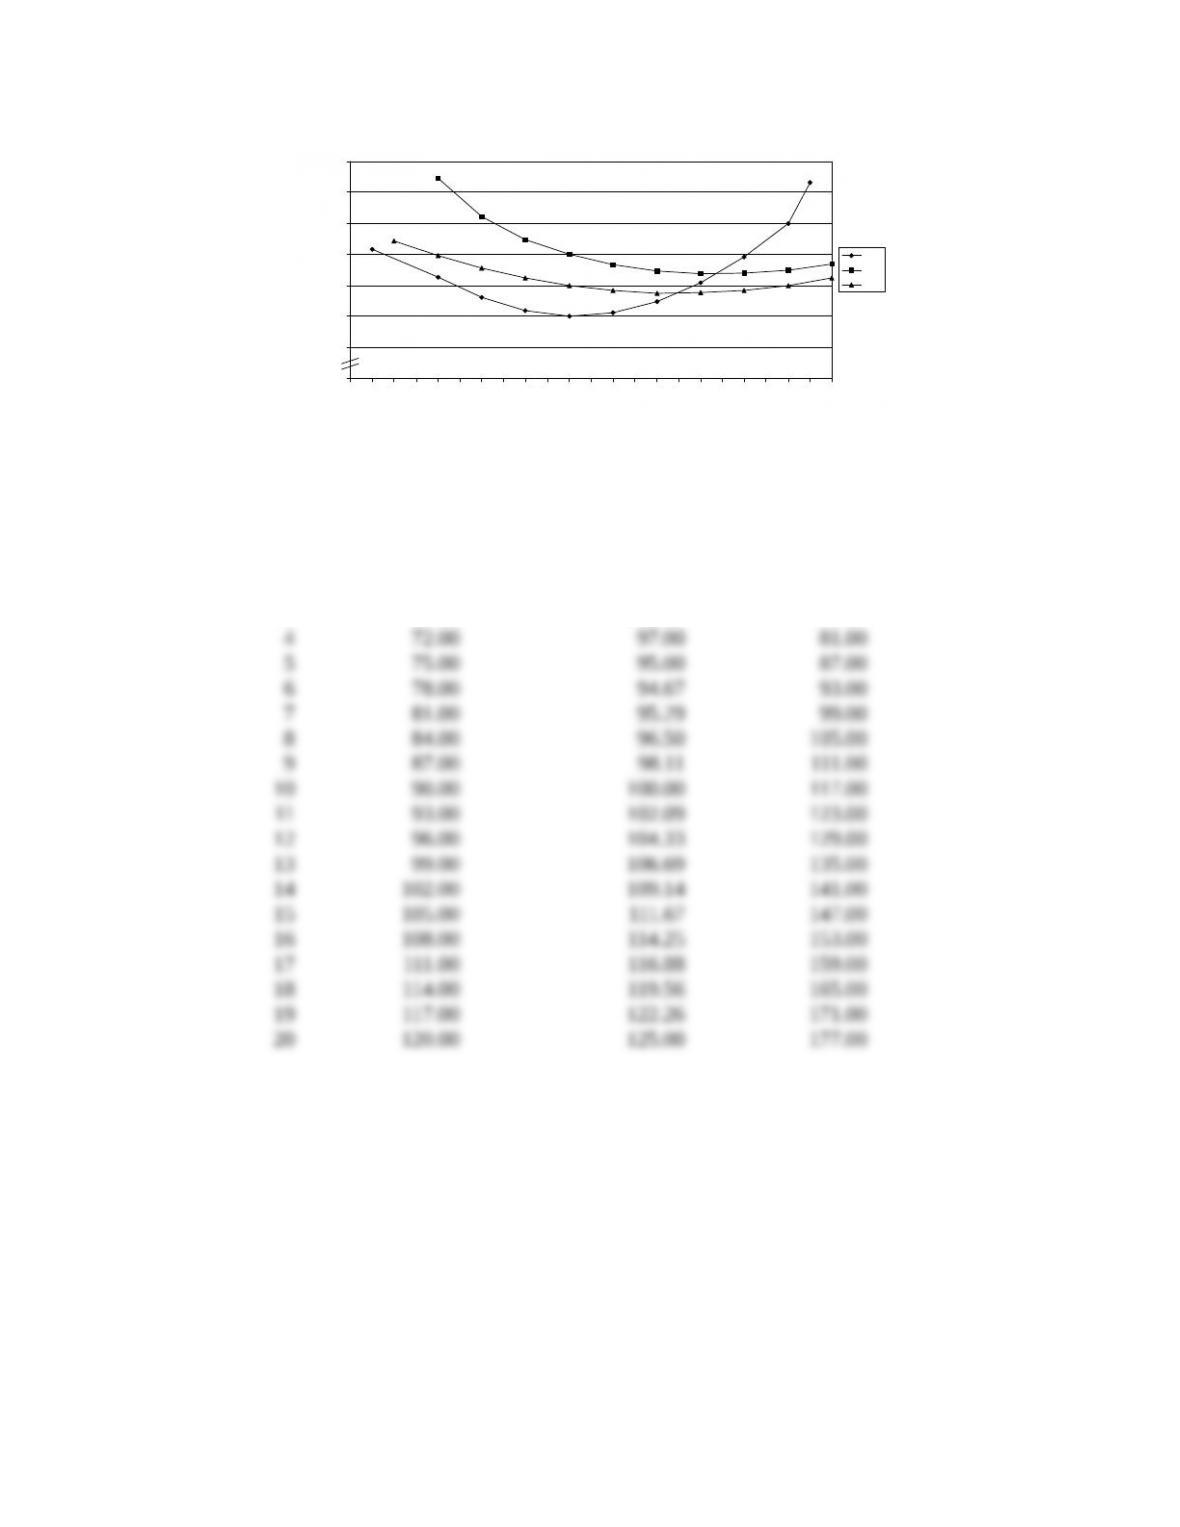
4. a.
Quantity Average Variable Cost Average Total Cost Marginal Cost
0
1 57.10 157.10 57.10
2 54.40 104.40 51.70
3 51.90 85.23 46.90
Copyright © 2014 Pearson Education, Inc.
The Theory and Estimation of Cost 63
Figure 7.1
Quantity Average Variable Cost Average Total Cost Marginal Cost
0
1 63.00 163.00 63.00
2 66.00 116.00 69.00
3 69.00 102.33 75.00
Copyright © 2014 Pearson Education, Inc.
10
20
30
40
50
60
70
80
0 1 2 3 4 5 6 7 8 9 10 11 12 13 14 15 16 17 18 19 20 21 22
Q
$
MC
AC
AVC
The Theory and Estimation of Cost 64
Figure 7.2
Quantity Average Variable Cost Average Total Cost Marginal Cost
0
1 60.00 160.00 60.00
2 60.00 110.00 60.00
Figure 7.3
Copyright © 2014 Pearson Education, Inc.
40
60
80
100
120
140
160
0 1 2 3 4 5 6 7 8 9 10 11 12 13 14 15 16 17 18 19 20 21 22
Q
$
MC
ATC
AVC
40
50
60
70
80
90
100
110
120
0 2 4 6 8 10 12 14 16 18 20 22
Q
$
AC
MC=AVC
The Theory and Estimation of Cost 65
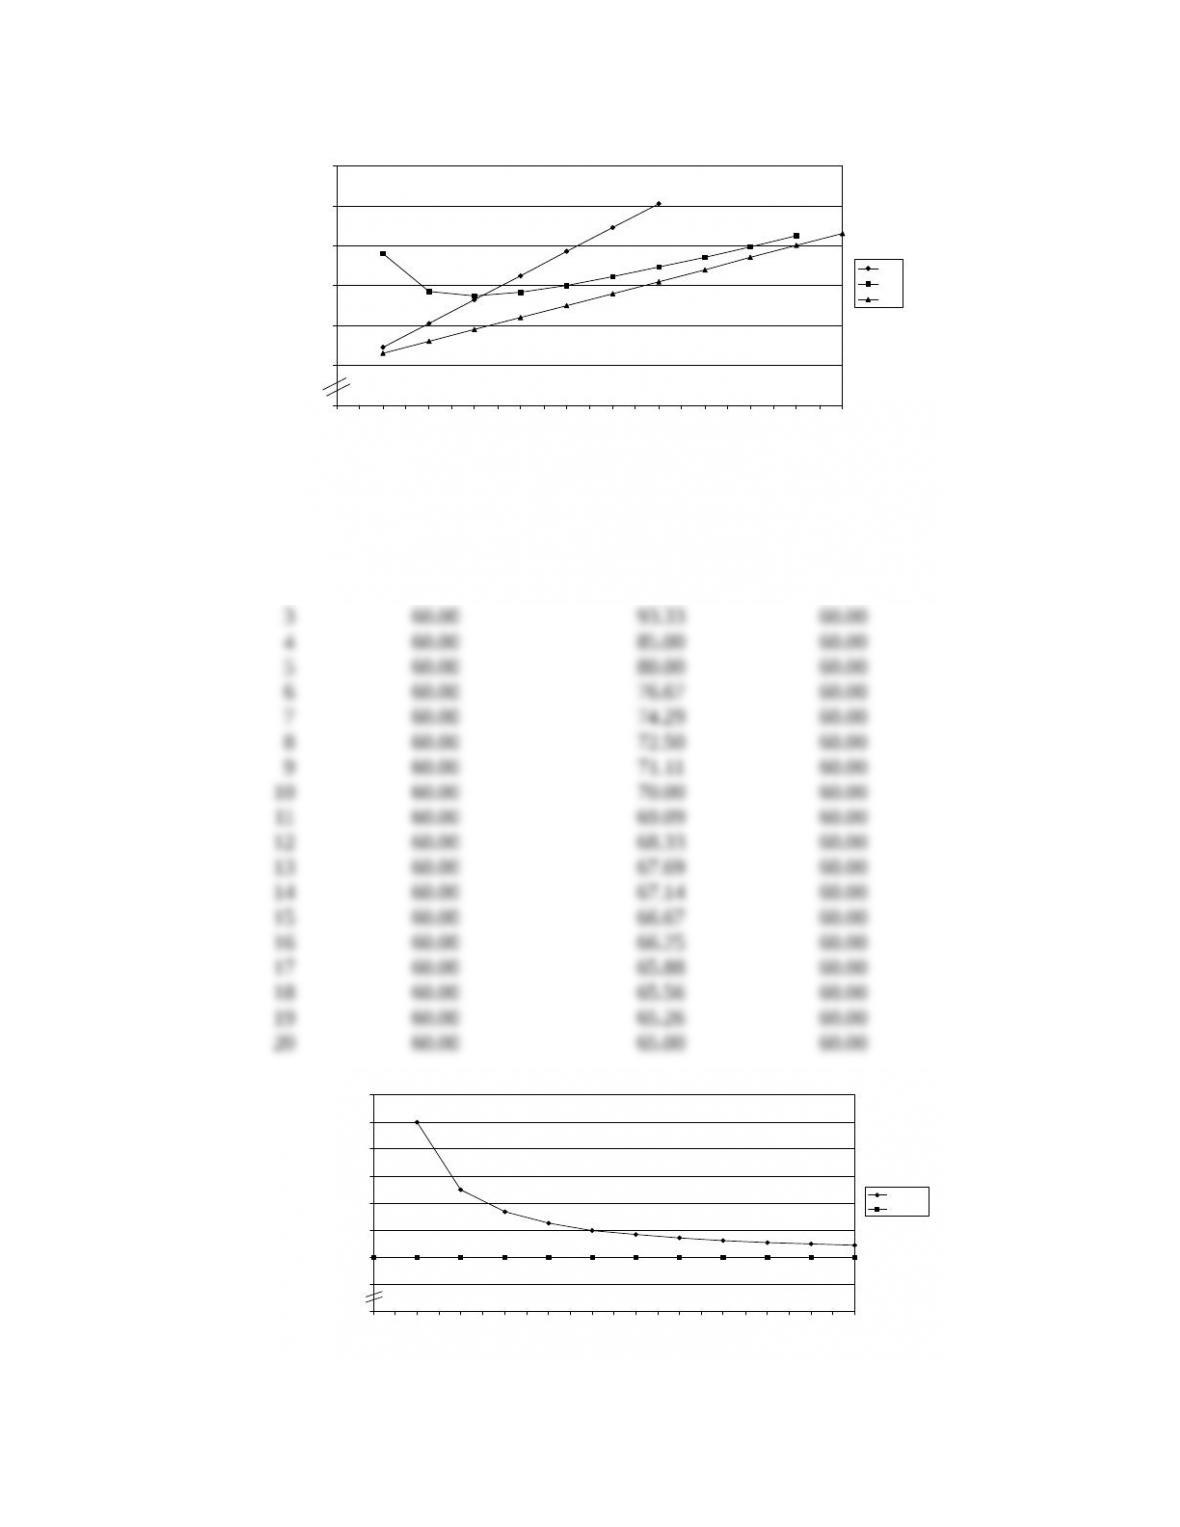
b. In the first equation, diminishing returns occurs at 10 units of output, the point at which MC
reaches its minimum point.
c. Students should simply observe how the MC intersects the AVC and AC lines at their minimum
5. a. FALSE Decision-makers should always use the replacement or current cost of raw
materials because it is considered to be relevant to the decision.
6. a. Only AC will shift downwards, because we assume that this move affects only fixed cost.
7. a. LRAC = 160 – 20Q + 1.2Q2
Copyright © 2014 Pearson Education, Inc.
The Theory and Estimation of Cost 66
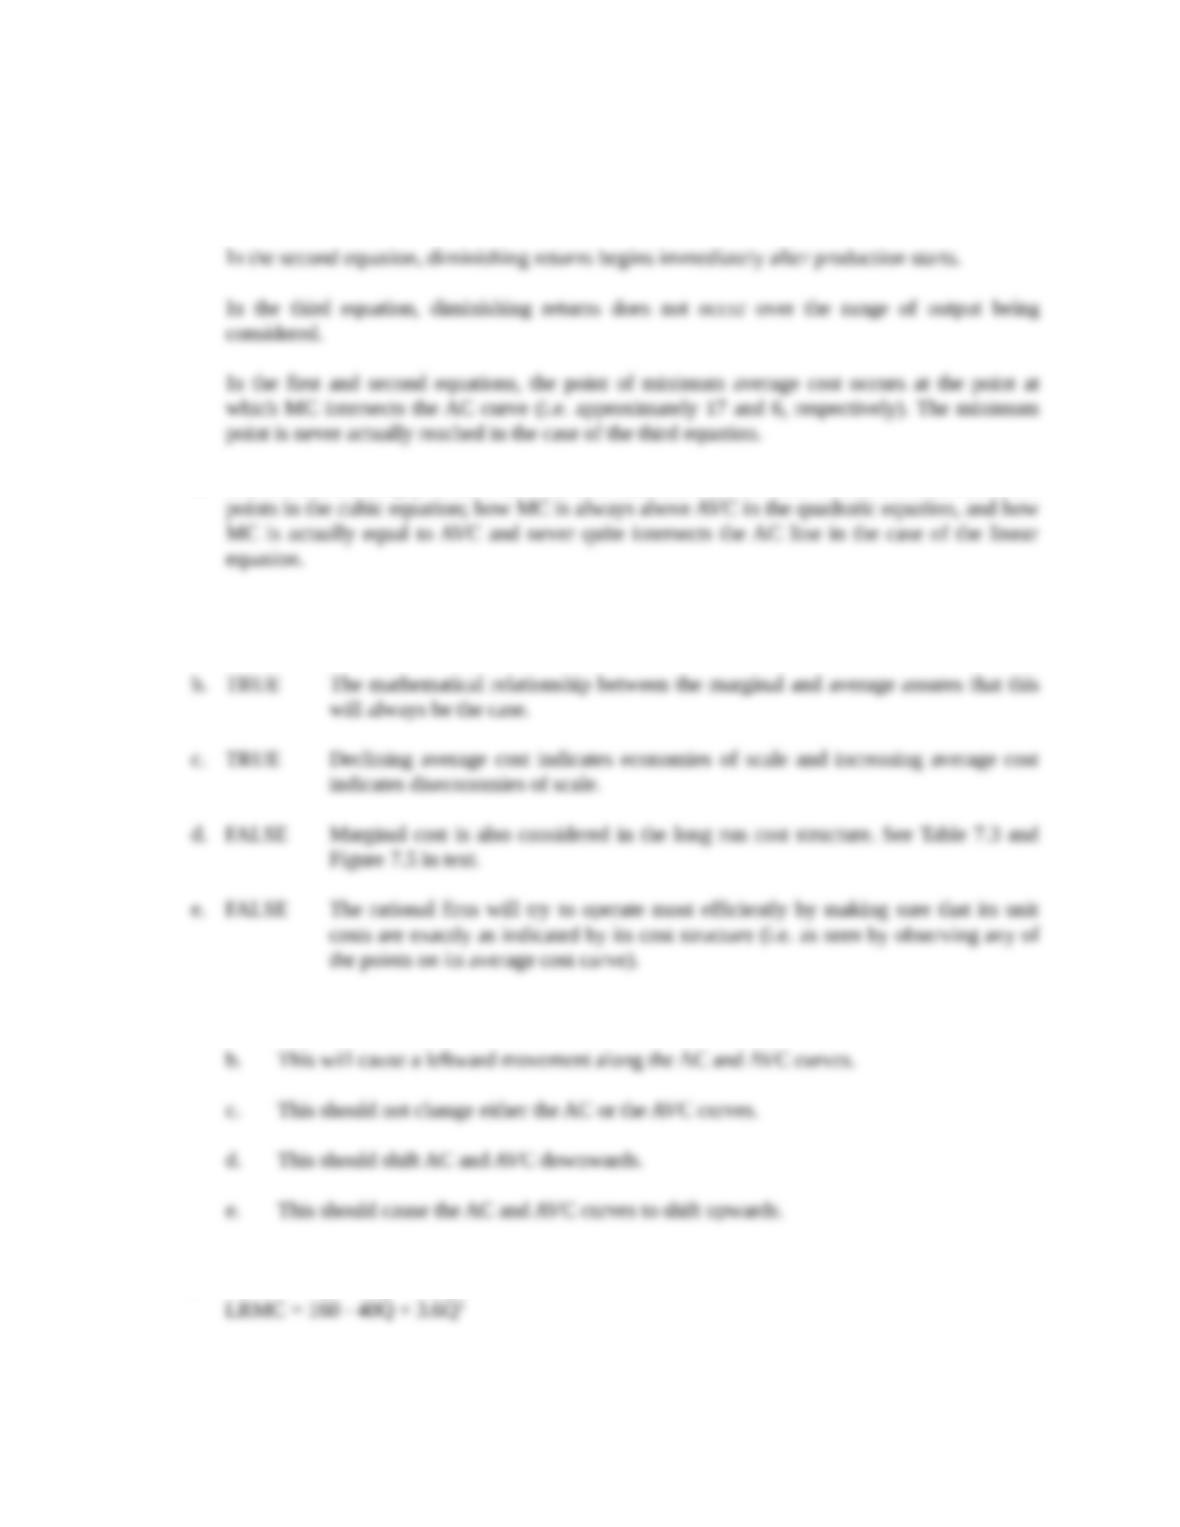
b. Because of the particular functional form of the LRAC, we know that this firm experiences
Figure 7.4
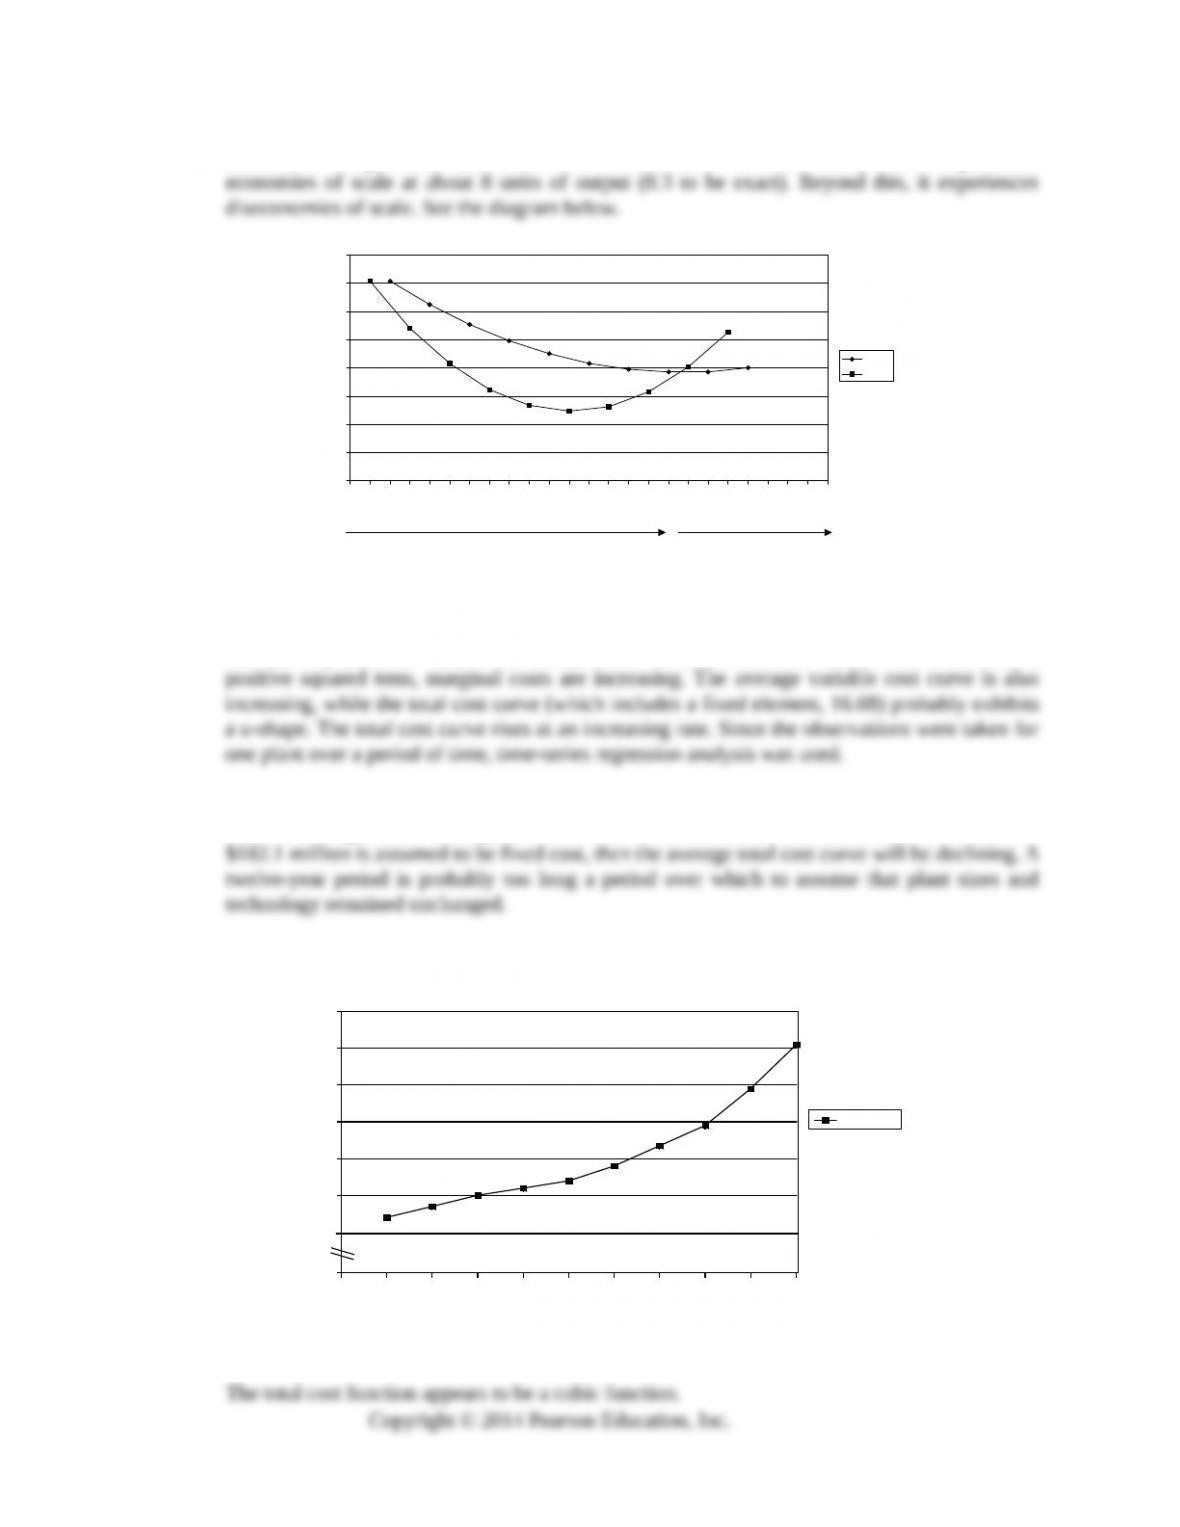
8. a. This equation represents a quadratic cost curve. Total fuel cost (Y) is the dependent variable
and quantity produced (X) is the independent variable. Since the cost function includes a
b. This is a time-series analysis of the steel industry. The total cost equation shown is a straight
line. The marginal and average variable cost curves are horizontal, i.e. costs are constant. If
9. a.
Figure 7.5
0
20
40
60
80
100
120
140
160
0 1 2 3 4 5 6 7 8 9 10 11 12
Q
$
LRAC
LRMC
Economies of Scale Diseconomies of Scale
100
110
120
130
140
150
160
0 10 20 30 40 50 60 70 80 90 100
To tal Cost
0
TC ($)
Q
The Theory and Estimation of Cost 67
Copyright © 2014 Pearson Education, Inc.