CHAPTER 12
CAPITAL BUDGETING AND RISK
QUESTIONS
1. The objective of capital budgeting is to assess the worth of projects which usually entail large
2. The term “time value of money” simply says that a dollar today is worth more than a dollar
3. The net present value is calculated by summing the present value of all cash inflows and subtracting
The internal rate of return is that interest rate which equates the present value of cash inflows and
4. The two calculations can lead to conflicting results in the case where, for instances, two mutually
exclusive projects are evaluated. While both projects could be acceptable under the NPV and IRR
5. a. Initial cash outflows: this is the original investment in the project, such as the purchase of the
b. Operating cash flows: these are the periodic (annual) inflows and outflows from additional
Capital Budgeting and Risk 111
c. Changes in working capital: certain projects require, for instance, additional inventory or a
6. Depreciation is not a cash expense. It is an accounting entry which is meant to consider the
decrease in the value of an asset, and thus would not be considered to be a cash flow. However, as it
7. Last year’s marketing research project is considered a sunk cost, and is not relevant to the analysis.
8. A company should invest in capital projects up to the point where the project with the lowest
internal rate of return just equals the cost of capital of the last dollar spent. Or, it can be said that a
9. Each component of capital (e.g. bonds, preferred stock, common stock) should be assigned a weight
10. Beta calculates the volatility of the returns on a particular stock relative to the return on a total stock
11. Under the rule of capital rationing, some projects with positive net present value will not be
implemented. This is because the company has limited capital expenditure to a certain sum, which
Copyright © 2014 Pearson Education, Inc.
Capital Budgeting and Risk 112
12. Causes of business risk:
a. Changes in conditions of the economy as a whole
13. No. In a risky project, both expected value and level of risk must be considered. Risk is measured
14. Yes. If the normal curve has a high peak and steep declines around the peak, this indicates a
relatively small standard deviation—the possible outcomes will not fall far from their mean
15. The coefficient of variation—the standard deviation divided by the expected value—measures the
16. Yes. Different projects may have different degrees of risk, and, therefore, different interest rates
17. The RADR method appears to be the simpler of the two techniques to apply. The certainty
18. Sensitivity analysis involves the changing of one variable in a capital project evaluation to calculate
the impact of the change on the final results, i.e., the net present value or the internal rate of return.
Simulation analysis identifies the key variables and assigns probabilities to each. The results are
19. If a company which is analyzing a capital project has the ability to make changes while the project
is in process, such “option” may improve the results. The use of real option analysis is indicated
when a company can expand or contract operations, vary its inputs, abandon or postpone a project.
Copyright © 2014 Pearson Education, Inc.
Capital Budgeting and Risk 113
PROBLEMS
1. This offer is too good to be true. The calculations do not consider the fact that if the buyer borrows,
he/she will have to make monthly payments of $266.93. Where do these come from? If they come
2. a. PV (at 12%)
Cash flow year 0 $-50,000.00
year 1 8,928.57
b. 21.1% (or 21%, rounded off to nearest percent)
PV (at 21.1%)
Cash flow year 0 $-50,000.00
c. Yes, this project should be accepted. The net present value is positive and, correspondingly, the
3. The results can be calculated in two ways:
a. Calculate NPV of each year’s value:
Capital Budgeting and Risk 114
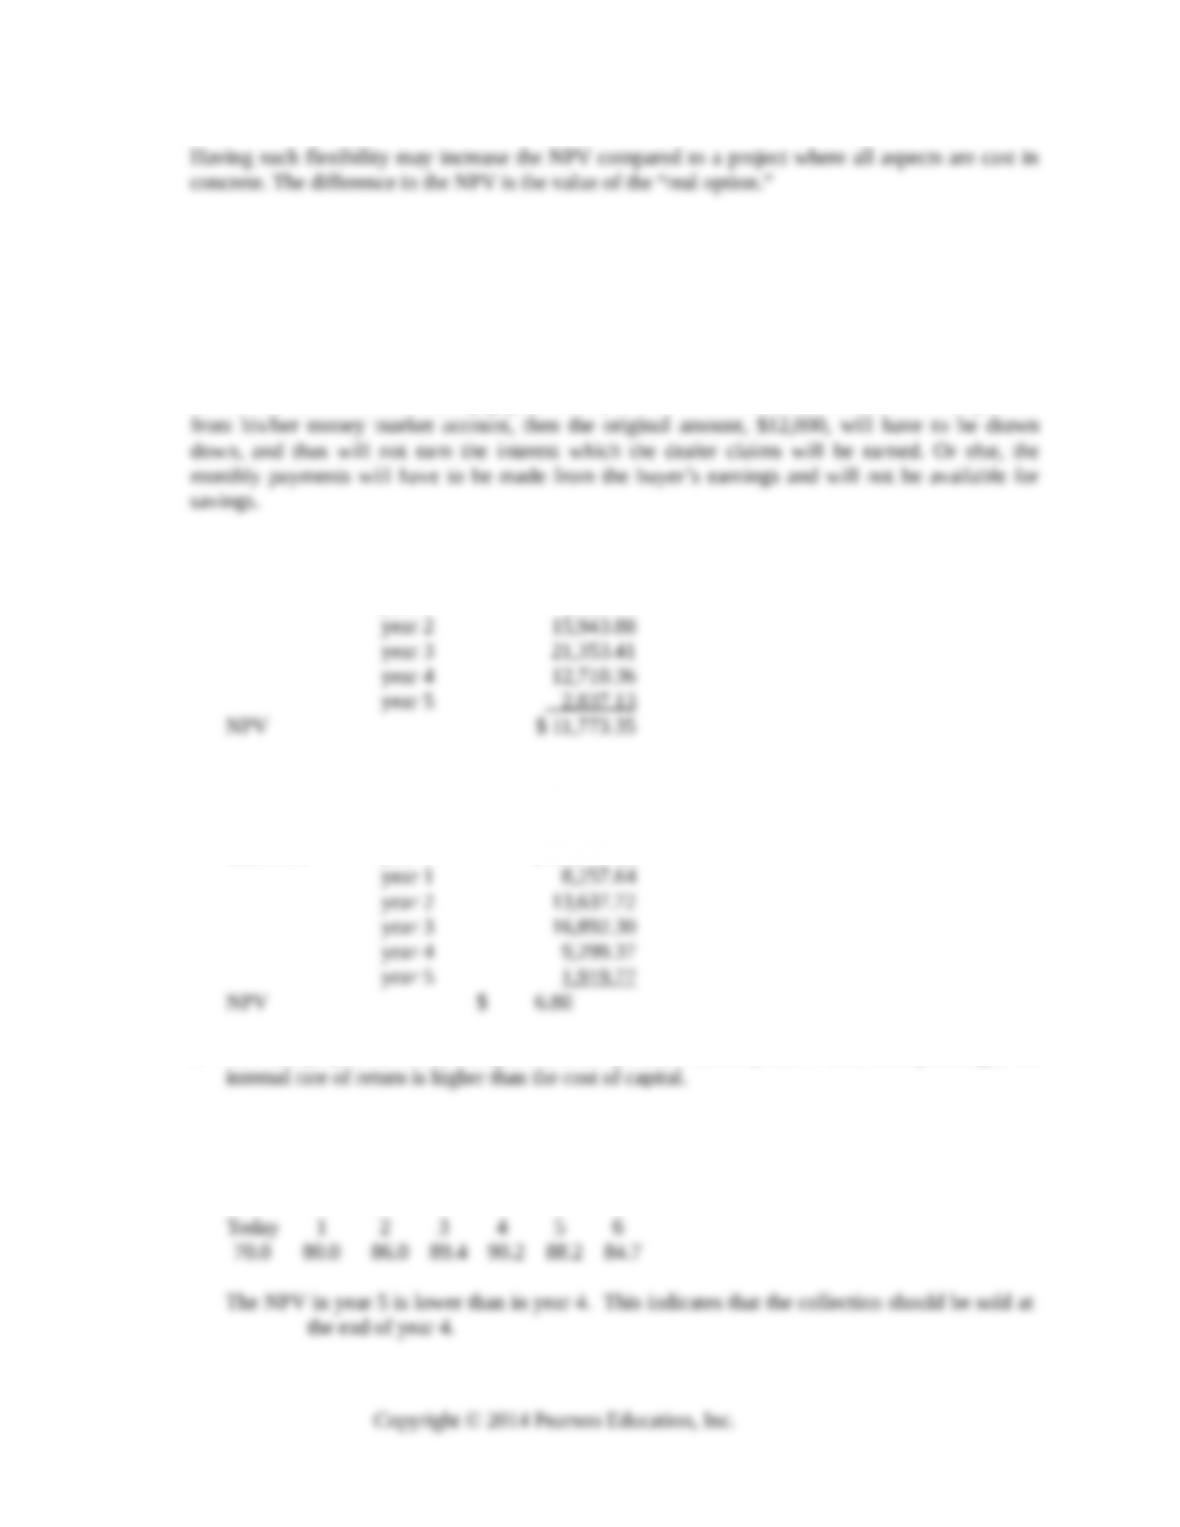
b. Calculate the growth rate each year. The growth rate is actually the internal rate of return.
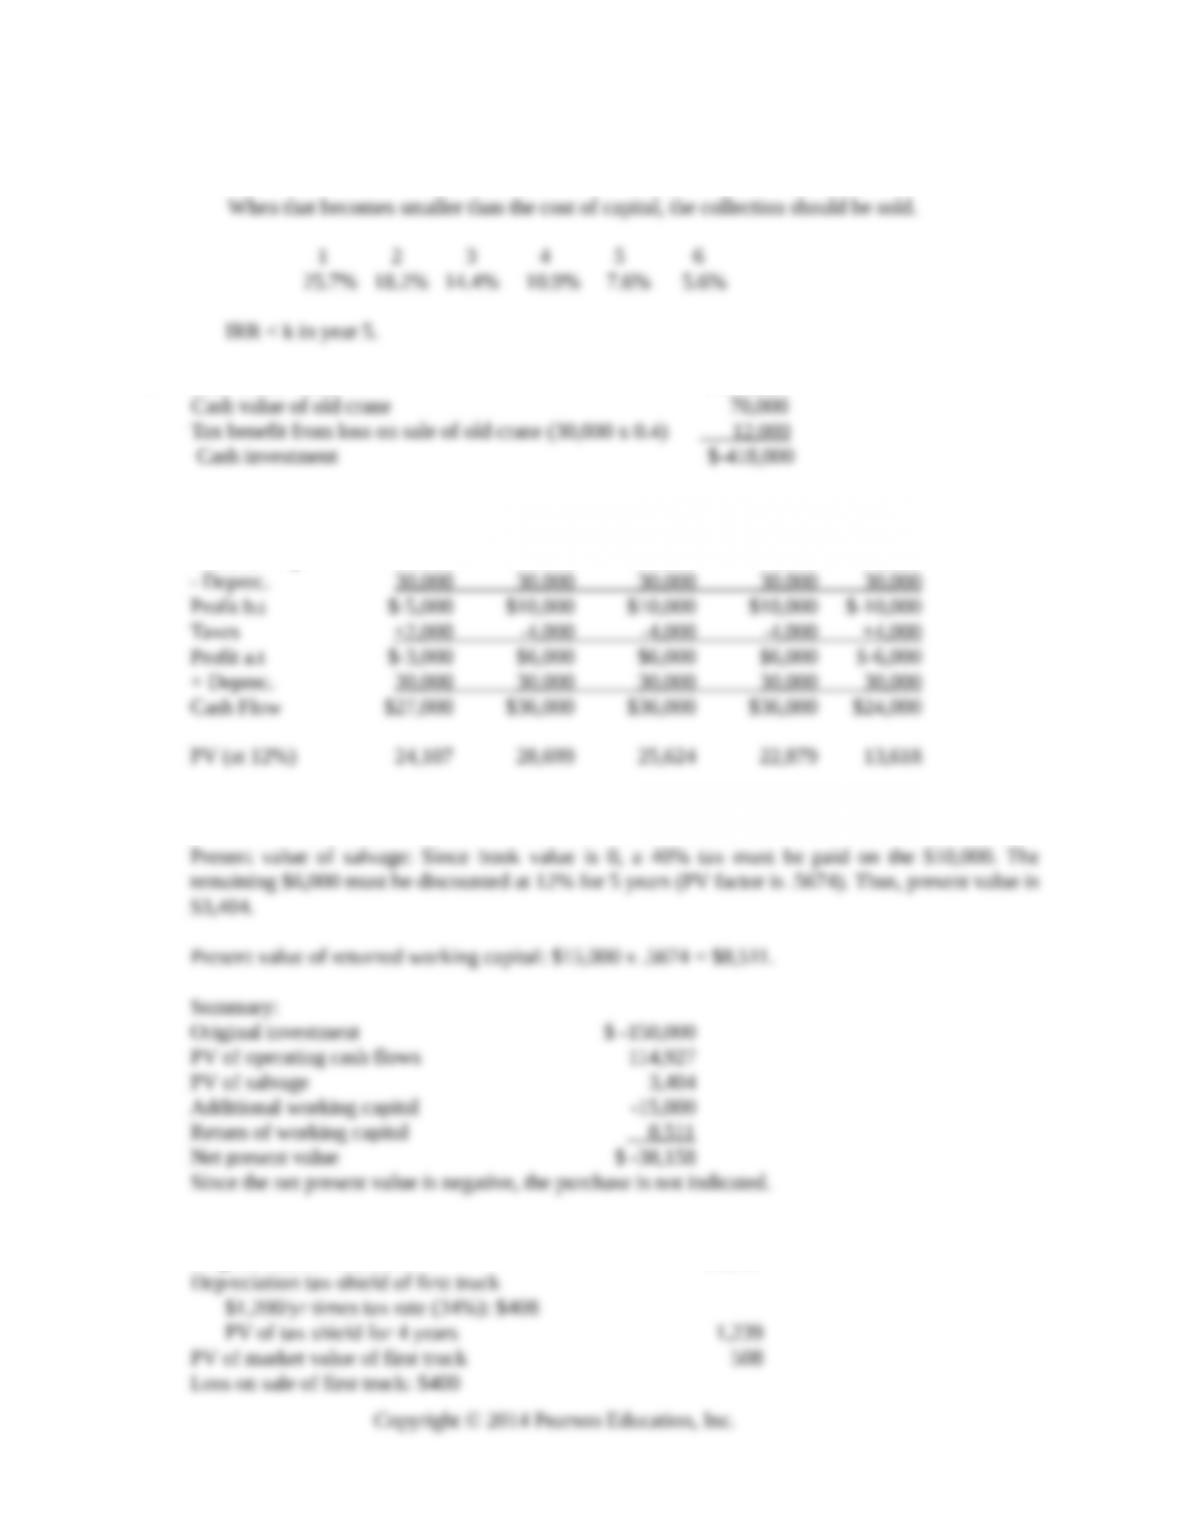
4. Cost of new crane $-500,000
5. Year 1 Year 2 Year 3 Year 4 Year 5
Revenue $50,000 $80,000 $80,000 $80,000 $40,000
– Cost & Exp 25,000 40,000 40,000 40,000 20,000
Total present value of operating cash flows: $114,927
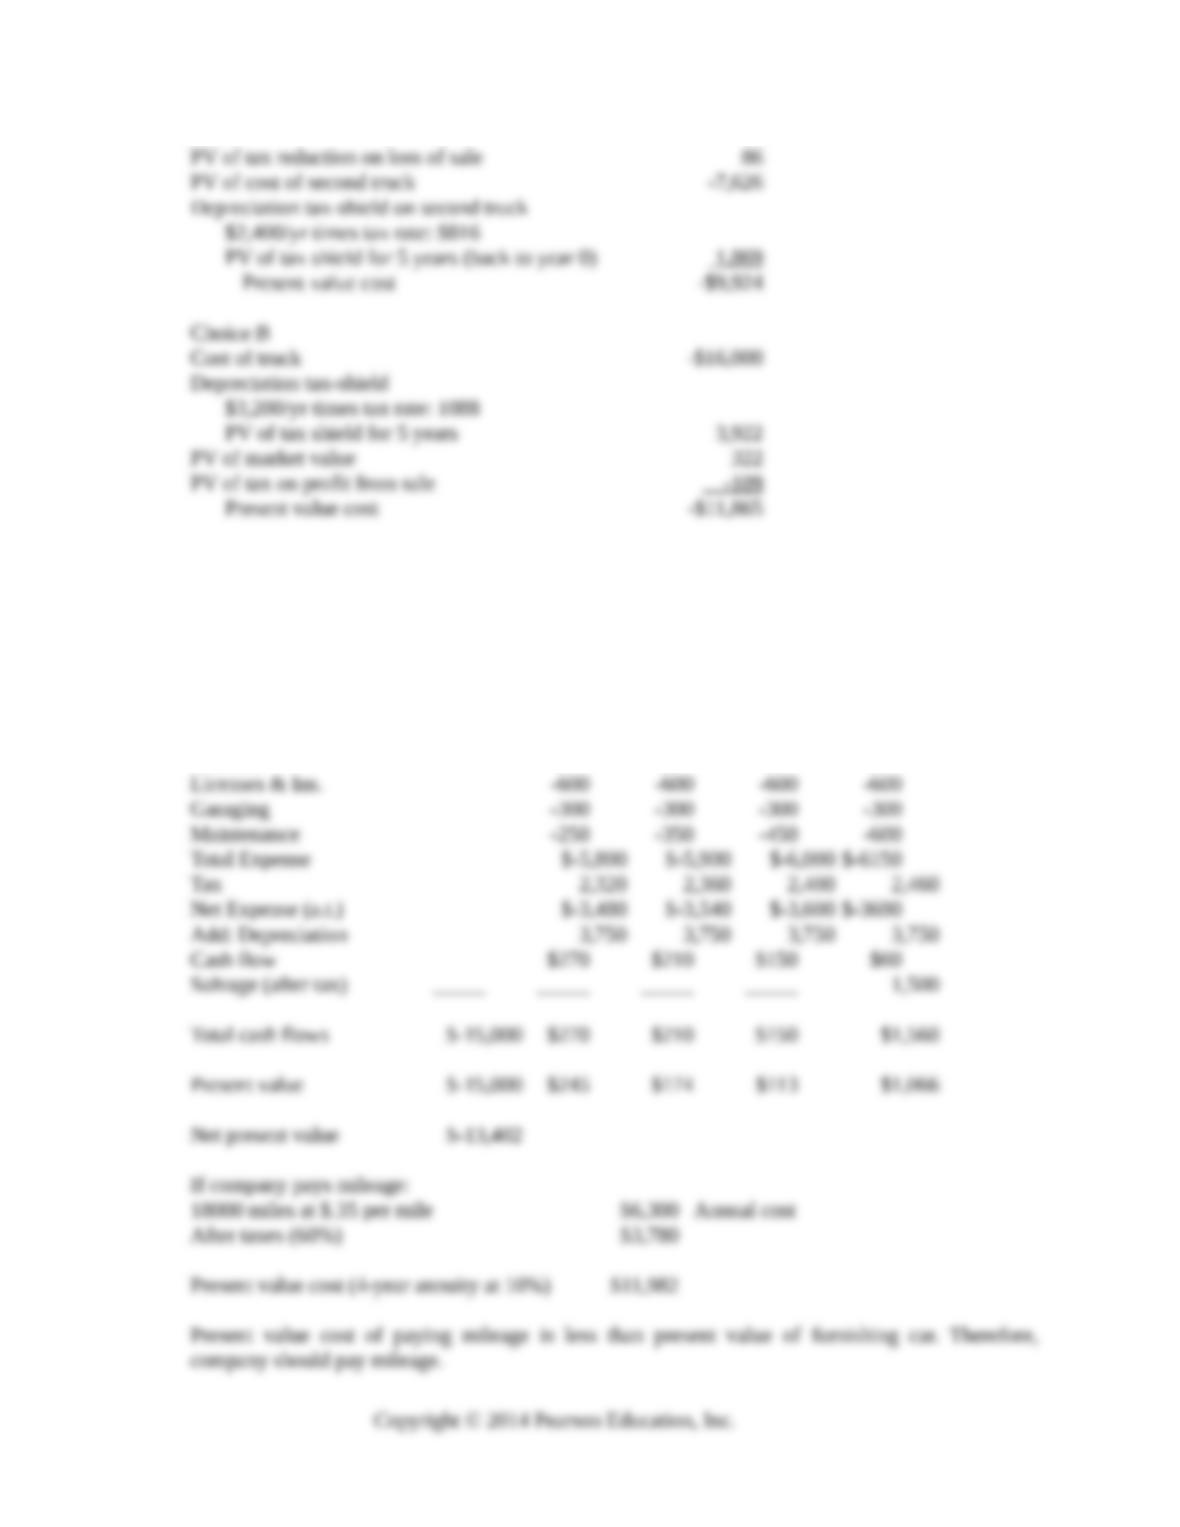
6. Choice A
Original cost of first truck -$6,000
Capital Budgeting and Risk 115
Choice A is preferred.
7. If company furnishes the car, its cash flows will be as follows:
Year 0 Year 1 Year 2 Year 3 Year 4
Original cost $-15,000
Current cash flow:
Depreciation $-3,750 $-3,750 $-3,750 $-3,750
Gasoline -900 -900 -900 -900
Capital Budgeting and Risk 116
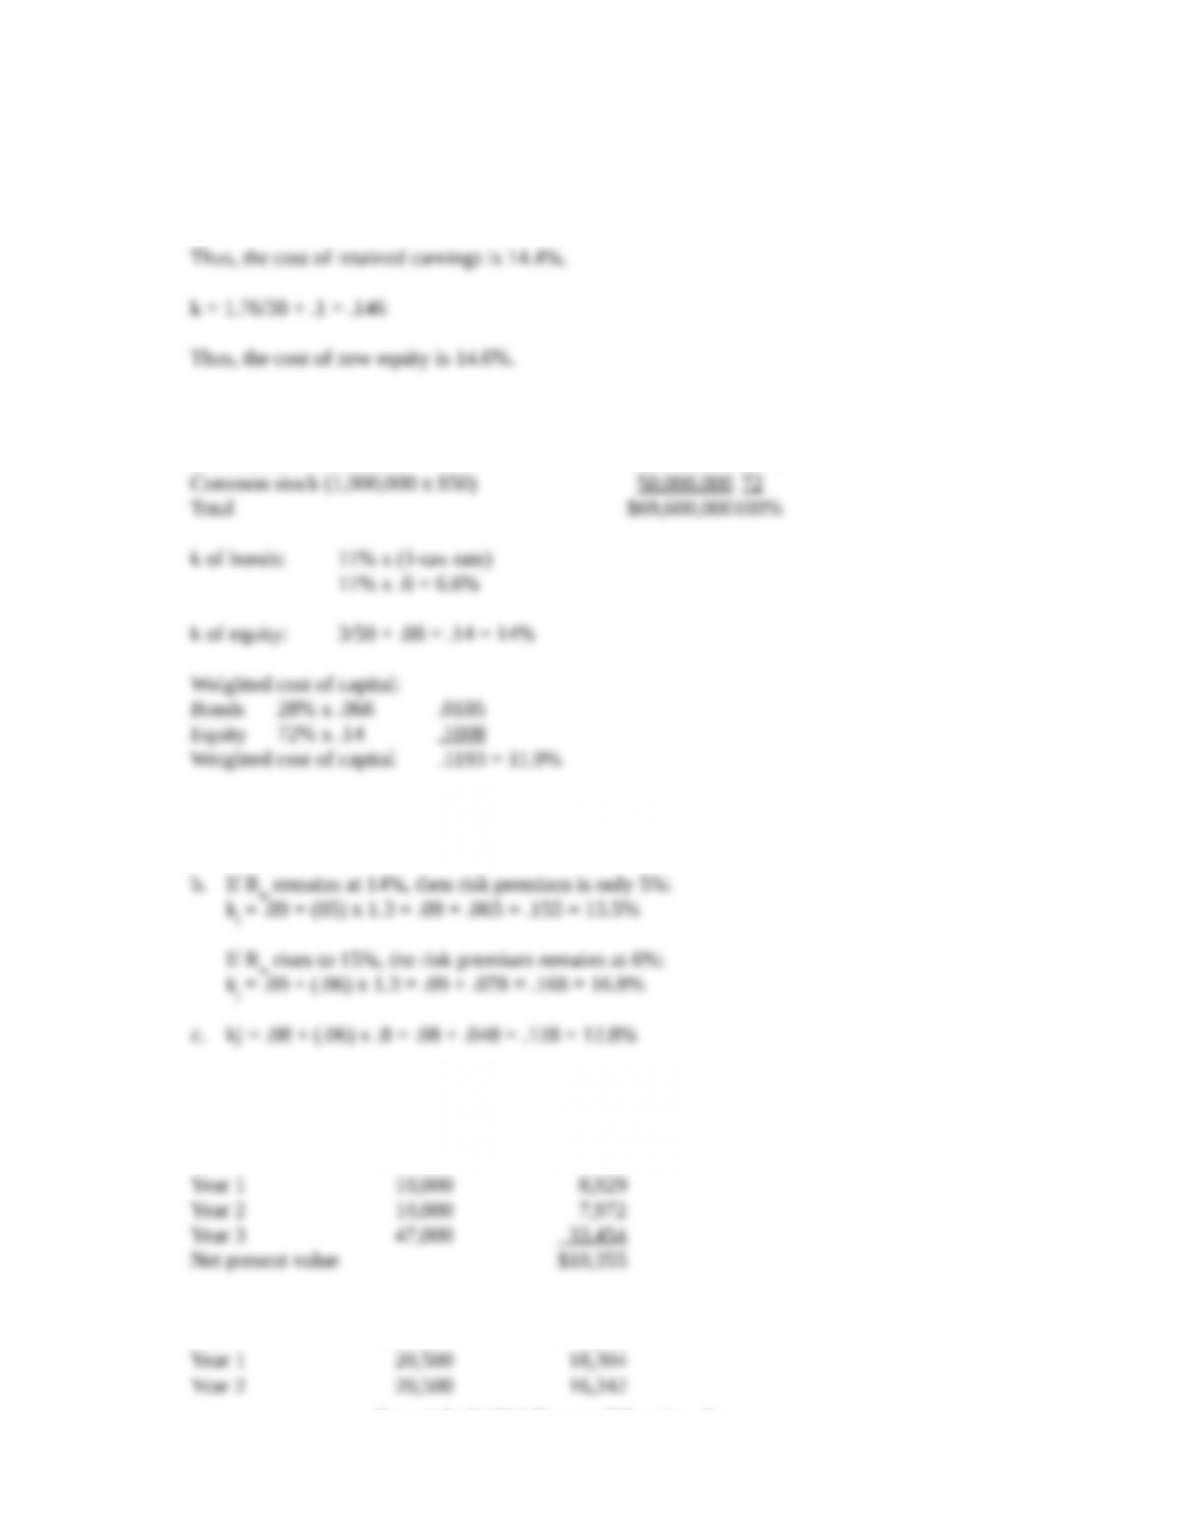
8. The dividend of $1.60 will grow by 10% to $1.76 in year 1.
k = 1.76/40 + .1 = .144
9. Market value weights:
Bonds (20,000 x $980) $19,600,000 28%
10. a. kj = Rf + (km – Rf) x beta
= .08 + (.14-.08) x 1.3 = .08 + .078 = .158 = 15.8%
11. a.Calculation of net present values
Project C Cash Flows PV of Cash Flows
Year 0 $-40,000 $-40,000
Project D Cash Flows PV of Cash Flows
Year 0 $-40,000 $-40,000
Copyright © 2014 Pearson Education, Inc.
Capital Budgeting and Risk 117
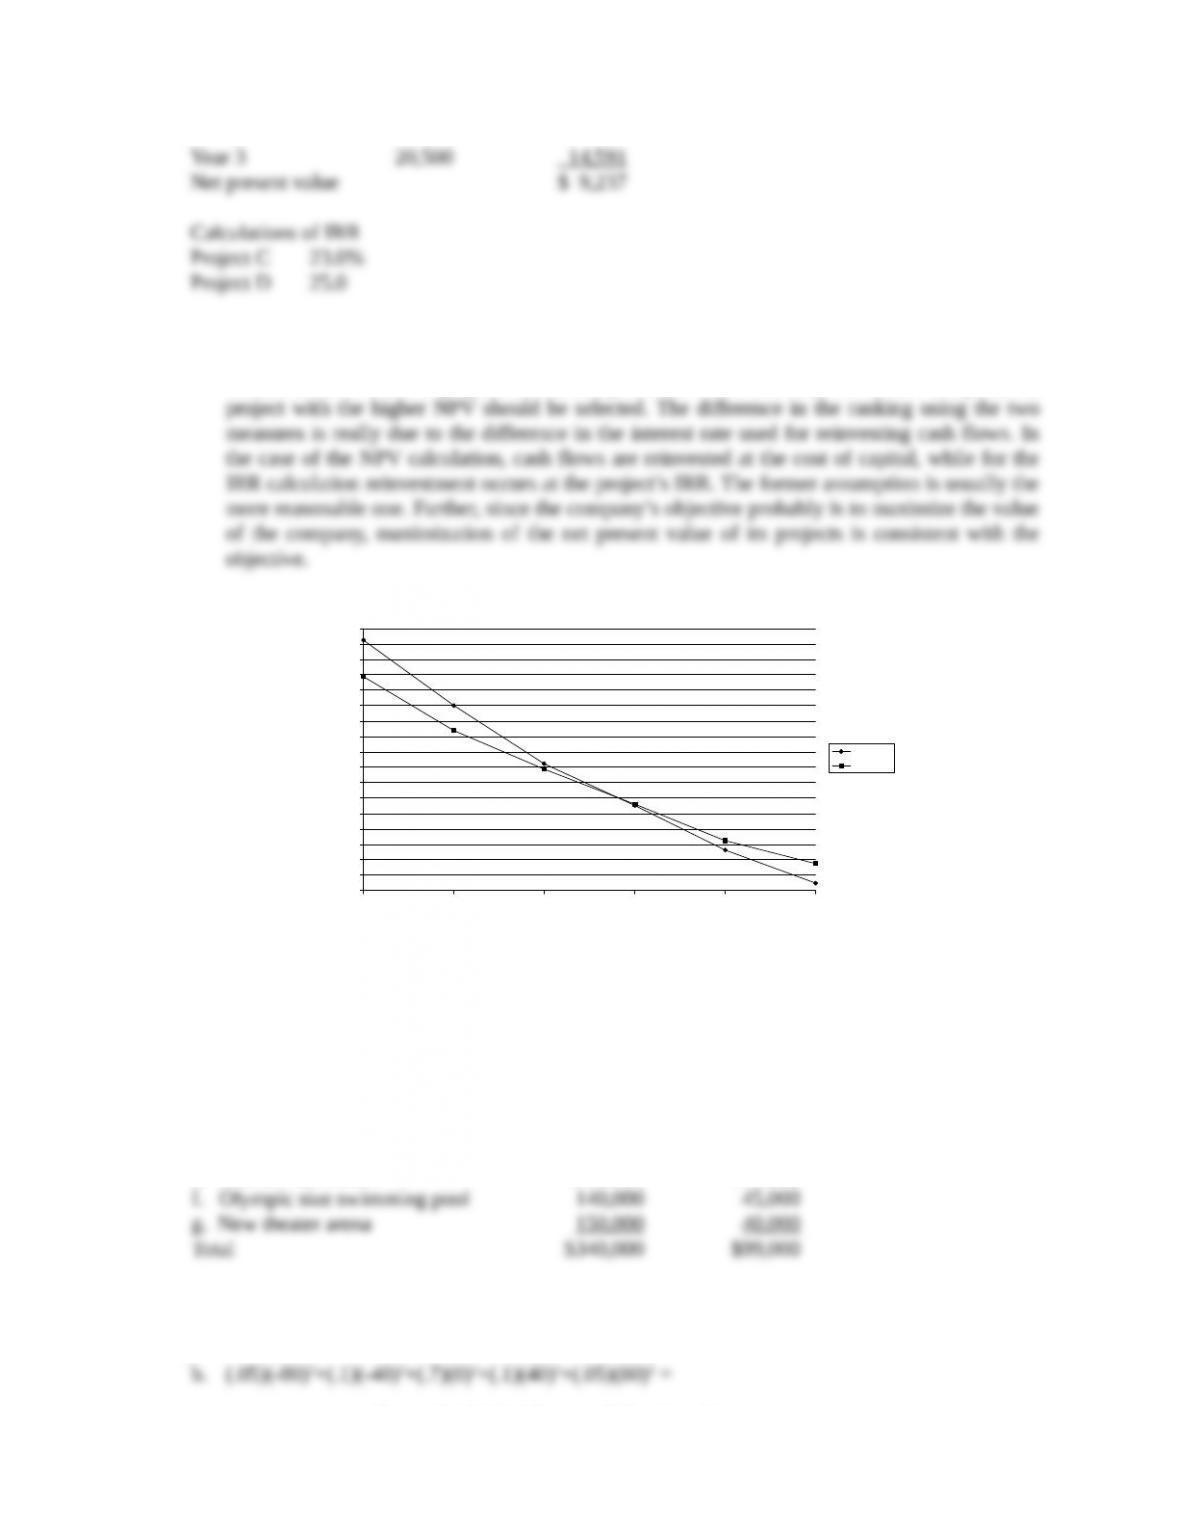
b. Project C has the higher net present value, while project D has the higher internal rate of return.
Most financial economists would agree that the net present value is the better of the two
measures, and when two projects are mutually exclusive and thus only one can be accepted, the
c.
Figure 12.1
12. The projects to be undertaken are those whose combination will obtain the highest net present value
while the capital expenditure remains with the limit of $340,000.
Using the trial and error method, it appears that the highest NPV can be obtained as follows:
Project Original Investment NPV
b. Kitchen renovation $ 50,000 $14,000
13. a. (.05)(240)+(.1)(280)+(.7)(320)+(.1)(360)+(.05)(400) = 320
Copyright © 2014 Pearson Education, Inc.
–6
–4
–2
0
2
4
6
8
10
12
14
16
18
20
22
24
26
28
0% 6% 12% 18% 24% 30%
Discount Rate
Project A
Project B
Capital Budgeting and Risk 118
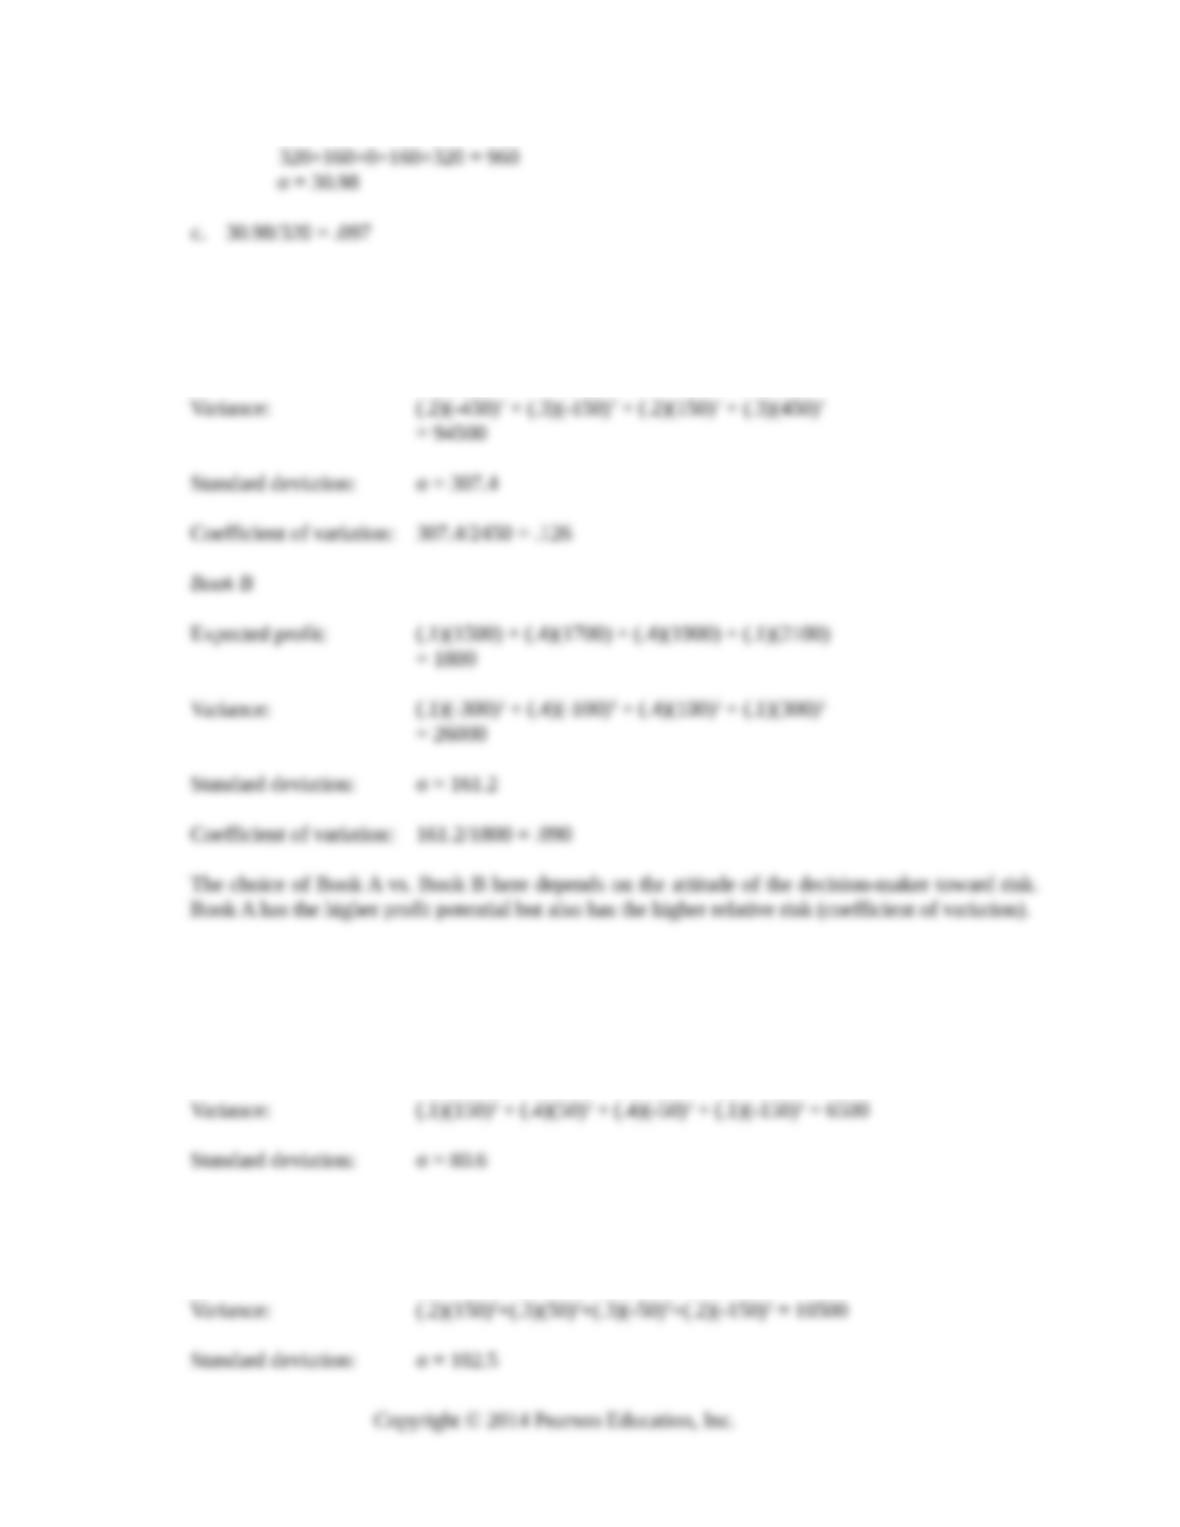
14. Book A
Expected profit: (.2)(2000) + (.3)(2300) + (.3)(2600) + (.2)(2900)
= 2450
15. a.
Year 1:
Expected cash flow: (.1)(700) + (.4)(600) + (.4)(500) + (.1)(400) = 550
Year 2:
Expected cash flow: (.2)(600)+(.3)(500)+(.3)(400)+(.2)(300) = 450
Capital Budgeting and Risk 119
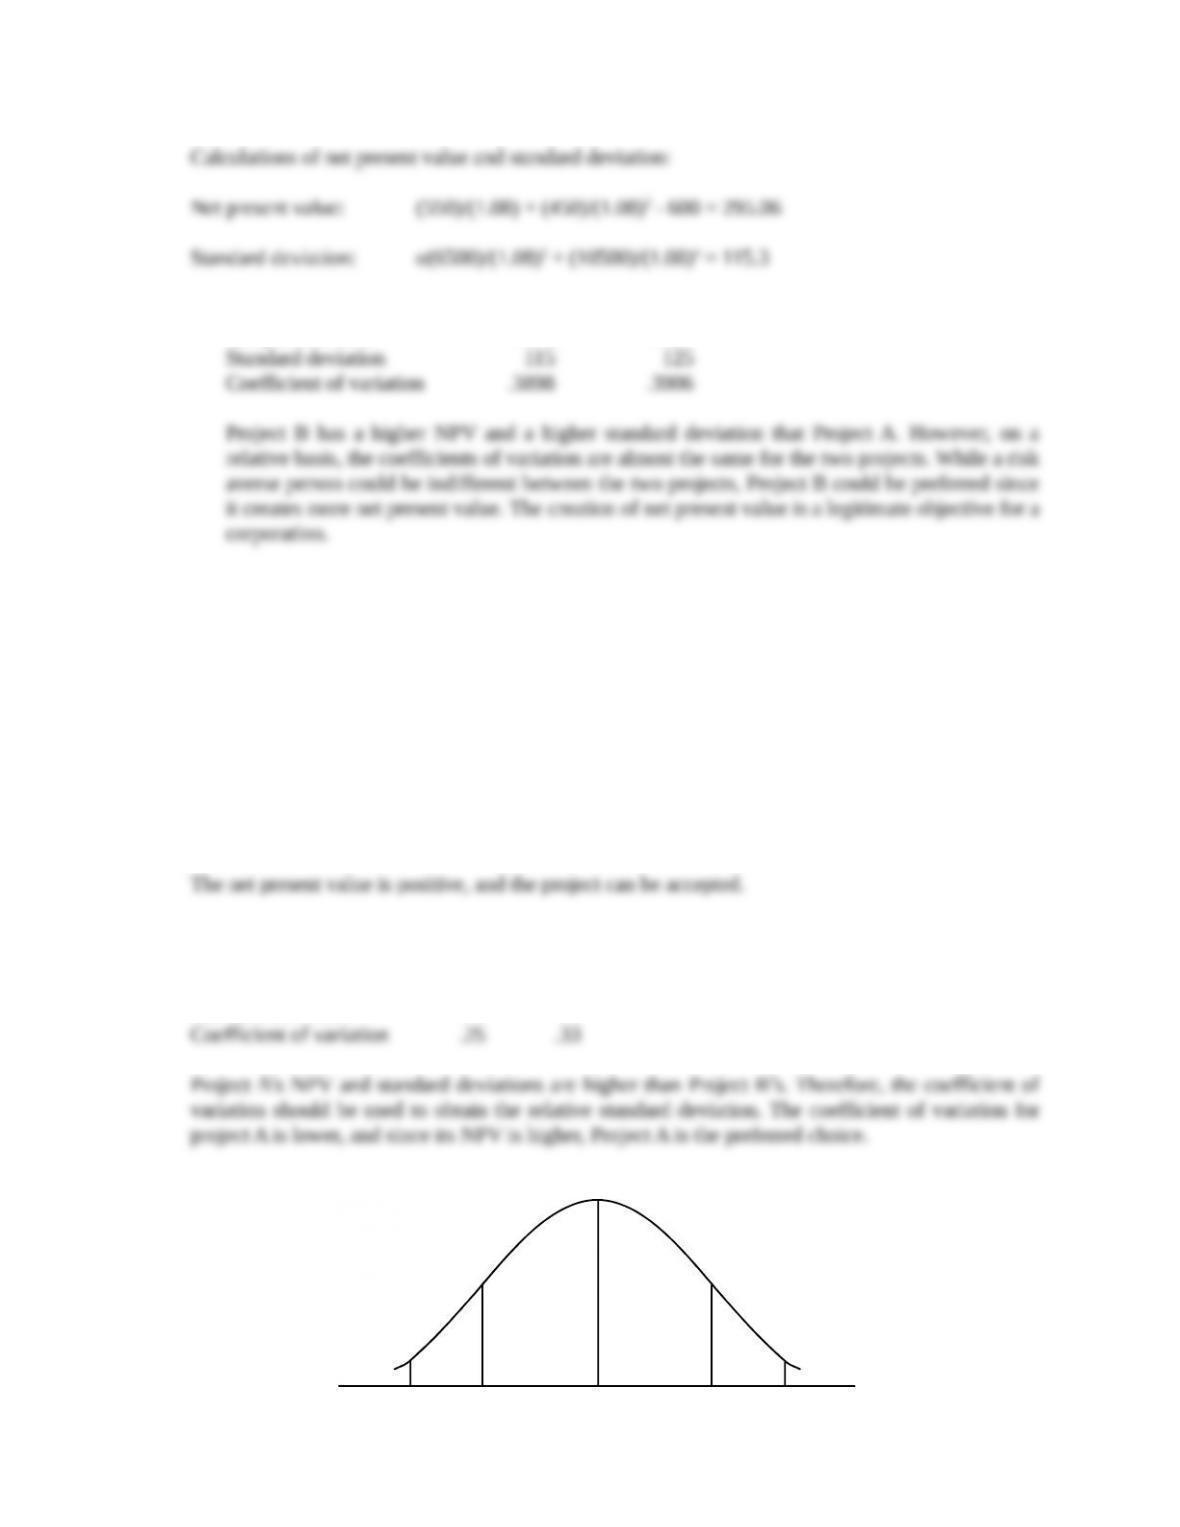
b. Project A Project B
Net present value $295 $320
16. Calculate the net present value of certain cash flows at the risk-free interest rate of 4%.
Cert Eq. Certain PV
Year Cash Flow Factor Cash Flow at 4%
0 $-20,000 1.0 $-20,000 $-20,000
1 5,000 .9 4,500 4,327
2 5,000 .9 4,500 4,161
3 5,000 .9 4,500 4,000
4 15,000 .7 10,500 8,975
Net present value $1,463
17.
Project A Project B
Net present value 500 300
Standard deviation 125 100
18. a.
Copyright © 2014 Pearson Education, Inc.
Capital Budgeting and Risk 120
Figure 12.2
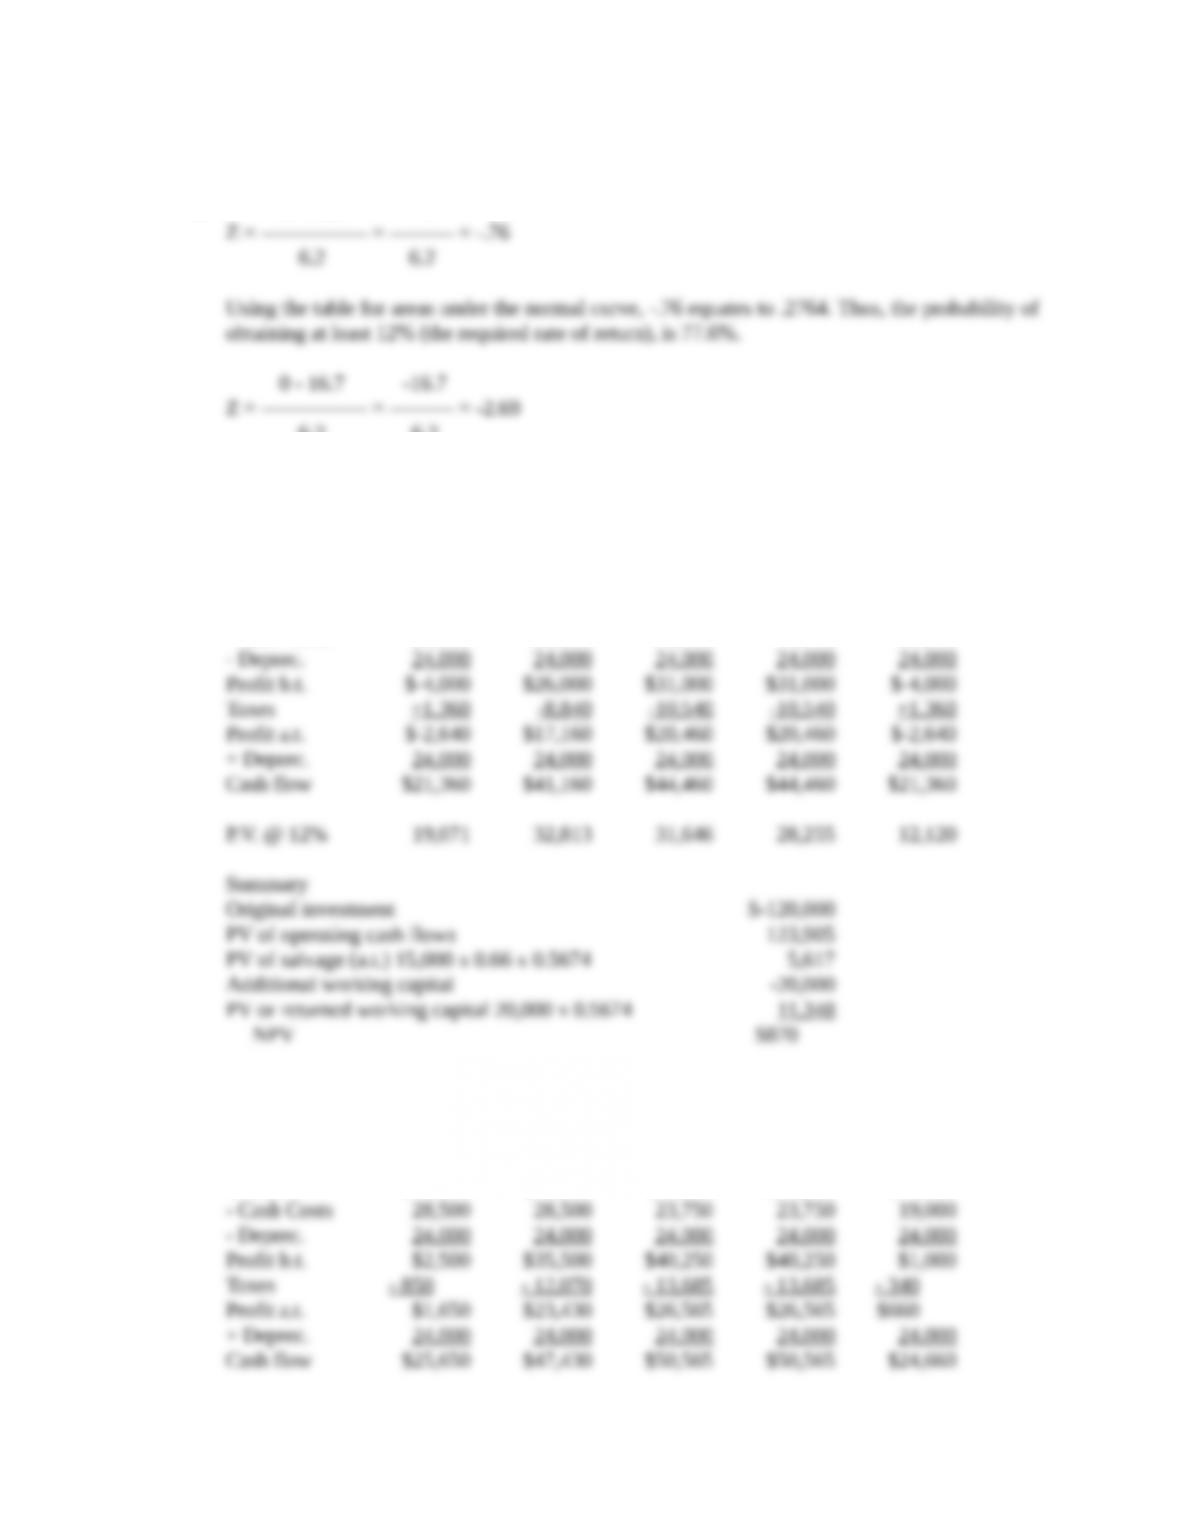
b. 12 – 16.7 -4.7
6.2 6.2
Again, using the table, -2.69 equates to .4964. Thus, the probability of the rate of return being
at least 0 is 99.6%.
19. a.
Year 1 Year 2 Year 3 Year 4 Year 5
Revenue $50,000 $80,000 $80,000 $80,000 $40,000
– Cash Costs 30,000 30,000 25,000 25,000 20,000
Since NPV is positive, project is acceptable.
b. (1)
Year 1 Year 2 Year 3 Year 4 Year 5
Revenue $55,000 $88,000 $88,000 $88,000 $44,000
Copyright © 2014 Pearson Education, Inc.
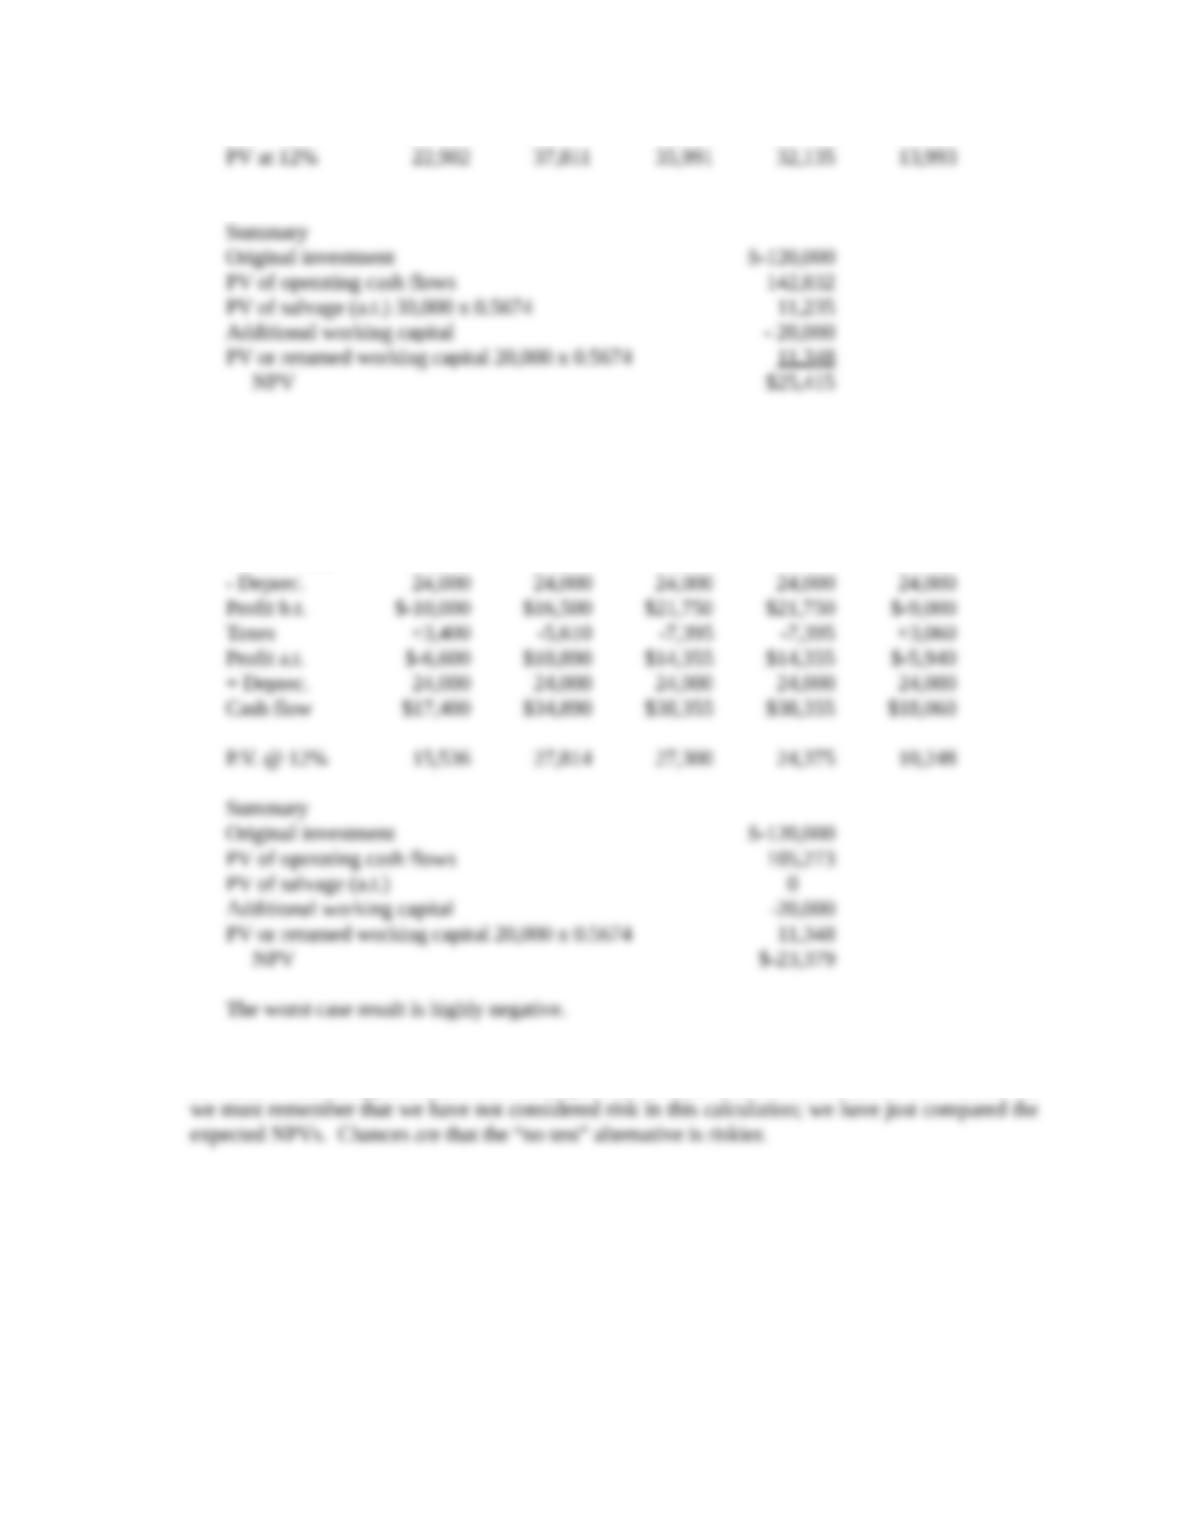
Capital Budgeting and Risk 121
The best case presents a high positive NPV.
b. (2)
Year 1 Year 2 Year 3 Year 4 Year 5
Revenue $45,000 $72,000 $72,000 $72,000 $36,000
– Cash Costs 31,500 31,500 26,250 26,250 21,000
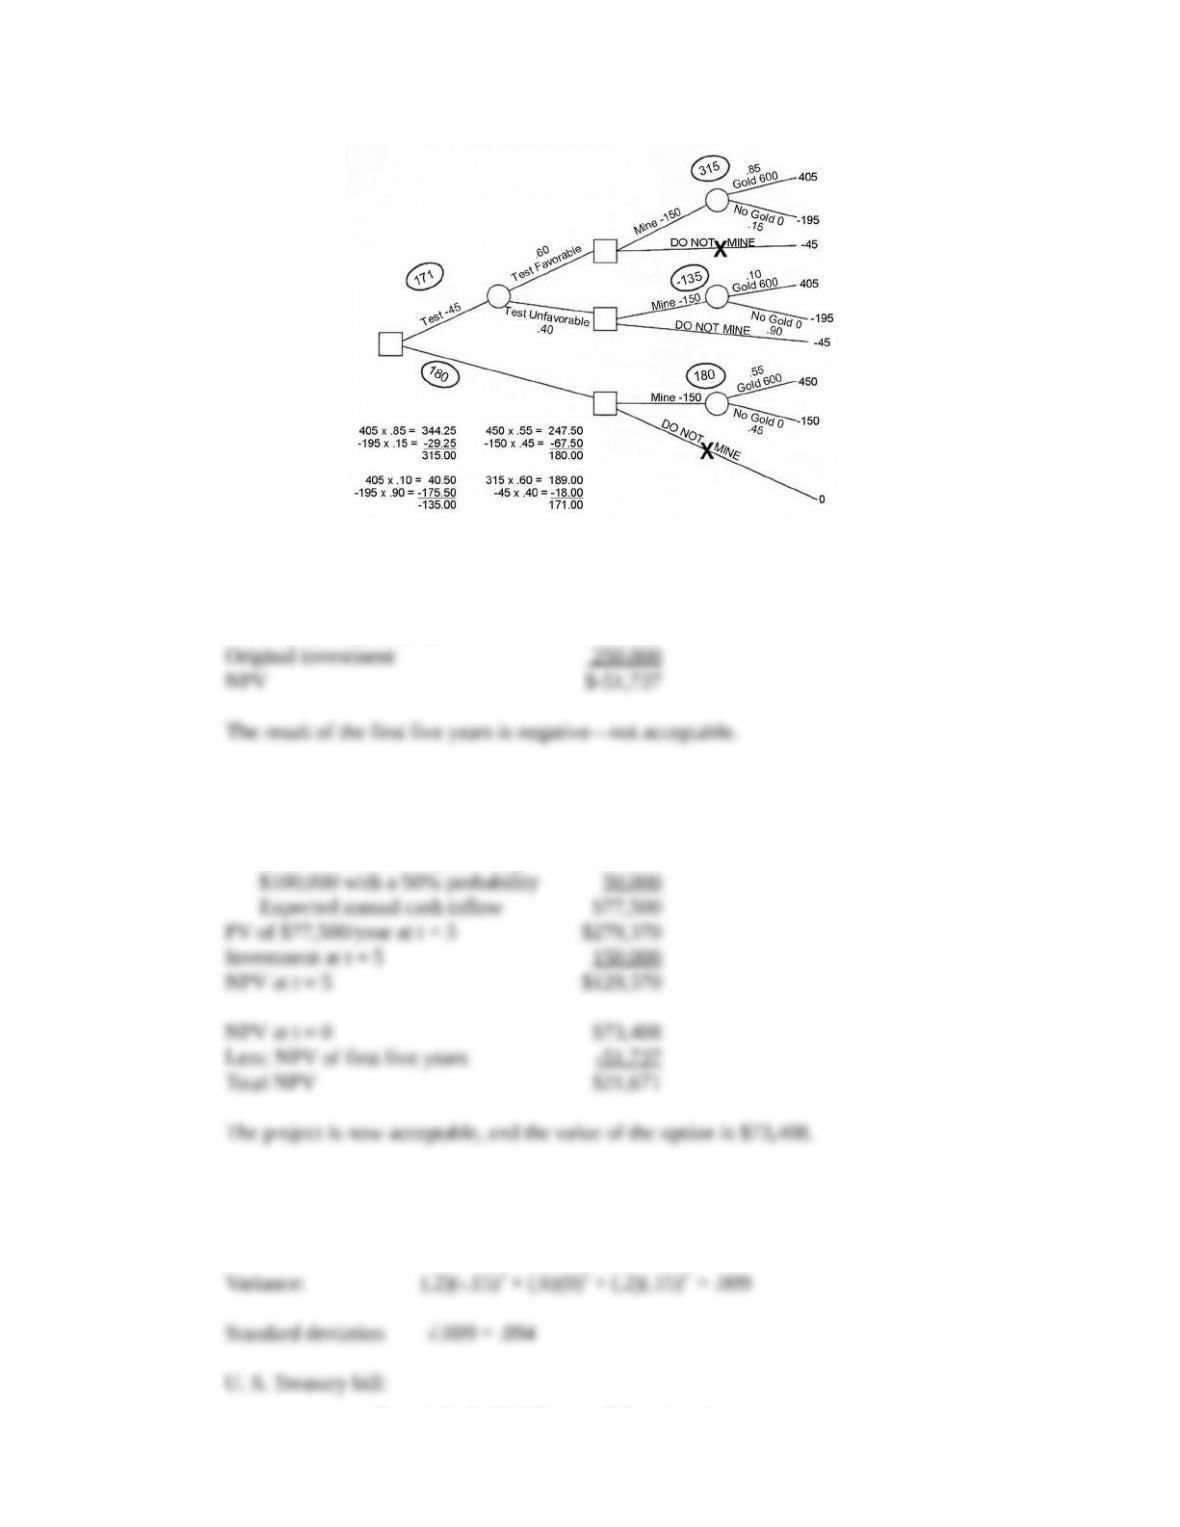
20. The net present value of the “no test” alternative $180,000, while if the test is performed the NPV is
$171,000. Thus it appears that Sam should proceed to mine without the additional test. However,
Copyright © 2014 Pearson Education, Inc.
Capital Budgeting and Risk 122
Figure 12.3
21. a. Result for the first five years:
PV of $55,000/year at 12% $198,263
b. Second five years:
Expected annual cash inflow
$55,000 with a 50% probability $27,500
22. Investment project:
Expected return: (.2)(-.05) + (.6)(.1) + (.2)(.25) = .1 = 10%
Copyright © 2014 Pearson Education, Inc.

Capital Budgeting and Risk 123
Copyright © 2014 Pearson Education, Inc.