
340 BUSINESS ANALYTICS MODULE F SI M U L A T I ON
ADDITIONAL HOMEWORK PROBLEMS
Here are solutions to additional homework problems that appear
4
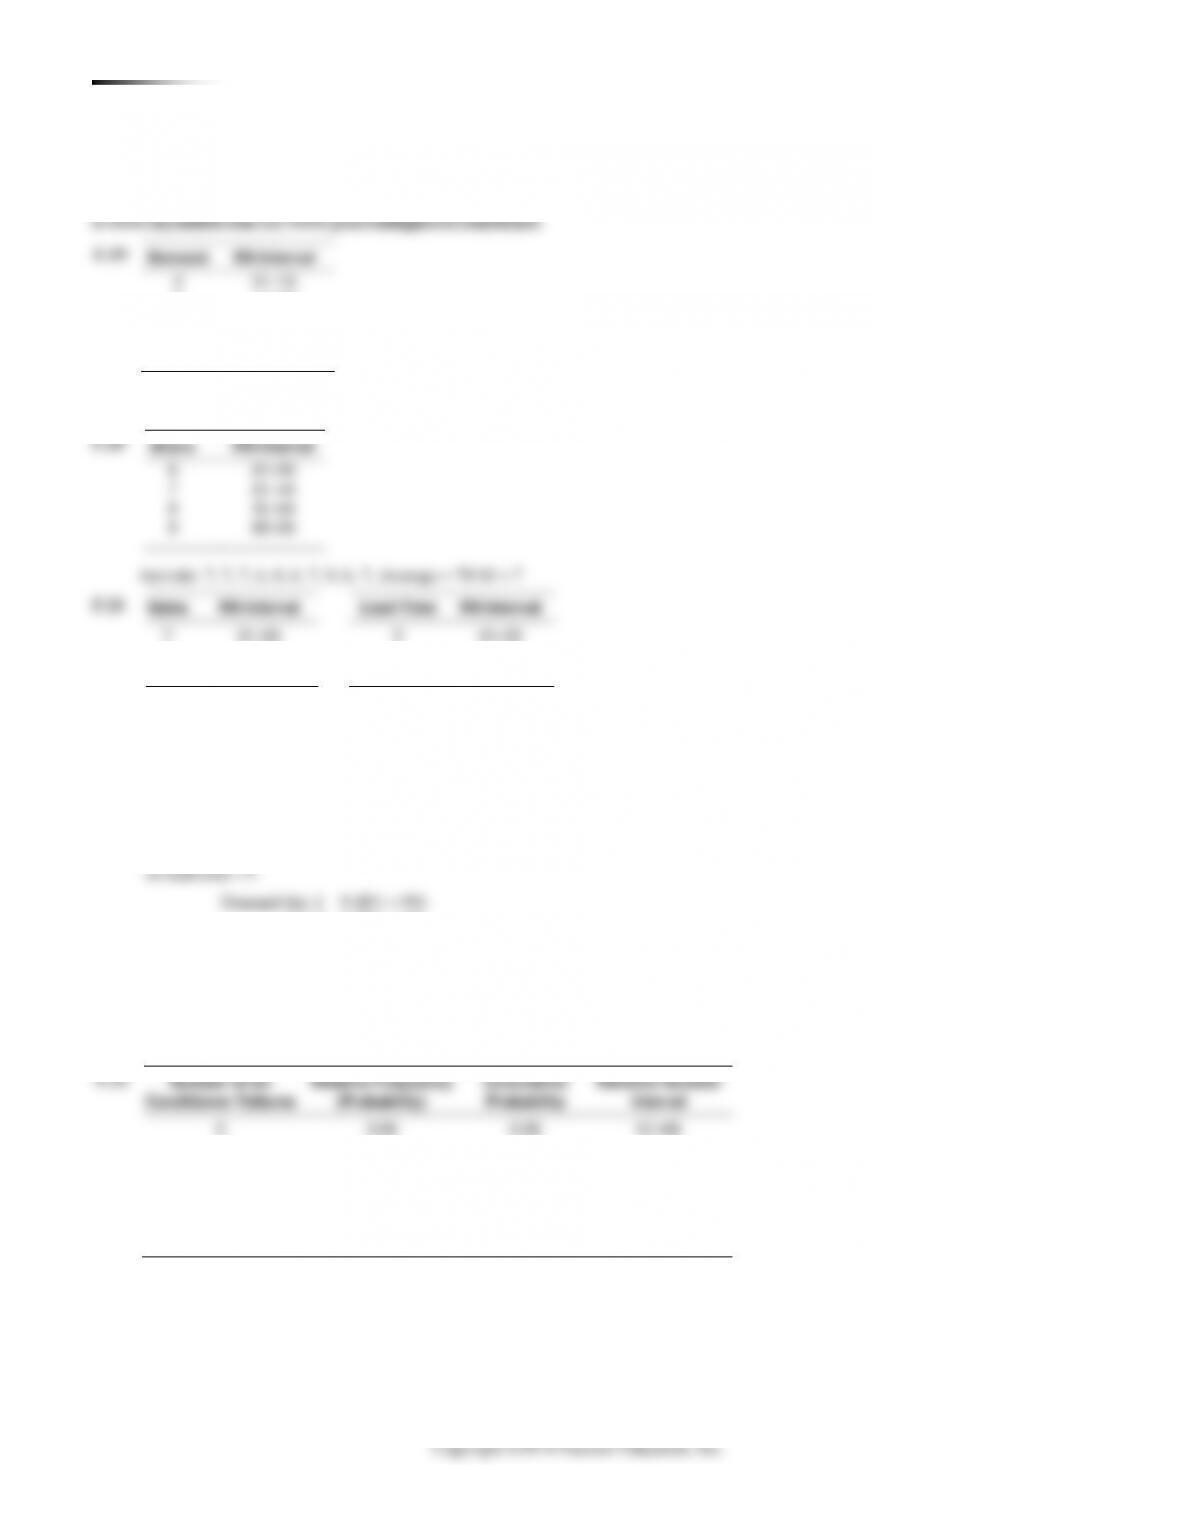
01–10
5
11–40
6
41–70
7
71–90
8
91–00
Random number stream: 88 02 28 49 36 87 21 95 50 24
Demand: 7 4 5 6 5 7 5 8 6 5
7
01–30
3
01–20
8
31–70
4
21–80
9
71–00
5
81–00
First order: RN = 60 so lead time = 4 days.
Demand day 1
8 (RN = 52)
day 2
9 (RN = 78)
day 3
7 (RN = 13)
day 4
7 (RN = 06)
Total demand during lead time = 31. Because the reorder
point is 32, there is no stockout. Second order: RN = 87
9 (RN = 99)
day 2
9 (RN = 98)
day 3
9 (RN = 80)
day 4
7 (RN = 09)
day 5
8 (RN = 67)
Total demand during lead time = 42. So the company
experienced a stockout during this time.
6
01–20
7
21–44
8
45–84
9
85–00
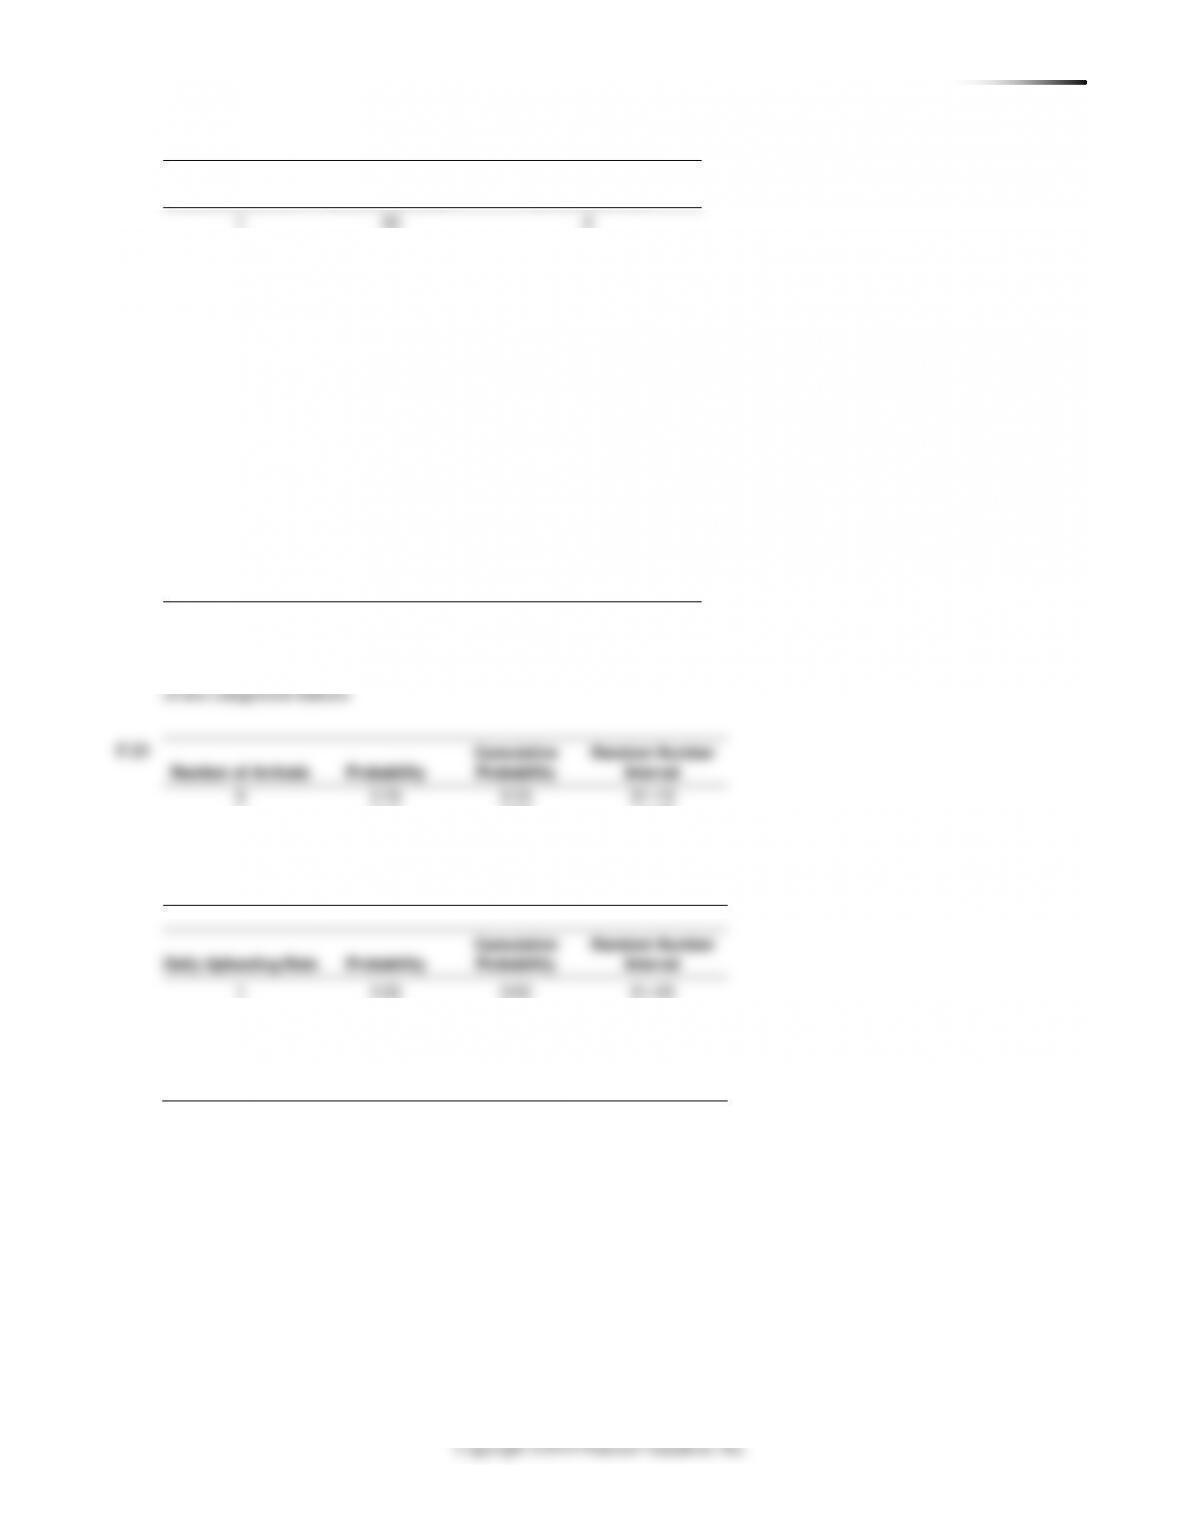
F.22
Number of Air
Relative Frequency
Cumulative
0
0.06
0.06
01–06
1
0.13
0.19
07–19
2
0.25
0.44
20–44
3
0.28
0.72
45–72
4
0.20
0.92
73–92
5
0.07
0.99
93–99
6
0.01
1.00
00

BUSINESS ANALYTICS MODULE F SI M U L A T I O N 341
1
50
3
2
28
2
3
68
3
4
36
2
5
90
4
6
62
3
7
27
2
8
50
3
9
18
1
10
36
2
11
61
3
12
21
2
13
46
3
14
01
0
15
14
1
16
81
4
17
87
4
18
72
3
19
80
4
20
46
3
* Random numbers taken from Column 3 of Table F.4, starting at
the top.
No, it is not common to find 3 or more years in a row with two
0
0.13
0.13
01–13
1
0.17
0.30
14–30
2
0.15
0.45
31–45
3
0.25
0.70
46–70
4
0.20
0.90
71–90
5
0.10
1.00
91–00
1
0.03
0.03
01–03
2
0.12
0.15
04–15
3
0.40
0.55
16–55
4
0.28
0.83
56–83
5
0.12
0.95
84–95
6
0.05
1.00
96–00


342 BUSINESS ANALYTICS MODULE F SI M U L A T I ON
6
Average number of barges delayed per day 0.4
15
31
Average arrivals per day 2.07
15
31
Average unloaded per day 2.07
15
==
==
==
350
0.40
0.40
01–40
400
0.20
0.60
41–60
450
0.30
0.90
61–90
500
0.10
1.00
91–00
300
0.10
0.10
01–10
400
0.45
0.55
11–55
500
0.30
0.85
56–85
600
0.15
1.00
86–00
1
600
52
400
37
400
600
2
600
06
350
63
500
450
3
450
50
400
28
400
450
4
600
88
450
02
300
600
5
500
53
400
74
500
500
6
450
30
350
35
400
450
7
400
10
350
24
400
400
8
400
47
400
03
300
500
9
500
99
500
29
400
600
10
600
37
350
60
500
450
11
450
66
450
74
500
400
12
400
91
500
85
500
400
Number
Daily
Day
Delayed
Unloaded
Unloaded
1
—
37
2
2
69
2
2
0
77
4
4
84
4
3
0
13
0
0
12
0
4
0
10
0
0
94
0
5
0
02
0
0
51
0
6
0
18
1
1
36
1
7
0
31
2
2
17
2
8
0
19
1
1
02
1
9
0
32
2
2
15
2
10
0
85
4
4
29
3
11
1
31
2
3
16
3
12
0
94
5
5
52
3
13
2
81
4
6
56
4
14
2
43
2
4
43
3
15
1
31
2
3
26
3
= 6


10
0.05
0.05
01–05
20
0.15
0.20
06–20
30
0.15
0.35
21–35
40
0.20
0.55
36–55
50
0.20
0.75
56–75
60
0.15
0.90
76–90
70
0.10
1.00
91–00
MTBF All
100
0.15
0.15
01–15
110
0.25
0.40
16–40
120
0.35
0.75
41–75
130
0.20
0.95
76–95
140
0.05
1.00
96–00
One Pen Replaced
Random
MTBF (Hours)
47
40
99
140
03
10
29
110
11
20
27
110
10
20
75
120
67
50
89
130
23
30
78
130
89
60
68
120
62
50
64
120
56
50
62
120
74
50
30
110
130 0.20 140 0.05 117.5 hours
E MTBF = + +
+ + =
Cost/breakdown = 4 $8/pen + $100/repair = $132
Cb = $132/breakdown 117.5 hours/breakdown
10 pens $8 10 repairs $50 / hr 1 hr / repair
$580
580 $1.53 / hr
380 hours 380
t
t
b
40 pens $8 10 repairs $50 / hr 2 hrs/repair
$1320
1320 $1.09 / hr
1210 hours 1210
t
t
b
40 0.20 50 0.20 60 0.15 70 0.10
42 hours
E MTBF = + +
+ + + +


344 BUSINESS ANALYTICS MODULE F SI M U L A T I ON
A spreadsheet model for the scenario, consisting of the
following items, should be constructed,
Arrival Interval Distribution
Prob.
0.11
0
10
1
0.21
11
31
2
0.22
32
53
3
0.20
54
73
4
0.16
74
89
5
0.10
90
99
6
Service Time Distribution
0.20
0
19
1
0.19
20
38
2
0.18
39
56
3
0.17
57
73
4
0.13
74
86
5
0.10
87
96
6
0.03
97
99
7
The two tables above are used for the random number generation
of arrival and service times to the given distributions. (Random
number lower limits could have started at 01, with upper limits
set at 00.)
Time
No.
Gap
Start
15.5
12.0
0.15
95.9%
Summary for This Trial Run
34.0
32.0
2.00
0
0
1
27
2
82
5
2
2
7
5
0
2
2
8
1
60
4
3
7
11
8
4
0
3
93
6
25
2
9
11
13
4
2
0
4
93
6
36
2
15
15
17
2
0
2
5
65
4
91
6
19
19
25
6
0
2
6
44
3
88
6
22
25
31
9
3
0
7
41
3
23
2
25
31
33
8
6
0
•
•
•
•
•
•
•
•
•
•
•
•
•
•
•
•
•
•

Summary of Trials
Time
Time
Time
8.9
5.7
0.40
88.4%
Max:
18.0
14.5
4.3
98.1%
Trial #
1
7.6
4.0
0.43
89.5%
1
14.0
10.0
4.0
2
8.6
5.1
0.23
93.9%
2
17.0
15.0
5.0
3
3.8
1.2
1.00
72.4%
3
10.0
7.0
5.0
4
17.3
13.8
0.25
93.4%
4
30.0
27.0
3.0
5
4.8
1.8
0.65
82.3%
5
11.0
6.0
6.0
6
6.0
2.8
0.80
80.0%
6
14.0
9.0
4.0
7
7.8
4.1
0.25
93.6%
7
13.0
11.0
5.0
8
4.7
1.9
0.55
83.5%
8
9.0
7.0
5.0
•
•
•
•
•
•
•
•
•
•
•

346 BUSINESS ANALYTICS MODULE F SI M U L A T I ON
Conclusion
The application described above, although not exceedingly
complex, is nevertheless considered to be more realistic than
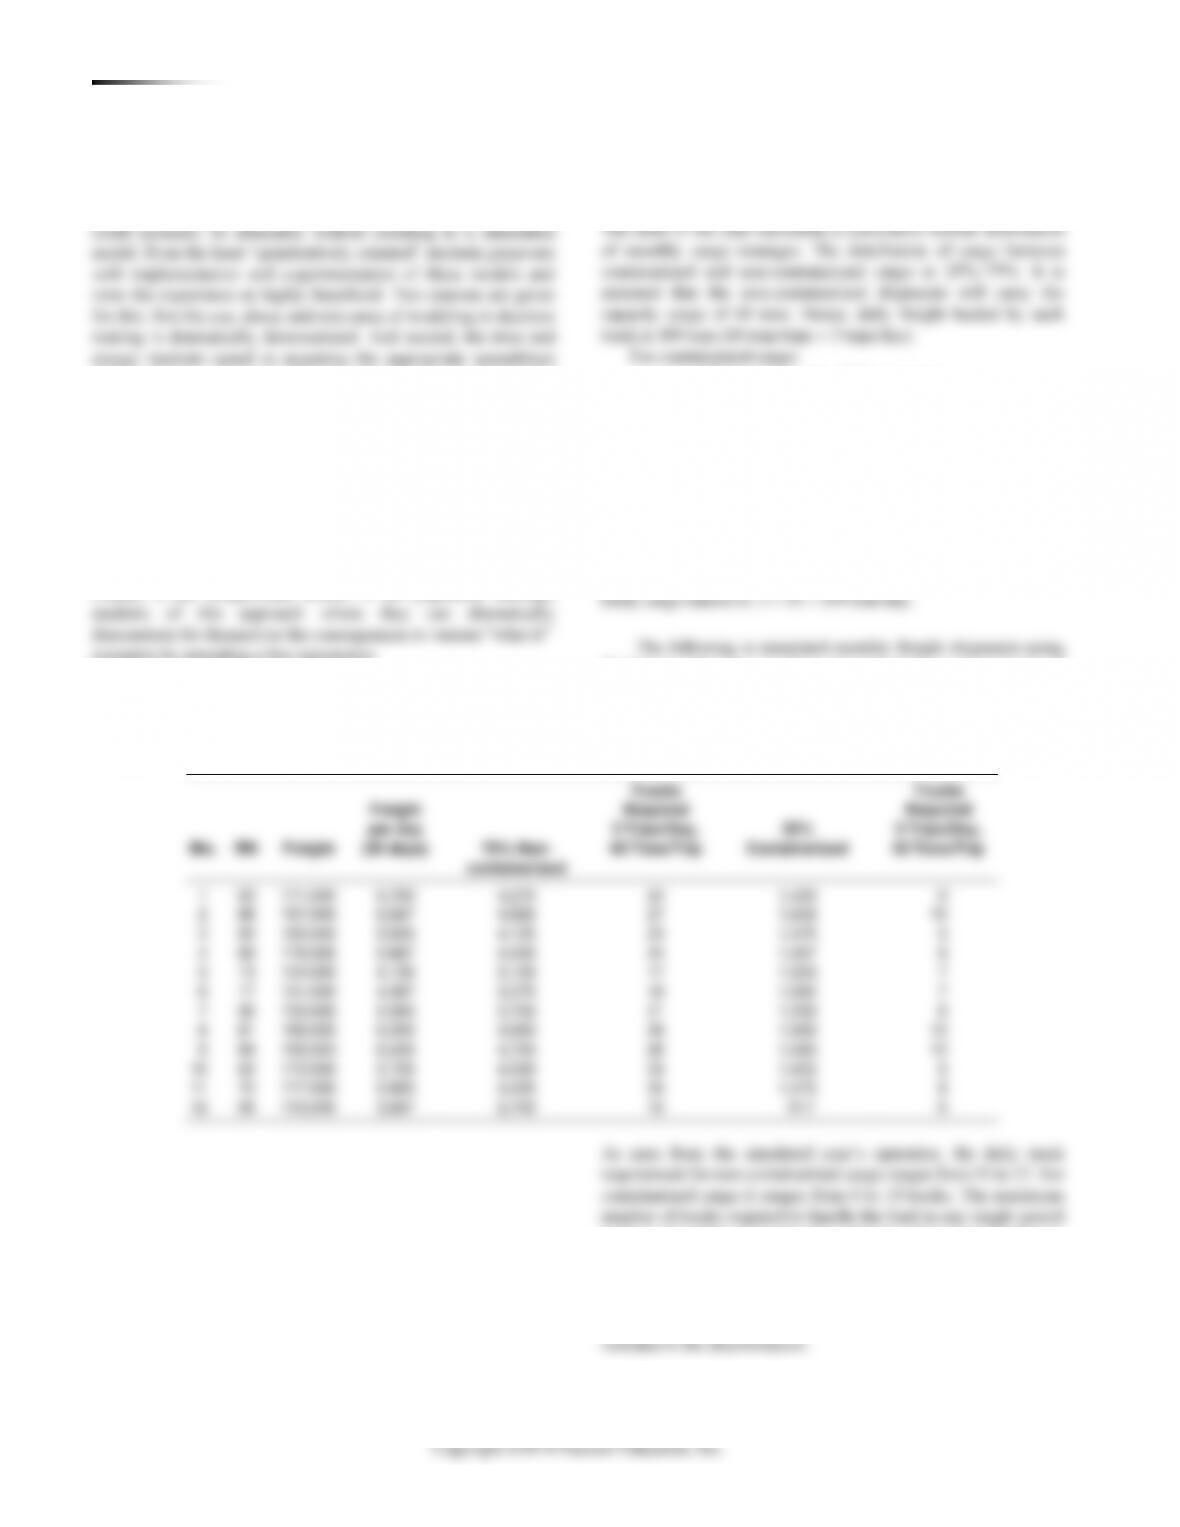
60% is packaged in 40-ft. containers
20% is packaged in 30-ft. containers
20% is packaged in 20-ft. containers
Cargo weights:
30 ft. handles 45 tons
20 ft. handles 20 tons
It is noted that a truck can carry two 20-foot containers, so
that the total cargo is 40 tons. Thus, average cargo hauled by con–
tainerized freight is 53 tons, or 0.6 60 + 0.2 45 0.2 0.40.
30 Days/month. Cargo is then categorized into containerized and
non-containerized shipments. The daily truck requirements for
each month is projected.
is 37. It should be noted that the utilization factor is 0.96. Hence,
the number of trucks should be adjusted upward accordingly.
Students should simulate future periods with a given fleet
size weighing the opportunity cost of trucks (cost of capital)
against demurrage penalties. Container demurrage should also be
Freight
3 Trips/Day,
25%
3 Trips/Day,
Mo.
RN
75% Non-
containerized
60 Tons/Trip
Containerized
53 Tons/Trip
1
63
171,000
5,700
4,275
24
1,425
9
2
88
197,000
6,567
4,925
27
1,642
10
3
55
165,000
5,500
4,125
23
1,375
9
4
69
176,000
5,867
4,400
24
1,467
9
5
13
124,000
4,133
3,100
17
1,033
7
6
17
131,000
4,367
3,275
18
1,092
7
7
36
150,000
5,000
3,750
21
1,250
8
8
81
186,000
6,200
4,650
26
1,550
10
9
84
190,000
6,333
4,750
26
1,583
10
10
63
172,000
5,733
4,300
24
1,433
9
11
70
177,000
5,900
4,425
25
1,475
9
12
06
110,000
3,667
2,750
15
917
6


BUSINESS ANALYTICS MODULE F SI M U L A T I O N 347
BUSINESS ANALYTICS MODULE F SI M U L A T I O N 341
1
50
3
2
28
2
3
68
3
4
36
2
5
90
4
6
62
3
7
27
2
8
50
3
9
18
1
10
36
2
11
61
3
12
21
2
13
46
3
14
01
0
15
14
1
16
81
4
17
87
4
18
72
3
19
80
4
20
46
3
* Random numbers taken from Column 3 of Table F.4, starting at
the top.
No, it is not common to find 3 or more years in a row with two
0
0.13
0.13
01–13
1
0.17
0.30
14–30
2
0.15
0.45
31–45
3
0.25
0.70
46–70
4
0.20
0.90
71–90
5
0.10
1.00
91–00
1
0.03
0.03
01–03
2
0.12
0.15
04–15
3
0.40
0.55
16–55
4
0.28
0.83
56–83
5
0.12
0.95
84–95
6
0.05
1.00
96–00
342 BUSINESS ANALYTICS MODULE F SI M U L A T I ON
6
Average number of barges delayed per day 0.4
15
31
Average arrivals per day 2.07
15
31
Average unloaded per day 2.07
15
==
==
==
350
0.40
0.40
01–40
400
0.20
0.60
41–60
450
0.30
0.90
61–90
500
0.10
1.00
91–00
300
0.10
0.10
01–10
400
0.45
0.55
11–55
500
0.30
0.85
56–85
600
0.15
1.00
86–00
1
600
52
400
37
400
600
2
600
06
350
63
500
450
3
450
50
400
28
400
450
4
600
88
450
02
300
600
5
500
53
400
74
500
500
6
450
30
350
35
400
450
7
400
10
350
24
400
400
8
400
47
400
03
300
500
9
500
99
500
29
400
600
10
600
37
350
60
500
450
11
450
66
450
74
500
400
12
400
91
500
85
500
400
Number
Daily
Day
Delayed
Unloaded
Unloaded
1
—
37
2
2
69
2
2
0
77
4
4
84
4
3
0
13
0
0
12
0
4
0
10
0
0
94
0
5
0
02
0
0
51
0
6
0
18
1
1
36
1
7
0
31
2
2
17
2
8
0
19
1
1
02
1
9
0
32
2
2
15
2
10
0
85
4
4
29
3
11
1
31
2
3
16
3
12
0
94
5
5
52
3
13
2
81
4
6
56
4
14
2
43
2
4
43
3
15
1
31
2
3
26
3
= 6
10
0.05
0.05
01–05
20
0.15
0.20
06–20
30
0.15
0.35
21–35
40
0.20
0.55
36–55
50
0.20
0.75
56–75
60
0.15
0.90
76–90
70
0.10
1.00
91–00
MTBF All
100
0.15
0.15
01–15
110
0.25
0.40
16–40
120
0.35
0.75
41–75
130
0.20
0.95
76–95
140
0.05
1.00
96–00
One Pen Replaced
Random
MTBF (Hours)
47
40
99
140
03
10
29
110
11
20
27
110
10
20
75
120
67
50
89
130
23
30
78
130
89
60
68
120
62
50
64
120
56
50
62
120
74
50
30
110
130 0.20 140 0.05 117.5 hours
E MTBF = + +
+ + =
Cost/breakdown = 4 $8/pen + $100/repair = $132
Cb = $132/breakdown 117.5 hours/breakdown
10 pens $8 10 repairs $50 / hr 1 hr / repair
$580
580 $1.53 / hr
380 hours 380
t
t
b
40 pens $8 10 repairs $50 / hr 2 hrs/repair
$1320
1320 $1.09 / hr
1210 hours 1210
t
t
b
40 0.20 50 0.20 60 0.15 70 0.10
42 hours
E MTBF = + +
+ + + +
344 BUSINESS ANALYTICS MODULE F SI M U L A T I ON
A spreadsheet model for the scenario, consisting of the
following items, should be constructed,
Arrival Interval Distribution
Prob.
0.11
0
10
1
0.21
11
31
2
0.22
32
53
3
0.20
54
73
4
0.16
74
89
5
0.10
90
99
6
Service Time Distribution
0.20
0
19
1
0.19
20
38
2
0.18
39
56
3
0.17
57
73
4
0.13
74
86
5
0.10
87
96
6
0.03
97
99
7
The two tables above are used for the random number generation
of arrival and service times to the given distributions. (Random
number lower limits could have started at 01, with upper limits
set at 00.)
Time
No.
Gap
Start
15.5
12.0
0.15
95.9%
Summary for This Trial Run
34.0
32.0
2.00
0
0
1
27
2
82
5
2
2
7
5
0
2
2
8
1
60
4
3
7
11
8
4
0
3
93
6
25
2
9
11
13
4
2
0
4
93
6
36
2
15
15
17
2
0
2
5
65
4
91
6
19
19
25
6
0
2
6
44
3
88
6
22
25
31
9
3
0
7
41
3
23
2
25
31
33
8
6
0
•
•
•
•
•
•
•
•
•
•
•
•
•
•
•
•
•
•
Summary of Trials
Time
Time
Time
8.9
5.7
0.40
88.4%
Max:
18.0
14.5
4.3
98.1%
Trial #
1
7.6
4.0
0.43
89.5%
1
14.0
10.0
4.0
2
8.6
5.1
0.23
93.9%
2
17.0
15.0
5.0
3
3.8
1.2
1.00
72.4%
3
10.0
7.0
5.0
4
17.3
13.8
0.25
93.4%
4
30.0
27.0
3.0
5
4.8
1.8
0.65
82.3%
5
11.0
6.0
6.0
6
6.0
2.8
0.80
80.0%
6
14.0
9.0
4.0
7
7.8
4.1
0.25
93.6%
7
13.0
11.0
5.0
8
4.7
1.9
0.55
83.5%
8
9.0
7.0
5.0
•
•
•
•
•
•
•
•
•
•
•
346 BUSINESS ANALYTICS MODULE F SI M U L A T I ON
Conclusion
The application described above, although not exceedingly
complex, is nevertheless considered to be more realistic than
60% is packaged in 40-ft. containers
20% is packaged in 30-ft. containers
20% is packaged in 20-ft. containers
Cargo weights:
30 ft. handles 45 tons
20 ft. handles 20 tons
It is noted that a truck can carry two 20-foot containers, so
that the total cargo is 40 tons. Thus, average cargo hauled by con–
tainerized freight is 53 tons, or 0.6 60 + 0.2 45 0.2 0.40.
30 Days/month. Cargo is then categorized into containerized and
non-containerized shipments. The daily truck requirements for
each month is projected.
is 37. It should be noted that the utilization factor is 0.96. Hence,
the number of trucks should be adjusted upward accordingly.
Students should simulate future periods with a given fleet
size weighing the opportunity cost of trucks (cost of capital)
against demurrage penalties. Container demurrage should also be
Freight
3 Trips/Day,
25%
3 Trips/Day,
Mo.
RN
75% Non-
containerized
60 Tons/Trip
Containerized
53 Tons/Trip
1
63
171,000
5,700
4,275
24
1,425
9
2
88
197,000
6,567
4,925
27
1,642
10
3
55
165,000
5,500
4,125
23
1,375
9
4
69
176,000
5,867
4,400
24
1,467
9
5
13
124,000
4,133
3,100
17
1,033
7
6
17
131,000
4,367
3,275
18
1,092
7
7
36
150,000
5,000
3,750
21
1,250
8
8
81
186,000
6,200
4,650
26
1,550
10
9
84
190,000
6,333
4,750
26
1,583
10
10
63
172,000
5,733
4,300
24
1,433
9
11
70
177,000
5,900
4,425
25
1,475
9
12
06
110,000
3,667
2,750
15
917
6
BUSINESS ANALYTICS MODULE F SI M U L A T I O N 347