320 BUSINESS ANALYTICS MODULE D WA I T I N G – LI N E MO D E L S
322 BUSINESS ANALYTICS MODULE D WA I T I N G – LI N E MO D E L S
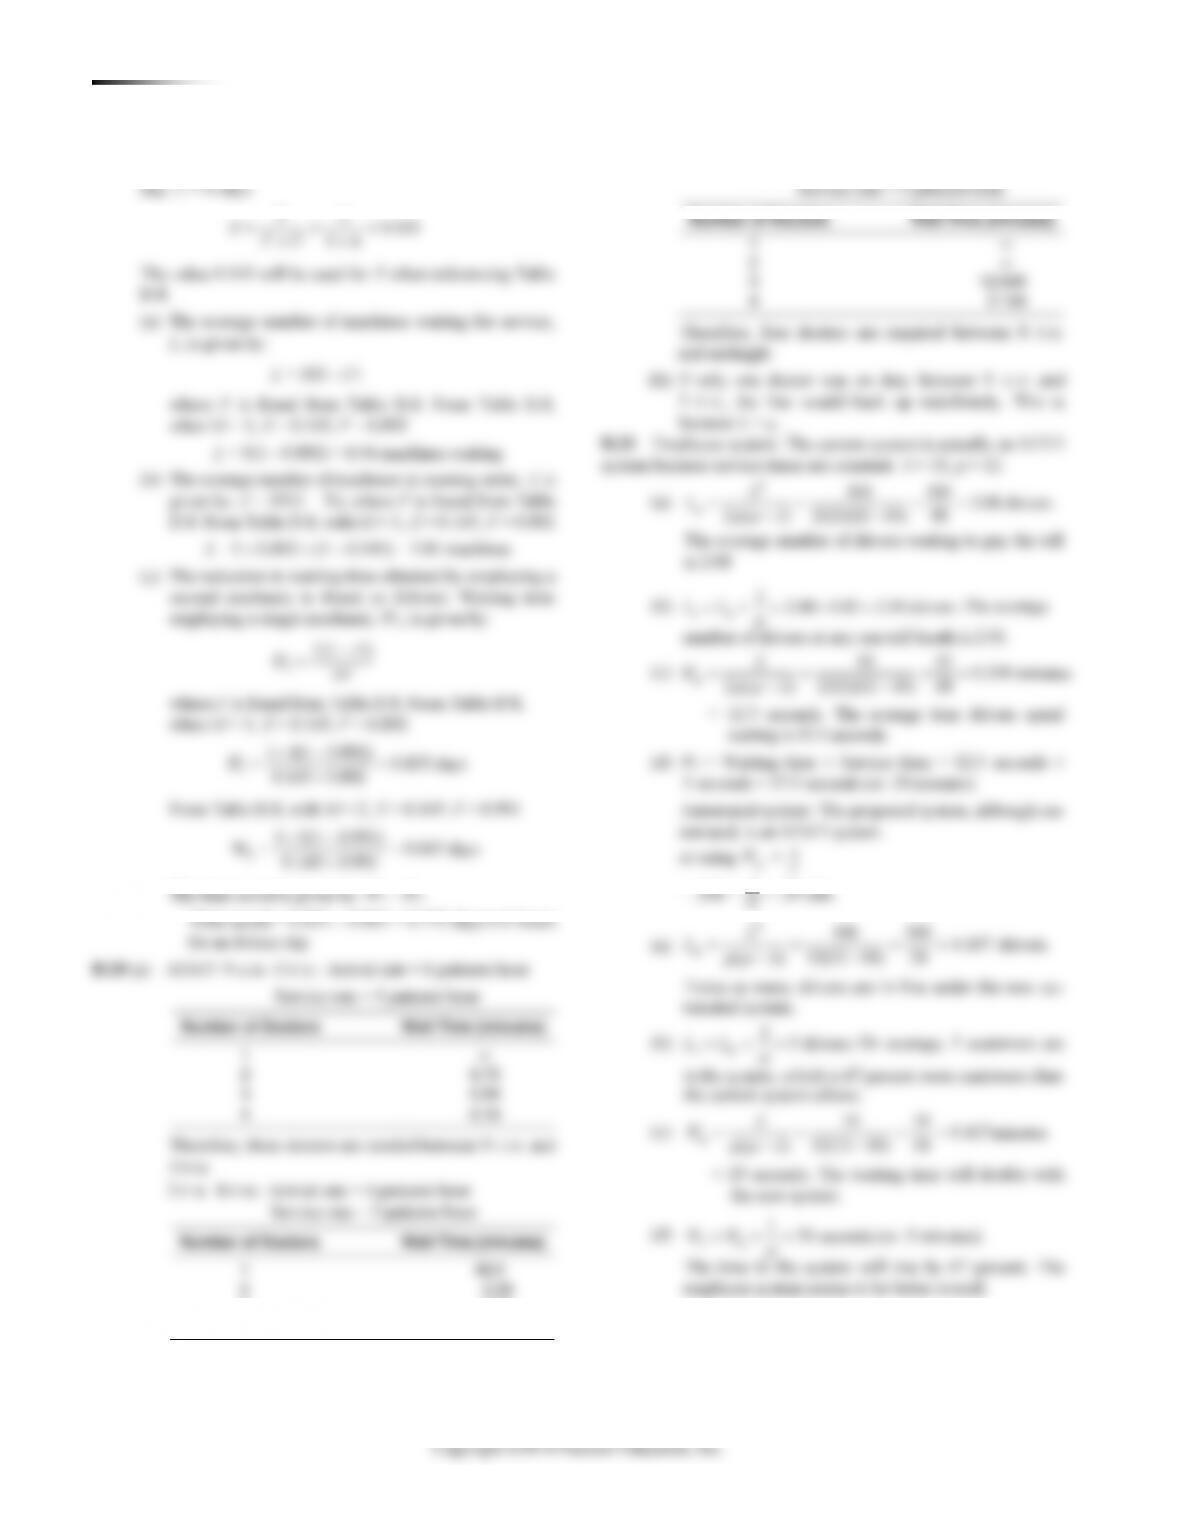
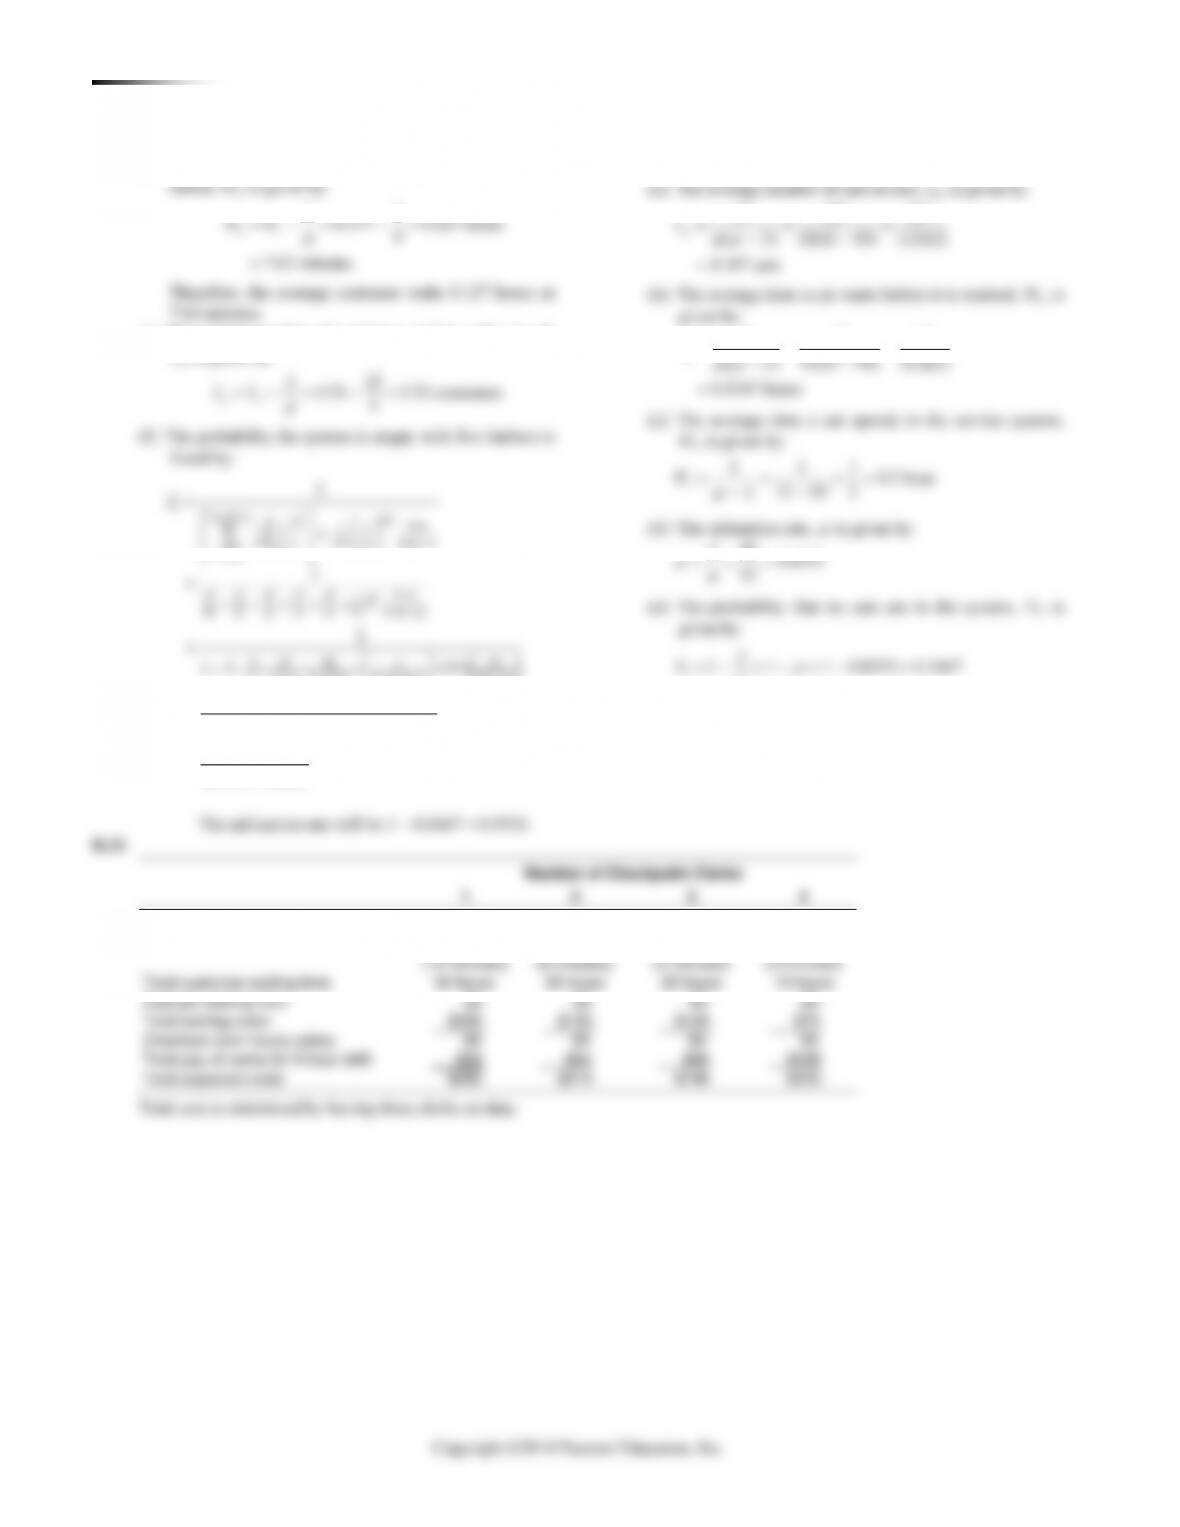
ADDITIONAL HOMEWORK PROBLEMS
(d) The utilization rate,
, is given by:
20 0.667
44 students
54
s
L
= = =
−−
(f) Adding a second server, we have:
4 students/minute
60 5 students/minute
12
2M
=
==
=
(b) The probability that the two-server system is empty,
P0, is given by:
( )
( )( )
01
11
!!
0
0 1 2 25
1 4 1 4 1 4
0! 5 1 5 1 2 5 2 5 4
216 10
41
25
4 1 4 5 2 25 6
5 2 5 10 4
160
4
5 360
1
1
11
1
1
1
1
nM nM
M
n M M
n
P
=−
−
=
−
−
=
+
=
++
==
++
++
=++
or:
0
11
0.429
1 0.8 0.53 2.33
P= = =
++
1
qs
WW
=−
where:
()
0
2
1
( 1)!( )
M
s
WP
MM
=+
−−
Then:
( )
2
4
5
2
2
5
0.429
(2 1)!(2 5 4)
5 0.64 1.373
0.429 1 36
1 (10 4)
0.038 minutes 2.3 seconds
q
W
=
− −
= =
−
==
(d) The average number of students in the queue for the
two-server system, Lq, is given by:
qs
LL
=−
where:
()
0
2
( 1)!( )
M
s
LP
MM
=+
−−
( )
2
2
5
45 0.429
(2 1)!(2 5 4)
4 5 0.64 5.492
0.429
1 (10 4) 1 36
0.153 students
q
L
=
− −
= =
−
=
(e) The average number of students in the two-server
system, Ls, is given by:
( )
0
2
( 1)!( )
4
0.153 0.953 students
5
M
sq
L P L
MM
= + = +
−−
= + =
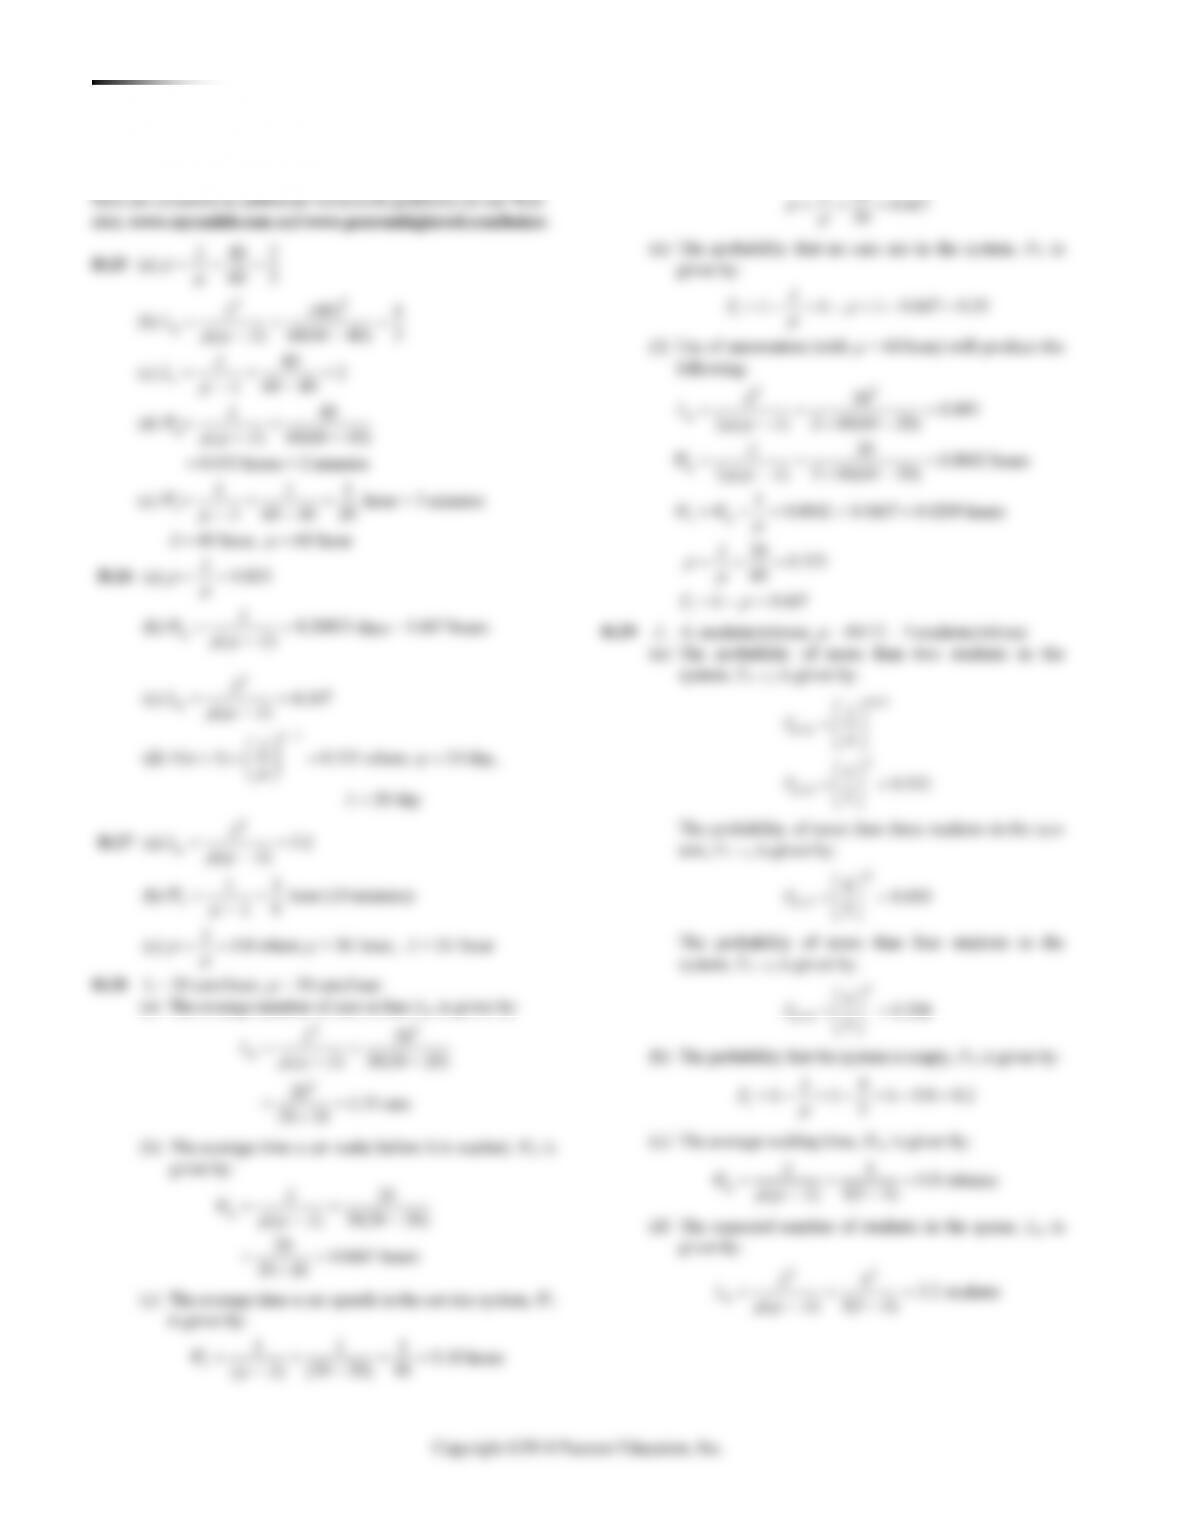
D.30 = 12/hour,
= 60/15 = 4/hour, M = 4
(a) The probability that the shop is empty, P0, is given by:
( )( )
=−
−
=
+ + + + −
+ + + +
−
=
+
=
=
=+ + + +
0
0 1 2 3
!
4
!
111
!
0
3 3 3 3 1 4 4
0 1! 2! 3! 4! 4 4 12
9 27 81 16
2 2 3 2 3 4 16 12
1
1
3
1
13
1
1 3 4.5 4.5 3.375 4
nM nM
M
n M M
n
P
0.0377.
(b) The average number of customers in the shop, waiting
or getting served, Ls, is given by:
( )
0
2
4
2
2
( 1)!( )
12 4 3 12
(0.0377)
3!(4 4 12) 4
12 4 81 (0.0377) 3
2 3 (16 12)
146.6 3 1.53 3 4.53
6 16
M
s
LP
MM
=+
−−
=+
−
=+
−
= + = + =
There are, on average, 4.53 persons in the shop.
(c) The average time spent in the shop, Ws, is given by:
4.53 0.378 hours 22.65 minutes
12
s
s
L
W
= = = =
324 BUSINESS ANALYTICS MODULE D WA I T I N G – LI N E MO D E L S
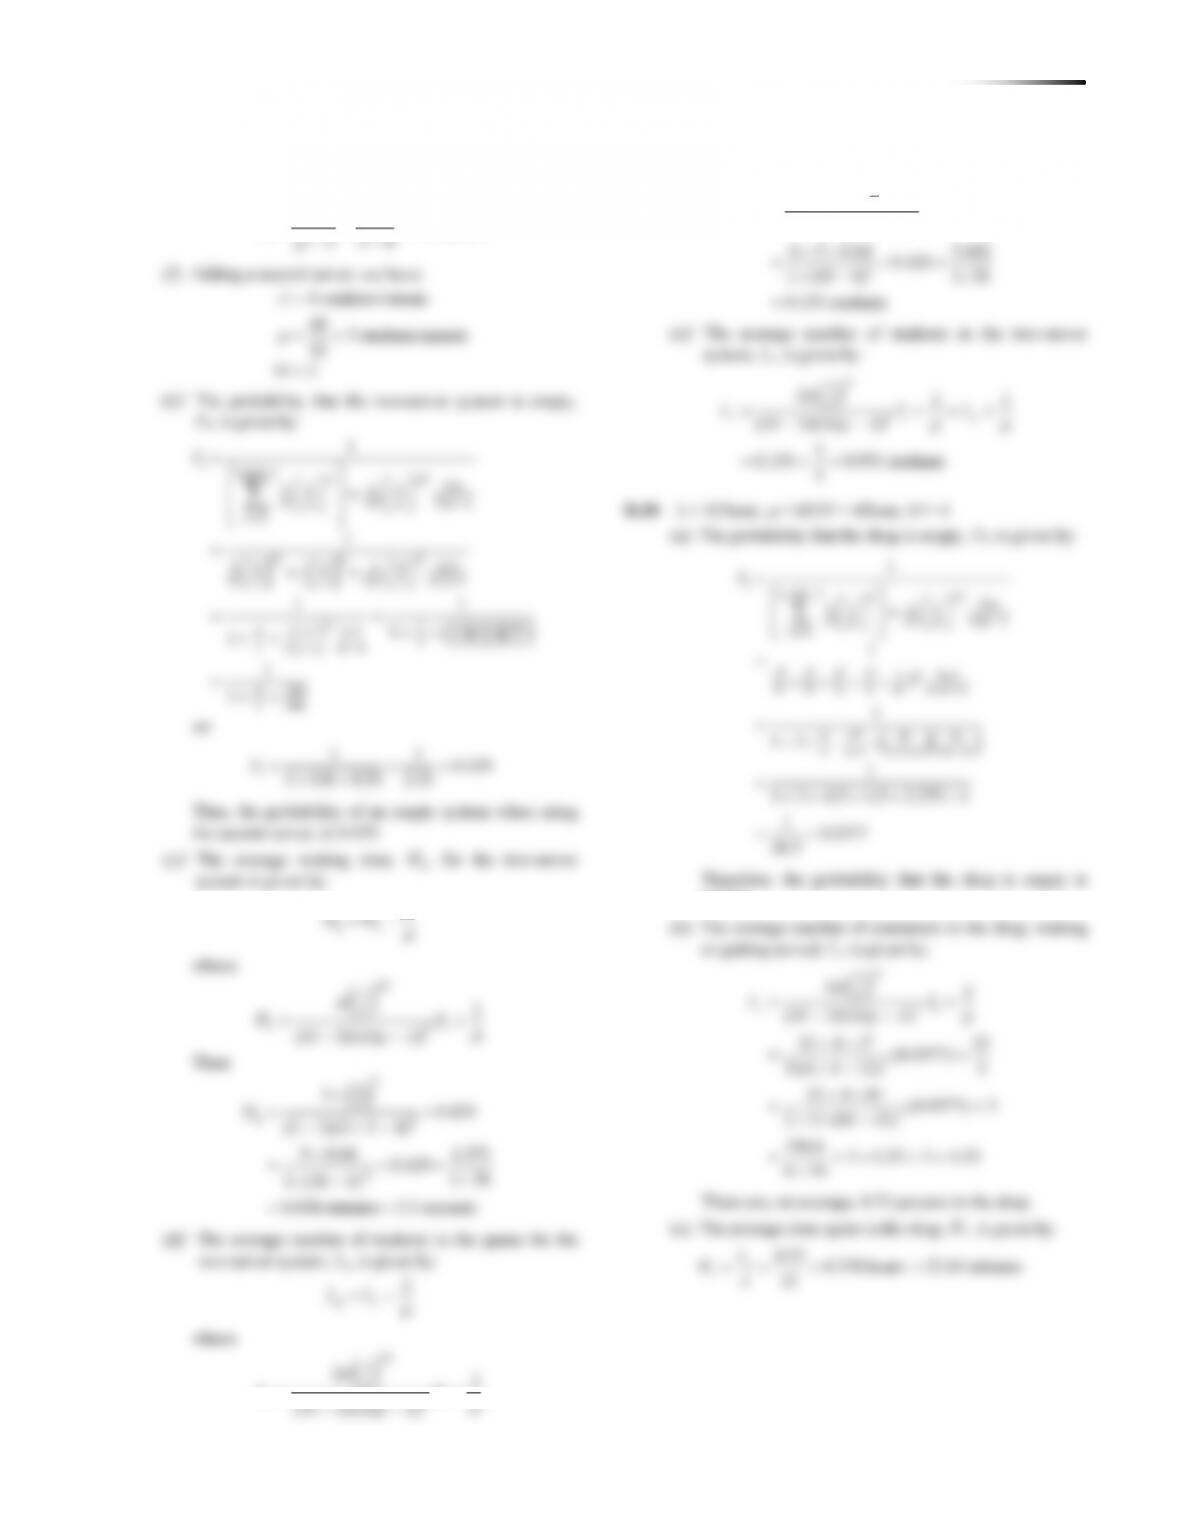
(d) The average time the customer spends waiting to be
11
0.377 0.127 hours
4
7.62 minutes
qs
WW
= − = − =
=
Therefore, the average customer waits 0.127 hours or
7.62 minutes.
(e) The average number of customers waiting to be served,
Lq, is given by:
12
4.53 1.53 customers
4
qs
LL
= − = − =
(f) The probability the system is empty with five barbers is
found by:
=−
−
=
=
+
0
!
111
!
0
1
nM nM
M
n M M
n
P
D.32 = cars/hour,
= 12 cars/hour.
2 2 2
10 10
( ) 12(12 10) (12)(2)
4.167 cars
q
L
= = =
−−
=
(b) The average time a car waits before it is washed, Wq, is
given by:
10 10
( ) 12(12 10) (12)(2)
0.4167 hours
q
W
= = =
−−
=
(c) The average time a car spends in the service system,
Ws, is given by:
1 1 1 0.5 hour
12 10 2
s
W
= = = =
−−
(d) The utilization rate,
, is given by:
10 0.8333
326 BUSINESS ANALYTICS MODULE D WA I T I N G – LI N E MO D E L S
queuing system. With four servers, the average time in the system
is 8.9 minutes, resulting in an overall average of:
0.2 30 + 0.8 8.9 = 13.1 minutes
With five servers, the average time is 3.9 minutes resulting in an
overall average of:
0.2 30 + 0.8 3.9 = 9.1 minutes
2. Therefore, the single waiting line with five clerks is the better
option.
ADDITIONAL CASE STUDY*
PANTRY SHOPPER
better system. We also assume the M/M/S model.
We begin with a rough analysis (one that is going to have a
very interesting feature, by the way). We assume that there are no
express lanes. Then, we want to find the average service time and
rate. The time is given by:
t = 0.2 (2 minutes) + 0.8 (4 minutes) = 0.4 + 3.2 = 3.6 minutes
This means that the average service rate is 60/3.6 = 16.67 custom-
ers per hour. Notice that this is not the same as taking 20 percent
of the rate of 30 and 80 percent of the rate of 15, which would
equal 18 and would be wrong.
*Solution to case that appears on our Web sites,
www.myomlab.com and www.pearsonhighered.com/heizer.
Using an arrival rate of 100 and a service rate of 16.67, the mini-
mum number of servers is 6. (This is due to round off.) In reality,
the minimum number is 7, and the average waiting time is 2.2
minutes. Trying one more server leads to a waiting time of 0.64
minutes.
Now we separate the express and regular customers. Assume
that all express customers go into the express lane (even though
they can go into any lane) and assume that all nonexpress custom-
ers go into the proper lanes (even though we all have seen people
with 20 packages get into a 10-items-or-less line).
For the express lane, with an arrival rate of 20 and a service
rate of 30, one server yields an average wait of 4 minutes, while
two servers yield an average wait of 0.25 minutes.
For the regular lane, with an arrival rate of 80 and a service
A 7–1 split yields an average wait of:
(0.2)(4) + (0.8)(0.98) = 0.8 + 0.784 = 1.584 minutes
which is better. However, the express lane would be slower than
322 BUSINESS ANALYTICS MODULE D WA I T I N G – LI N E MO D E L S
ADDITIONAL HOMEWORK PROBLEMS
(d) The utilization rate,
, is given by:
20 0.667
44 students
54
s
L
= = =
−−
(f) Adding a second server, we have:
4 students/minute
60 5 students/minute
12
2M
=
==
=
(b) The probability that the two-server system is empty,
P0, is given by:
( )
( )( )
01
11
!!
0
0 1 2 25
1 4 1 4 1 4
0! 5 1 5 1 2 5 2 5 4
216 10
41
25
4 1 4 5 2 25 6
5 2 5 10 4
160
4
5 360
1
1
11
1
1
1
1
nM nM
M
n M M
n
P
=−
−
=
−
−
=
+
=
++
==
++
++
=++
or:
0
11
0.429
1 0.8 0.53 2.33
P= = =
++
1
qs
WW
=−
where:
()
0
2
1
( 1)!( )
M
s
WP
MM
=+
−−
Then:
( )
2
4
5
2
2
5
0.429
(2 1)!(2 5 4)
5 0.64 1.373
0.429 1 36
1 (10 4)
0.038 minutes 2.3 seconds
q
W
=
− −
= =
−
==
(d) The average number of students in the queue for the
two-server system, Lq, is given by:
qs
LL
=−
where:
()
0
2
( 1)!( )
M
s
LP
MM
=+
−−
( )
2
2
5
45 0.429
(2 1)!(2 5 4)
4 5 0.64 5.492
0.429
1 (10 4) 1 36
0.153 students
q
L
=
− −
= =
−
=
(e) The average number of students in the two-server
system, Ls, is given by:
( )
0
2
( 1)!( )
4
0.153 0.953 students
5
M
sq
L P L
MM
= + = +
−−
= + =
D.30 = 12/hour,
= 60/15 = 4/hour, M = 4
(a) The probability that the shop is empty, P0, is given by:
( )( )
=−
−
=
+ + + + −
+ + + +
−
=
+
=
=
=+ + + +
0
0 1 2 3
!
4
!
111
!
0
3 3 3 3 1 4 4
0 1! 2! 3! 4! 4 4 12
9 27 81 16
2 2 3 2 3 4 16 12
1
1
3
1
13
1
1 3 4.5 4.5 3.375 4
nM nM
M
n M M
n
P
0.0377.
(b) The average number of customers in the shop, waiting
or getting served, Ls, is given by:
( )
0
2
4
2
2
( 1)!( )
12 4 3 12
(0.0377)
3!(4 4 12) 4
12 4 81 (0.0377) 3
2 3 (16 12)
146.6 3 1.53 3 4.53
6 16
M
s
LP
MM
=+
−−
=+
−
=+
−
= + = + =
There are, on average, 4.53 persons in the shop.
(c) The average time spent in the shop, Ws, is given by:
4.53 0.378 hours 22.65 minutes
12
s
s
L
W
= = = =
324 BUSINESS ANALYTICS MODULE D WA I T I N G – LI N E MO D E L S
(d) The average time the customer spends waiting to be
11
0.377 0.127 hours
4
7.62 minutes
qs
WW
= − = − =
=
Therefore, the average customer waits 0.127 hours or
7.62 minutes.
(e) The average number of customers waiting to be served,
Lq, is given by:
12
4.53 1.53 customers
4
qs
LL
= − = − =
(f) The probability the system is empty with five barbers is
found by:
=−
−
=
=
+
0
!
111
!
0
1
nM nM
M
n M M
n
P
D.32 = cars/hour,
= 12 cars/hour.
2 2 2
10 10
( ) 12(12 10) (12)(2)
4.167 cars
q
L
= = =
−−
=
(b) The average time a car waits before it is washed, Wq, is
given by:
10 10
( ) 12(12 10) (12)(2)
0.4167 hours
q
W
= = =
−−
=
(c) The average time a car spends in the service system,
Ws, is given by:
1 1 1 0.5 hour
12 10 2
s
W
= = = =
−−
(d) The utilization rate,
, is given by:
10 0.8333
326 BUSINESS ANALYTICS MODULE D WA I T I N G – LI N E MO D E L S
queuing system. With four servers, the average time in the system
is 8.9 minutes, resulting in an overall average of:
0.2 30 + 0.8 8.9 = 13.1 minutes
With five servers, the average time is 3.9 minutes resulting in an
overall average of:
0.2 30 + 0.8 3.9 = 9.1 minutes
2. Therefore, the single waiting line with five clerks is the better
option.
ADDITIONAL CASE STUDY*
PANTRY SHOPPER
better system. We also assume the M/M/S model.
We begin with a rough analysis (one that is going to have a
very interesting feature, by the way). We assume that there are no
express lanes. Then, we want to find the average service time and
rate. The time is given by:
t = 0.2 (2 minutes) + 0.8 (4 minutes) = 0.4 + 3.2 = 3.6 minutes
This means that the average service rate is 60/3.6 = 16.67 custom-
ers per hour. Notice that this is not the same as taking 20 percent
of the rate of 30 and 80 percent of the rate of 15, which would
equal 18 and would be wrong.
*Solution to case that appears on our Web sites,
www.myomlab.com and www.pearsonhighered.com/heizer.
Using an arrival rate of 100 and a service rate of 16.67, the mini-
mum number of servers is 6. (This is due to round off.) In reality,
the minimum number is 7, and the average waiting time is 2.2
minutes. Trying one more server leads to a waiting time of 0.64
minutes.
Now we separate the express and regular customers. Assume
that all express customers go into the express lane (even though
they can go into any lane) and assume that all nonexpress custom-
ers go into the proper lanes (even though we all have seen people
with 20 packages get into a 10-items-or-less line).
For the express lane, with an arrival rate of 20 and a service
rate of 30, one server yields an average wait of 4 minutes, while
two servers yield an average wait of 0.25 minutes.
For the regular lane, with an arrival rate of 80 and a service
A 7–1 split yields an average wait of:
(0.2)(4) + (0.8)(0.98) = 0.8 + 0.784 = 1.584 minutes
which is better. However, the express lane would be slower than